


Abstract
Adherence to low salt diets and control of hypertension remain unmet clinical needs in chronic kidney disease (CKD) patients.
We performed a 6-month multicentre randomized trial in non-compliant patients with CKD followed in nephrology clinics testing the effect of self-measurement of urinary chloride (69 patients) as compared with standard care (69 patients) on two primary outcome measures, adherence to a low sodium (Na) diet (<100 mmol/day) as measured by 24-h urine Na (UNa) excretion and 24-h ambulatory blood pressure (ABPM) monitoring.
In the whole sample (N = 138), baseline UNa and 24-h ABPM were143 ± 64 mmol/24 h and 131 ± 18/72 ± 10 mmHg, respectively, and did not differ between the two study arms. Patients in the active arm of the trial used >80% of the chloride strips provided to them at the baseline visit and at follow-up visits. At the third month, UNa was 35 mmol/24 h (95% CI 10.8–58.8 mmol/24 h; P = 0.005) lower in the active arm than the control arm, whereas at 6 months the between-arms difference in UNa decreased and was no longer significant [23 mmol/24 h (95% CI −5.6–50.7); P = 0.11]. The 24-h ABPM changes as well as daytime and night-time BP changes at 3 and 6 months were similar in the two study arms (Month 3, P = 0.69–0.99; Month 6, P = 0.73–0.91). Office BP, the use of antihypertensive drugs, estimated Glomerular Filtration Rate (eGFR) and proteinuria remained unchanged across the trial.
The application of self-measurement of urinary chloride to guide adherence to a low salt diet had a modest effect on 24-h UNa and no significant effect on 24-h ABPM.

INTRODUCTION
High blood pressure (BP) is a major, pervasive risk factor for cardiovascular disease in chronic kidney disease (CKD) patients. CKD represents a classic form of salt-dependent hypertension and ∼80% of CKD patients are frankly hypertensive [1]. In large databases of CKD patients under nephrology care in various countries, including US [2, 3], UK [4–6], Middle Eastern [7], Japanese [8] and Chinese [9] patients, sodium (Na) excretion ranged from 119 to 169 mmol/24 h, which is well above the target recommended by the Kidney Disease: Improving Global Outcomes (KDIGO) guidelines (<2 g/day, i.e. <87 mmol/day) [10]. Reducing salt intake is fundamental to optimize BP control, mitigate proteinuria and delay progression of renal disease and avert cardiovascular complications in these patients [11]. However, adherence to low salt diets and control of hypertension remain unmet clinical needs in this population [12].
The application of self-management policies is important in the care of patients with chronic diseases [13] because such an approach favours greater compliance with the prescribed interventions [14, 15]. Measurement of urinary Na (UNa) provides useful information for monitoring patients’ compliance with dietary salt prescriptions. However, UNa is usually measured in clinical pathology laboratories, which makes day-to-day Na monitoring a time-consuming, impractical procedure. For this reason, doctors fail to provide timely feedback on Na intake to patients. Similar to instruments allowing self-measurement of BP or blood glucose, simple devices measuring UNa hold potential for education and self-care in CKD patients. The technology for self-monitoring salt consumption based on the use of urine chloride strips applied to an overnight urine collection has existed since the 1980s [16] and recent methods allow reliable estimates of 24-h UNa [17].
Since the usefulness of biomarkers to guide treatment should be tested in clinical trials [18], we performed a multicentre randomized trial (ClinicalTrials.gov identifier: RF-2010-2314890), the Reducing Salt Intake by Urine Chloride Self-measurement Trial in CKD, testing a simple instrument for measuring urinary chloride to improve hypertension control and adherence to a low salt diet in CKD patients with a 24-h UNa during the run-in phase >100 mmol/24 h. We herein describe the results of that trial.
MATERIALS AND METHODS
The protocol of the trial conformed with the ethical guidelines of our institution and written informed consent was obtained from each participant.
Patients
Eligible patients for this open trial were subjects with confirmed CKD as defined by the KDIGO guidelines, i.e. evidence of kidney damage or kidney dysfunction [(eGFR) <60 mL/min/1.73 m2] present for >3 months [19], without a recent history of acute illness or hospitalization and BP >135/85 mmHg or controlled BP with the use of antihypertensive medications. Exclusion criteria included evidence that the patient was already compliant with a low Na diet (one 24-h urine collection with UNa <100 mmol/24 h), previous renal transplantation, acute kidney injury or rapidly progressive CKD, pregnancy or lactation, salt-wasting diseases, a major cardiovascular event that occurred during the 6 months preceding enrolment, history of neoplasia, atrial fibrillation [to avoid inaccuracies in ambulatory BP monitoring (ABPM)]. The institutional review boards at participating centres approved the study protocol and all study participants gave written informed consent. This study adhered to the principles of the Declaration of Helsinki and is registered on Clinical Trials.gov (RF-2010-2314890). Reporting follows the recommendations of the Consolidated Standards of Reporting Trials [20].
Study design
We performed a 6-month randomized trial in CKD patients testing the usefulness of self-measurement of urinary chloride as compared with standard care to increase adherence to a low Na diet (<100 mmol/24 h, i.e. ∼2.3 g Na) and to improve BP control in this population. We adopted a centralized randomization procedure by hiding the randomization list. This list was managed by the head of the Statistical Unit of the coordinating centre to ensure allocation concealment. Once received, the identification number of the patient who gave the informed consent to take part in the study and the allocation arm was communicated to the participant centre by phone and/or by e-mail.
The enrolment phase of the trial was from January 2016 to October 2017. At screening and the baseline, 3 and 6 month visits, patients in both study arms received in-person dietary counselling by a dietician or by a doctor who motivated patients to adhere to the dietary prescription. Each patient also received a booklet detailing the high salt foods to avoid in order to achieve the target Na intake (as an example, see https://www.fda.gov/media/84261/download). Counselling time and depth of topic discussion were individualized. Furthermore, patients in the active arm of the trial (self-measurement of urinary chloride) had specific training to ensure proper interpretation of the urine chloride strips, as detailed elsewhere [17]. Patients in this arm of the trial were instructed to measure urine chloride (see below) at least once a week during the first 1 month of the trial and every 2 weeks thereafter. Furthermore, they were instructed to repeat a urine chloride measurement if it exceeded 100 mmol/24 h. If values beyond this threshold were confirmed in a second measurement, then patients were instructed to contact the study personnel (a dietician or a research nurse with training on nutrition) to review their adherence to the low Na diet. In addition, patients with confirmed high urine chloride were asked to maintain telephone contacts with study personnel to receive additional advice whenever needed. Study participants of both study arms were instructed to maintain a stable calorie intake as well as a stable intake of proteins and other nutrients. They were also instructed to not alter their coffee, alcohol and smoking habits and physical activity.
Chloride reactive strips
We adapted a commercially available method (Quantofix, Macherey-Nagel, Duren, Germany) [21] based on strips that are simple to use and have a short reaction time. The validation of this adapted method is reported elsewhere [17]. In this study, the use of chloride strips was considered simple and helpful for enhancing compliance to dietary Na levels by CKD patients [17] . Adherence to the self-measurement of urine chloride was determined by counting the number of strips returned at each visit. The strip method had 75.5% sensitivity and 82.6% specificity to correctly classify patients with UNa >100 mmol/24 h. The positive and negative predictive values were 90.2 and 61.3%, respectively. The overall accuracy (receiver operating characteristics curve analysis) of urine chloride self-measurement for the >100 mmol/24-h Na threshold was 87% (95% CI 77–97) [17].
Main study outcomes: methods of measurement
The main study outcomes were 24-h ABPM and 24-h UNa, which were measured at baseline and repeated at 3 and 6 months. In all centres, 24-h ABPM was always measured by instruments complying with the Association for the Advancement of Medical Instrumentation criteria and following recommendations of the European Society of Hypertension (ESH) [22]. According to the ESH guidelines [22], we considered valid all 24-h recordings with at least 70% of expected measurements, at least 20 valid awake and 7 valid asleep measurements, at least 2 valid daytime and 1 valid night-time measurement per hour. Twenty-four-hour ABPM measurements were performed every 15 min both during the day (7 a.m.–10 p.m.) and at night (10 p.m.–7 a.m.). Patients were instructed to maintain their usual level of activity. As an indicator of the BP burden during the night, we considered the average values of systolic and diastolic BP between 10 p.m. and 7 a.m. Twenty-four-hour UNa was measured in the central laboratory of the hospital of the coordinating centre (CNR-IFC, Clinical Epidemiology of Renal Diseases and Hypertension Unit) by an ion-selective electrode using a Beckman EA-2 Electrolyte Analyser (Fullerton, CA, USA). Secondary outcomes were changes in 24-h proteinuria and GFR as estimated by the Modification of Diet in Renal Disease formula [23].
Outcomes and power calculation
We calculated that at least 126 patients randomly allocated by 1:1 ratio in the two study arms were needed to detect (α error = 0.05, β error = 0.20) as statistically significant a 4-mmHg difference [standard deviation (SD) 8] in the change of 24-h systolic BP between the control and active arms. The same number of patients was also sufficient for capturing as statistically significant (α error = 0.05, β error = 0.20) a difference of ≥30 mmol(SD 60) in 24-h UNa changes between the two study arms. By considering a potential attrition rate of 10%, the total sample size requested for both outcomes was 138 patients (69 patients in the active arm and 69 patients in the control arm). Secondary outcome measures of this study were changes in office BPs, number of antihypertensive drugs, eGFR and 24-h proteinuria.
Statistical analysis
Data were expressed as mean and SD, median and interquartile range (IQR) or as percent frequency and between-group comparisons were made by t-test, Mann–Whitney test or χ2 test, as appropriate. The effect of the allocation arm (active versus control group) on primary study outcome changes over time (namely, 24-h, daytime and night-time BP components as well as 24-h UNa) were investigated by standard between-arms comparisons (independent t-test at 3 and 6 months) and by linear mixed models (LMMs) analyses. In LMMs, having 24-h, daytime and night-time BP components as dependent variables, we always adjusted for the potential confounding effect of baseline office systolic BP, which was lower (P = 0.05) in the active group than in the control group (see Table 1). The evolutions over time of office BP, number of antihypertensive drugs, eGFR and 24-h urinary protein were compared between the study arms by the LMM and the generalized estimating equation (GEE), as appropriate. All calculations were made using standard statistical software (SPSS for Windows version 22, IBM, Armonk, NY, USA; Stata version 13 for Windows, StataCorp, College Station, TX, USA).
Main demographic, clinical and biochemical characteristics of the study population
| Characteristics | Control group (n = 69) | Active group (n = 69) | P-value |
|---|---|---|---|
| Age (years) | 68 ± 10 | 67 ± 12 | 0.65 |
| Male, n (%) | 52 (75) | 47(68) | 0.35 |
| BMI (kg/m2) | 28.0 ± 3.5 | 28.8 ± 4.6 | 0.27 |
| Diabetic, n (%) | 22 (32) | 25(36) | 0.59 |
| Smoker, n (%) | 16 (23) | 18 (27) | 0.66 |
| On antihypertensive treatment, n (%) | 65 (94) | 65 (94) | 0.43 |
| Total number of antihypertensive drugs | 2.6 ± 1.3 | 2.6 ± 1.4 | 0.84 |
| Office systolic BP (mmHg) | 154 ± 14 | 150 ± 11 | 0.05 |
| Office diastolic BP (mmHg) | 84 ± 10 | 83 ± 11 | 0.58 |
| 24-h systolic BP (mmHg) | 133 ± 19 | 129 ± 17 | 0.13 |
| 24-h diastolic (mmHg) | 72 ± 9 | 72 ± 10 | 0.69 |
| Daytime systolic BP (mmHg) | 136 ± 18 | 131 ± 16 | 0.11 |
| Daytime diastolic BP (mmHg) | 75 ± 9 | 74 ± 10 | 0.84 |
| Night-time systolic BP (mmHg) | 128 ± 21 | 121 ± 16 | 0.03 |
| Night-time diastolic BP (mmHg) | 68 ± 10 | 65 ± 10 | 0.15 |
| Total cholesterol (mg/dL) | 173 ± 43 | 172 ± 40 | 0.84 |
| eGFR (mL/min/1.73 m2) | 36 ± 13 | 39 ± 16 | 0.37 |
| Urinary protein (g/24 h), median (IQR) | 0.40 (0.20–1.45) | 0.35 (0.13–1.02) | 0.40 |
| UNa (mmol/24 h) | 148 ± 63 | 138 ± 65 | 0.34 |
| Haemoglobin (g/dL) | 12.7 ± 1.6 | 13.2 ± 1.6 | 0.18 |
| Albumin (g/dL) | 4.0 ± 0.4 | 4.1 ± 0.4 | 0.23 |
| Calcium (mg/dL) | 4.7 ± 0.3 | 4.7 ± 0.3 | 0.09 |
| Phosphate (mg/dL) | 3.6 ± 0.7 | 3.6 ± 0.8 | 0.87 |
| C-reactive protein (mg/L), median (IQR) | 1.4 (0.6–2.9) | 1.2 (0.6–3.7) | 0.91 |
Data are expressed as mean ± SD unless stated otherwise.
RESULTS
From a source population formed by 1010 patients who met the inclusion criteria, 861 declined to take part in the study for personal and/or logistic reasons. Thus 149 patients (i.e. 17% of the total eligible population) were randomized to the experimental (n = 73) and control (n = 76) arms. During the trial, four patients in the experimental arm and seven in the control arm dropped out before the first study visit. The reasons for dropout were due to logistics and unwillingness to continue the study. Thus 69 patients per arm completed the trial (Figure 1).
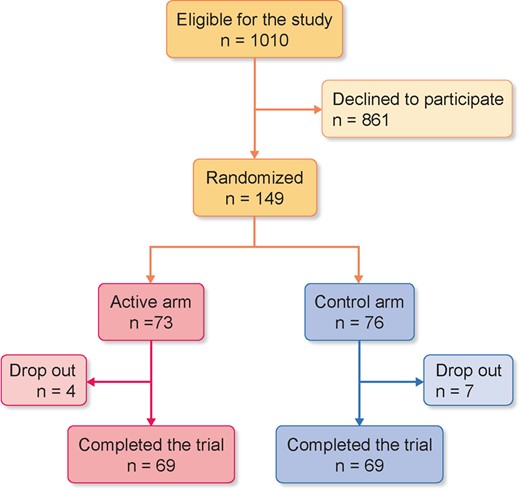
Flow chart of the patients enrolled in the trial. The reasons for drop-out were logistics and unwillingness to continue the study.
A total of 130 patients (94%) were on antihypertensive treatment. Twenty-one patients were on monotherapy with angiotensin-converting enzyme inhibitors or angiotensin II receptor antagonists (n = 15), calcium channel blockers (n = 4), β-blockers (n = 1) and diuretics (n = 1) and the remaining 109 patients were on double (n = 44), triple (n = 31) or more than triple (n = 34) treatment with various combinations of these drugs. Thirty-three patients were on statins. The two groups were similar for demographic and clinical variables except for office systolic BP (P = 0.05), this being 4 mmHg higher in patients in the control arm than those in the active arm (Table 1). At baseline, the mean value of 24-h UNa was 138 ± 65 mmol/24 h in the active arm [>100 mmol/24 h in 50/69 patients (72%)] and 148 ± 63 mmol/24 h in the control arm [>100 mmol/24 h in 55/69 patients (80%)]. The average number of antihypertensive drugs was identical between the two groups (active arm 2.6 ± 1.4 versus control arm 2.6 ± 1.3) and this was true for all 24-h ABPM groups versus those in the control group.
Adherence to the self-measurement of urine chloride intervention
All patients in the active arm used >80% of the strips provided to them at the baseline visit and at follow-up visits and there were no missing data for the main outcome measures (24-h ABPM and 24-h UNa)
UNa and 24-h ABPM
UNa linearly decreased in patients in the active group (baseline: 138 ± 65 mmol/24 h; 3 months: 130 ± 54 mmol/24 h; 6 months: 124 ± 50 mmol/24 h), while it displayed a non-linear pattern across visits in patients in the control group (Figure 2). At 3 months, UNa modestly decreased in the self-measurement group (mean −16.0 ± 59.3 mmol/24 h) and increased in the control group (mean 18.7 ± 66.6 mmol/24 h) [between-arms difference 35 mmol/24 h (95% CI 10.8– 58.8 mmol/24 h); P = 0.005], whereas no such difference was observed at 6 months [self-measurement group −16.8 ± 52.7 mmol/L versus control group 5.8 ± 81.3 mmol/L; between-arms difference 23 mmol/24 h (95% CI −5.6–50.7 mmol/24 h); P = 0.11]. The individual changes in UNa across the trial are shown in Supplementary data, Figure S1. Adherence to the low salt diet (UNa <100 mmol/24 h) at 3 and 6 months was 13% and 12%, respectively, in the control arm and 27% and 30%, respectively, in the active arm. In an LMM analysis using repeated measurements of UNa over the whole study period, the between-arms difference in this biomarker was 25 mmol/24 h (95% CI −41 to −8; P = 0.003). No heterogeneity among participating centres was found for the between-arms difference in changes of UNa (Supplementary data, Figure S2). The 24-h ABPM changes, as well as daytime and night-time BP changes at 3 and 6 months, were similar in the two study arms either when investigated by standard between-arms comparisons at 3 months (P = 0.69–0.99) and 6 months (P = 0.73–0.91) or by LMMs over the whole study period (P = 0.09– 0.83 by the LMM). The detailed changes in 24-h ABPM at 3 and 6 months are described in Table 2.
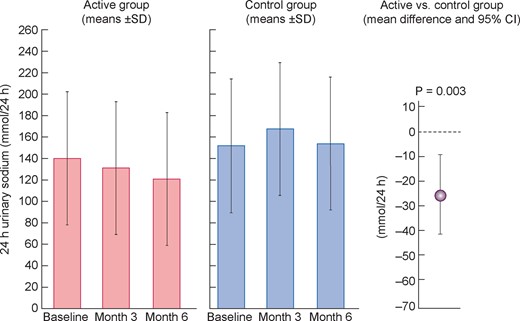
UNa at baseline and 3 and 6 months during the trial. Data are mean ± SD. The global difference in UNa excretion among the two groups across the whole trial was calculated by the LMM.
The 24-h and clinic BP values by study arms at 3 and 6 months
| BP type | Control group | Active group | Control group | Active group | ||
|---|---|---|---|---|---|---|
| Baseline versus 3 months | Baseline versus 3 months | P-value | Baseline versus 6 months | Baseline versus 6 months | P-value | |
| 24-h systolic BP (mmHg) | 0.12 ± 12.85 | 0.15 ± 12.31 | 0.99 | −2.24 ± 12.84 | −1.38 ± 12.79 | 0.75 |
| 24-h diastolic BP (mmHg) | −0.28 ± 7.63 | −0.30 ± 6.33 | 0.99 | −0.48 ± 7.62 | −0.65 ± 7.12 | 0.91 |
| Daytime systolic BP (mmHg) | −0.47 ± 13.95 | 0.82 ± 10.67 | 0.60 | −2.44 ± 14.74 | −1.39 ± 13.04 | 0.72 |
| Daytime diastolic BP (mmHg) | −0.37 ± 7.76 | −0.12 ± 5.76 | 0.85 | −0.21 ± 8.15 | −0.69 ± 7.49 | 0.77 |
| Night-time systolic BP (mmHg) | 1.08 ± 13.83 | 1.05 ± 12.74 | 0.99 | −1.81 ± 12.77 | −0.16 ± 12.48 | 0.53 |
| Night-time diastolic BP (mmHg) | −0.38 ± 8.35 | 0.22 ± 7.02 | 0.69 | −1.18 ± 7.97 | −0.62 ± 7.37 | 0.73 |
| Office systolic BP (mmHg) | −1.67 ± 11.48 | 1.07 ± 10.73 | 0.20 | −2.02 ± 12.15 | 1.06 ± 11.04 | 0.20 |
| Office diastolic BP (mmHg) | 0.06 ± 11.47 | 0.22 ± 10.26 | 0.94 | 0.005 ± 11.41 | −0.45 ± 9.60 | 0.84 |
Data expressed as mean ± SD.
Secondary outcome measures: GFR and proteinuria
Estimated GFR remained unchanged over time in both the control (baseline: 36 ± 13 mL/min/1.73 m2, 3 months: 38 ± 15 mL/min/1.73 m2, 6 months: 37 ± 15 mL/min/1.73 m2) and the active arm (baseline: 39 ± 16 mL/min/1.73 m2, 3 months: 38 ± 16 mL/min/1.73 m2, 6 months: 36 ± 16 mL/min/1.73 m2) and the between-arms difference was 1.6 mL/min/1.73 m2 (95% CI −3.2–6.4 mL/min/1.73 m2; P = 0.51) by the LMM. This was also true for 24-h urinary protein [control group, baseline: median 0.40 g/24 h (IQR) 0.20–1.45; 3 months: 0.43 g/24 h (IQR 0.22–1.37); 6 months: 0.37 g/24 h (IQR 0.17–1.36); active group, baseline: median 0.35 g/24 h (IQR 0.13–1.03); 3 months: 0.37 g/24 h (IQR 0.20–0.99); 6 months: 0.28 g/24 h (IQR 0.16–0.88); P = 0.11, by the GEE method]. Office systolic and diastolic BPs remained quite stable over time (see Table 2) and did not differ between the two groups [between-arms difference: systolic BP −0.5 mmHg (95% CI −1.3–0.3); P = 0.18 by the LMM; between-arms difference: diastolic BP −0.2 mmHg (95% CI −1.8–1.4); P = 0.80 by the LMM]. The total number of antihypertensive drugs remained unchanged over time in both the control (baseline: 2.6 ± 1.3, 3 months: 2.6 ± 1.3, 6 months: 2.6 ± 1.3) and the active arm (baseline: 2.6 ± 1.4, 3 months: 2.5 ± 1.4 drugs, 6 months: 2.5 ± 1.3 drugs) [between-arms difference: 0.09 (95% CI −0.53–0.34); P = 0.67 by the LMM].
DISCUSSION
In this randomized trial in CKD patients an intervention of dietary Na reduction guided by self-measurement of urinary chloride produced a significant but modest difference in UNa between the intervention and the control arm and no difference in 24-h ABPM and in clinic BP.
CKD is a classic salt-dependent form of hypertension and >50% of CKD patients are frankly hypertensive. Accordingly, low salt intake is considered a fundamental complement to drug therapy to optimize BP control in these patients. However, only a minority of CKD patients maintain Na intake in the recommended range and adequate BP control [4, 24].
While two short (2–4 weeks) randomized crossover trials of salt reduction in CKD showed a marked hypotensive effect of low salt diet in this population [25, 26], evidence that a reduction in salt intake can be maintained in the long term in clinical practice is limited and controversial. A 6-month trial that tested the effect of educational cooking sessions in hypertensive Bangladeshi CKD patients with a very high salt intake (an average 24-h UNa of 261 mmol/24 h) showed that this intervention substantially reduced salt excretion as well as 24-h ABPM at 6 months [27]. In contrast, in a 2-year trial [6] that applied a multimodal intervention, including dietary Na reduction, medication adherence improved significantly but compliance with salt intake recommendations did not. Also, a 6-month trial by Meuleman et al. [28] showed a mild and transient reduction in UNa at 3 months in the intervention arm, but this reduction waned at 6 months. A recent, carefully designed trial by Humalda et al. [29] comparing routine care with routine care plus a web-based self-management intervention produced results substantially similar to those of the trial by Meuleman et al.[28], i.e. a transient reduction in UNa and in BP at 3 months. Self-care improves compliance, quality of life and psychological well-being and allows patients better coping with chronic diseases [30], including CKD [31]. Simple instruments to allow self-measurement of UNa by urinary chloride strips [16, 32] or by ion electrodes [33] or by an electrophoresis-based self-test platform [34] have been developed over the years. However, only the last of these instruments has been tested in a clinical trial in CKD patients [28]. In this study, the intervention group showed a modest reduction in Na excretion (mean change −30.3 mmol/24 h) and in daytime ambulatory diastolic BP (−3.4 mmHg) as compared with the control group, but these effects were no longer present at 6 months.
In the present trial, education aimed at reducing salt intake was applied in both study arms at baseline and reinforced at each study visit. In addition, patients in the Na self-measurement arm were trained in self-measurement of urine chloride and those with high urine chloride values received additional training and assistance by a dietician or by a nurse with experience in renal nutrition on how to improve their adherence to low salt intake. Overall, salt reduction in our trial (mean −25 mmol/24 h) was similar to that in the trial by Meuleman et al. [28], but we found no significant change in 24-h ABPM at both 3 and 6 months. In both the Meuleman et al. [28] trial and our trial, UNa at baseline was only moderately increased (∼140–170 mmol/24 h) and much lower than in the study by De Brito-Ashurst et al. (261 mmol/24 h) [27]. Furthermore, post-intervention Na excretion (141 mmol/24 h) in the De Brito-Ashurst et al. study [27] was of the same order of baseline Na excretion in the two studies discussed above. In a trial in the general population, the Trial of Hypertension Prevention [35], which evaluated a multifactorial salt reduction intervention in overweight normotensive people, net decreases in Na excretion were 44 mmol/24 h at 18 months and 38 mmol/24 h at 36 months in the active versus the control arm of the trial. The corresponding net decreases in systolic/diastolic BP were 2.0/1.4 mmHg at 18 months and 1.7/0.9 mmHg at 36 months. These changes in Na excretion and in BP are similar to those in the present trial.
A meta-analysis of 11 trials in CKD patients [36], including salt reduction interventions of various intensity—from 1.2 to 5 g/24 h—and trials lasting just 1 or 2 weeks, showed an average reduction in Na excretion of 80 mmol/24 h. The corresponding average reduction in systolic BP was −4.9 mmHg (95% CI −6.8 to −3.1) and −5.9 mmHg (95% CI −9.5 to −2.3) for clinic BP and 24-h ABPM, respectively, and −2.3 mmHg (95% CI −3.5 to −1.2) and −3.0 mmHg (95% CI −4.3 to −1.7) for clinic and 24-h ABPM diastolic pressures, respectively. The reduction in 24-h systolic ABPM at 6 months in our trial (−1.4 mmHg) was below the lower limit of the 95% CI of this meta-analysis (−2.3 mmHg), which may depend on the fact that in the same meta-analysis interventions lasting >4 weeks, like our 6-month trial, were less efficacious in reducing 24-h Na excretion than shorter salt reduction interventions [36]. Thus the long-term sustainability of a low salt diet limits the beneficial effects of this dietary intervention and the use of interventions contemplating self-measurement of UNa fail to improve compliance to dietary Na prescriptions. Self-monitoring of blood glucose (SMBG) levels is considered as the standard of care for maintaining long-term control of hyperglycaemia in patients with diabetes. However, a meta-analysis of individual patient data of six trials largely failed to show a clinically meaningful effect of management of type 2 diabetes by SMBG compared with management without self-monitoring [37]. Modification of nutritional habits is difficult to maintain in the long term and resource-intensive efforts aimed at modifying salt intake with complex interventions including education, motivational interviewing and coaching led to a modest and transient reduction in UNa excretion in the trial by Meuleman et al. [28].
A strength of this study is the high retention of patients and the lack of missing data on the main study outcomes. On the other hand, in contrast with the short-term trial by McMahon et al. [25], our study was not blinded because self-measurement of urine chloride to maintain this parameter below a preset threshold is an active intervention, making blinding inapplicable. Furthermore, 24-h urine collection is a cumbersome undertaking. However, because of the educational intervention and the frequent contact with study personnel, compliance with the self-monitoring intervention was good in the present trial. Another limitation is the fact that participants were recruited from the pool of patients on follow-up at participating centres. Therefore their Na intake might have already been reduced prior to baseline measurements. This could be because most nutritional guidelines for CKD patients recommend an upper limit of 90–100 mmol of Na per day. Since the magnitude of the reduction in UNa across time is closely dependent on the corresponding baseline value, this might have contributed to the modest effects we found between the active and control arms of the trial. However, the baseline Na excretion of patients enrolled in this study was well in the range typically observed among CKD patients under nephrology care worldwide [2–9] and much higher than the target level recommended by current guidelines (<2 g Na, i.e. <87 mmol/24 h) [10].
In conclusion, the application of a self-measurement method of urine chloride that patients consider simple and helpful [17] for enhancing their adherence to dietary Na recommendations has a modest effect on 24-h UNa and no significant effect on clinic and 24-h ABPM in CKD patients with modestly elevated dietary Na followed in nephrology clinics.
SUPPLEMENTARY DATA
Supplementary data are available at ndt online.
FUNDING
The study was supported by a grant from the Italian Ministry of Health.
CONFLICT OF INTEREST STATEMENT
No conflicts of interest are related to this article.
(See related article by Burnier and Fouque. The unsolved challenge of implementing sustained reductions of sodium intake in patients with chronic kidney disease. Nephrol Dial Transplant 2021; 36: 1148–1151)
REFERENCES
Macherey-Nagel GmbH & Co. KG. QUANTOFIX® Chloride [Internet]. ftp://ftp.mn-net.com/english/Instruction_leaflets/QUANTOFIX/91321en.pdf


Comments