


Abstract
Iron sucrose (FeS) administration induces a state of renal preconditioning, protecting against selected forms of acute kidney injury (AKI). Recent evidence suggests that recombinant hepcidin also mitigates acute renal damage. Hence the goals of this study were to determine whether a new proprietary FeS formulation (‘RBT-3’) can acutely activate the hepcidin (HAMP1) gene in humans, raising plasma and renal hepcidin concentrations; assess whether the kidney participates in this posited RBT-3–hepcidin generation response; test whether RBT-3 can mitigate a clinically relevant AKI model (experimental cisplatin toxicity) and explore whether mechanisms in addition to hepcidin generation are operative in RBT-3’s cytoprotective effects.
Healthy human volunteers (n = 9) and subjects with Stages 3–4 CKD (n = 9) received 120, 240 or 360 mg of RBT-3 (intravenously over 2 h). Plasma and urine samples were collected and assayed for hepcidin levels (0–72 h post-RBT-3 injection). In complementary mouse experiments, RBT-3 effects on hepatic versus renal hepcidin (HAMP1) messenger RNA (mRNA) and protein levels were compared. RBT-3’s impact on the mouse Nrf2 pathway and on experimental cisplatin nephrotoxicity was assessed. Direct effects of exogenous hepcidin on in vivo and in vitro (HK-2 cells) cisplatin toxicity were also tested.
RBT-3 induced rapid, dose-dependent and comparable plasma hepcidin increases in both healthy volunteers and chronic kidney disease subjects (∼15 times baseline within 24 h). Human kidney hepcidin exposure was confirmed by 4-fold urinary hepcidin increases. RBT-3 up-regulated mouse hepcidin mRNA, but much more so in kidney (>25 times) versus liver (∼2 times). RBT-3 also activated kidney Nrf2 [increased Nrf2 nuclear binding; increased Nrf2-responsive gene mRNAs: heme oxygenase-1, sulfiredoxin-1, glutamate-cysteine ligase catalytic subunit and NAD(P)H quinone dehydrogenase 1]. RBT-3 preconditioning (18 h time lapse) markedly attenuated experimental cisplatin nephrotoxicity (∼50% blood urea nitrogen/creatinine decrements), in part by reducing renal cisplatin uptake by 40%. Exogenous hepcidin (without RBT-3) treatment conferred protection against mild in vivo (but not in vitro) cisplatin toxicity.
RBT-3 acutely and dramatically up-regulates cytoprotective hepcidin production, increasing renal hepcidin levels. However, additional cytoprotective mechanisms are activated by RBT-3 (e.g. Nrf2 activation; reduced cisplatin uptake). Thus RBT-3-induced preconditioning likely confers renal resistance to cisplatin via an interplay of multiple cytoprotective activities.

What is already known about this subject?
Hepcidin can be up-regulated by excess iron exposure.
Recombinant hepcidin can exert renal protective effects [e.g. mitigating experimental ischemic and septic acute kidney injury (AKI)].
What this study adds?
A new propriety iron sucrose preparation, ‘RBT-3’, markedly increases (up to 15 times) hepcidin levels in both healthy human subjects and CKD patients, leading to marked renal hepcidin loading.
RBT3 also activates the cytoprotective renal Nrf2 pathway and decreases renal cisplatin uptake in mice.
As a result, marked renal protection, most likely multifactorial in nature, is conferred against experimental cisplatin toxicity.
What impact this may have on practice or policy?
RBT3 can safely recapitulate renal hepcidin loading that now requires recombinant hepcidin administration.
RBT-3 exerts multiple cytoprotective actions, in addition to hepcidin loading (e.g. Nrf2 pathway activation, antioxidant ferritin up-regulation and decreased renal cisplatin accumulation).
The above findings, and that RBT-3 is well tolerated, suggest its potential utility as a clinical renal preconditioning agent for the prevention of AKI.
INTRODUCTION
Hepcidin is a well-recognized iron sensing and regulatory protein that is produced predominantly in hepatocytes in response to chronic iron overload or pro-inflammatory states [1]. While it was initially considered to have antimicrobial properties [2], in recent years it has been convincingly demonstrated that it also induces kidney protective effects [3–7]. For example, recombinant hepcidin administration has been shown to mitigate experimental ischemic acute kidney injury (AKI) [6]. Conversely, hepcidin-deficient mice are highly susceptible to ischemic renal damage [6]. The mechanism by which hepcidin exerts its protective actions remains speculative. However, most interest has focused on the following potential pathway [6, 7]: (i) due to its small size (25 kDa), hepcidin undergoes rapid glomerular filtration, followed by proximal tubule endocytic uptake; (ii) hepcidin binds to the iron exporter ferroportin, causing its cellular redistribution and subsequent proteolytic destruction; (iii) ferroportin loss can increase intracellular catalytic iron levels; and (iv) an increase in cytosolic iron can stimulate ferritin synthesis, which can confer its own cytoprotective/antioxidant effects [8, 9]. However, alternative protective mechanisms may also be operative. As just one example, synergistic interactions between the hepcidin and the cytoprotective Nrf2 pathways appear to exist [10–13].
Given the burgeoning evidence that hepcidin can confer renal protection against AKI, we questioned whether administration of a new proprietary intravenous (IV) iron sucrose (FeS) preparation (‘RBT-3’) can acutely increase hepcidin production and secondarily increase renal hepcidin levels. FeS has its own cytoprotective properties (e.g. increases in antioxidant defenses, most notably ferritin) [8]. Thus if FeS were also to increase hepcidin levels, FeS/RBT-3 could function as a multifactorial AKI preconditioning agent.
Toward this end, we administered different doses of RBT-3 to healthy volunteers (HVs) and subjects with Stages 3–4 CKD and measured plasma hepcidin changes from baseline over a 72-h period. Urinary hepcidin levels were also assayed to confirm renal hepcidin delivery. In complimentary mouse experiments, the potential effect of RBT-3 on hepatic and renal cortical hepcidin production and on the cytoprotective Nrf2 pathway were assessed. Finally, the ability of RBT-3 to confer protection against a clinically relevant AKI model, cisplatin nephrotoxicity and potential mechanisms of protection were tested.
MATERIALS AND METHODS
Clinical studies
Nine HVs [estimated glomerular filtration rate (eGFR) ≥70 mL/min/1.73 m2] and nine patients with Stages 3–4 CKD (15–59 mL/min/1.73 m2) were recruited for this investigation. The subjects that formed the basis for this study were also the foundation of a previous study that evaluated differential effects of FeS on heavy versus light chain ferritin expression [8]. The study received institutional review board approval from Advarra, Columbia, MD, and informed consent was obtained from each subject. The study conformed to the Helsinki Declaration. Exclusion criteria included pregnancy, any significant medical illness other than the presence of CKD, iron administration in the prior 30 days or a plasma ferritin concentration >500 ng/mL. Specific demographic data, screening eGFRs (Chronic Kidney Disease Epidemiology Collaboration equation), blood urea nitrogen (BUN), serum creatinine and blood pressure for the two groups are summarized in Table 1 and are also presented in greater detail in a previous study [8]. The trial was entered into ClinicialTrials.gov (NCT04072432).
Overview of healthy subjects and subjects with Stages 3–4 CKD (see Johnson et al. [8])
| Group | Gender | Age (years) | Weight (kg) | BP (systolic), mmHg | BP (diastolic), mmHg | eGFR (mL/min/1.73 m2) | BUN (mg/dL) | Plasma creatinine (mg/dL) |
|---|---|---|---|---|---|---|---|---|
| HV (n = 9) | 66% Male | 52 ± 6 | 92 ± 10 | 125 ± 6 | 80 ± 2 | >70 | 14 | 1.0 ± 0.2 |
| CKD (n = 9) | 22% Male | 69 ± 4 | 94 ± 9 | 130 ± 2 | 75 ± 7 | 38 ± 8 | 25 | 1.5 ± 0.4 |
| P-value | <0.001 | 0.71 | 0.43 | 0.18 | <0.001 | 0.013 | 0.005 |
Baseline characteristics of the HVs and subjects with Stages 3–4 CKD that formed the basis of this study. Values are presented as mean ± 95% confidence interval unless stated otherwise. P-values were derived by unpaired Student’s t-test.
The HV and CKD groups were each divided into three equal cohorts (n = 3 each), with each cohort receiving either 120, 240 or 360 mg of FeS (‘RBT-3’; Cascade Custom Chemistry, Portland, OR, USA). The RBT-3 dose (10, 20 or 30 mL of stock solution) was infused intravenously with 100 mL of saline over 2 h.
The subjects remained overnight at the study site (Riverside Clinical Research, Edgewater, FL, USA) to screen for potential adverse events. Timed heparinized plasma samples were collected at baseline (0) and at 4, 12, 24 and 72 h. ‘Spot’ urine samples were obtained at baseline and at 24 h post-RBT-3 infusion. The samples were assayed for hepcidin using a commercially available enzyme-linked immunosorbent assay (ELISA; R&D Systems, Minneapolis, MN, USA; kit DY8307). Urine hepcidin values were factored by urine creatinine concentrations. ELISA standard curve samples were provided by the manufacturer.
Mouse experiments
RBT-3-induced hepcidin expression in mice
Male CD-1 mice (35–40 g; Charles River Labs, Wilmington, MA, USA) were used for all animal studies, which were approved by the institution’s Institutional Animal Care and Use Committee. Mice were injected via the tail vein with either 1 mg of RBT-3 Fe or vehicle (n = 5 each). Eighteen hours later they were deeply anesthetized with pentobarbital (40–50 mg/kg), the abdominal cavities were opened, a blood sample was obtained from the vena cava and then the kidneys and livers were quickly resected, iced and total RNA and protein were extracted [14]. Renal cortical and hepatic hepcidin (HAMP1) messenger RNA (mRNA) levels were measured by competitive reverse transcription polymerase chain reaction (RT-PCR) using the primer pair shown in Table 2. The mRNA values were factored by simultaneously determined glyceraldehyde-3-phosphate dehydrogenase (GAPDH) product [14]. Plasma, hepatic and renal cortical hepcidin levels were determined with a mouse-specific ELISA (Intrinsic Life Sciences, San Diego, CA, USA).
Mouse primers for RT-PCR
| mRNA | Primer sequences | Product size |
|---|---|---|
| HAMP1 (Hepcidin) | 5′- CAGCAGAACAGAAGGCATGA -3′ 5′- AGATGCAGATGGGGAAGTTG -3′ | 218 bp |
| OCT2 | 5′- CCTGGATGCTGGACCTGTTT -3′ 5′- AGGAGCCCAACAGTAAAGGC -3′ | 313 bp |
| MATE1 | 5′- TGCTGTGCATAGAGTGGTGG -3′ 5′- GCCGAGCAATAAAAGCCAGG -3′ | 573 bp |
| GAPDH | 5′- CTGCCATTTGCAGTGGCAAAGTGG -3′ 5′- TTGTCATGGATGACCTTGGCCAGG -3′ | 437 bp |
RBT-3 effects on mouse Nrf2 expression
To assess whether RBT-3 activates the Nrf2 pathway, five mice were injected with 1 mg of RBT-3. Five saline vehicle–injected mice served as controls. Four hours post-RBT-3 or saline injection, the mice were anesthetized and hepatic and renal tissue samples were collected. Total mRNA was extracted from the kidneys and assayed for four Nrf2 activated genes: heme oxygenase-1 (HO-1), NAD(P)H quinone dehydrogenase 1 (NQO1), sulfiredoxin-1 (SRXN1) and glutamate-cysteine ligase catalytic subunit (GCLC) by RT-PCR, as previously described [15]. In addition, Nrf2 nuclear translocation was assessed by extracting nuclear protein and assaying for Nrf2 by ELISA [15].
Immunohistochemistry analysis of RBT-3 effects on proximal tubule HO-1 expression
We previously demonstrated that 1 mg of FeS induces an ∼10-fold increase in mouse renal cortical HO-1 protein levels within 4–24 h postinjection [14]. To confirm that these increases are expressed in proximal tubules, HO-1 protein expression was assessed in kidneys obtained 18 h after 1 mg RBT-3 or vehicle injection. Formalin-fixed paraffin-embedded tissues were sectioned at 4 μm onto positively charged slides and baked for 1 h at 60°C. The slides were then dewaxed and stained on a Leica BOND Rx stainer (Leica, Buffalo Grove, IL, USA) using Leica Bond reagents for dewaxing (Dewax Solution), antigen retrieval (Epitope Retrieval Solution 2) and rinsing after each step (Bond Wash Solution). Antigen retrieval was performed for 20 min at 100°C with all other steps at ambient temperature. Endogenous peroxidase was blocked with 3% hydrogen peroxide for 5 min followed by protein blocking with TCT buffer (0.05 M Tris, 0.15 M NaCl, 0.25% Casein, 0.1% Tween 20 and 0.05% ProClin300 pH 7.6) for 10 min. The primary antibody HO-1 (ab189491; Abcam, Cambridge, UK) was applied for 60 min followed by the Leica anti-rabbit horseradish peroxidase polymer for 10 min and application of the tertiary tyramide signal amplification reagent (OPAL 650 at 1:100; PerkinElmer, Waltham, MA, USA) for 10 min. Slides were removed from the stainer and stained with 4′,6-diamidino-2-phenylindole for 5 min, rinsed and coverslipped with Prolong Gold Antifade reagent (Invitrogen/Life Technologies, Grand Island, NY, USA).
Impact of RBT-3 preconditioning on cisplatin nephrotoxicity and renal cisplatin uptake
Mice were injected with 1 mg RBT-3 Fe or saline vehicle via the tail vein (n = 5 each). Eighteen hours later, all mice were injected with cisplatin (15 mg/kg intraperitoneally). Free food and water were provided throughout. Three days after the injections, the mice were deeply anesthetized with pentobarbital (50 mg/kg intraperitoneally), plasma samples were obtained from the vena cava for measuring the concentrations of BUN, creatinine, N-acetyl glucosamidase (NAG; BioAssay Systems, Hayward, CA, USA; DNAG-100) and neutrophil gelatinase-associated lipocalin (NGAL; R&D Systems; DY1857) (Note: insufficient urine was available for the NAG/NGAL assay). Renal cortical NGAL values were also determined by ELISA. In addition, renal cortical extracts were prepared in distilled water and cisplatin concentrations were determined (ProFoldin, Goettingen, Germany) according to the manufacturer’s instructions.
To assess whether RBT-3 alters the renal expression of proximal tubule cisplatin transporter expression, renal cortical OCT2 and MATE1 mRNA were measured at 4 and 18 h after 1 mg RBT-3 administration (n = 5 mice at each time point) by RT-PCR. The same number of RBT-3 vehicle-injected mice served as controls. The primer pairs used are presented in Table 2.
Exogenous hepcidin effects on mild in vivo cisplatin toxicity
To determine whether hepcidin can protect against a mild model of cisplatin toxicity in the absence of RBT-3 administration, four mice were injected intravenously with 100 µg of intact human hepcidin (ab31875, Abcam), followed 2 h later by a low dose of cisplatin (10 mg/kg). About 24 and 48 h later, the hepcidin injections were repeated (the dosage used was based on prior findings of hepcidin-mediated protection against sepsis AKI) [5]. At 72 h post-cisplatin injection, AKI severity was assessed by BUN/creatinine concentrations and compared with values observed in four cisplatin AKI mice that received 8 mg/kg cisplatin and vehicle instead of hepcidin injection.
Exogenous hepcidin effects on in vitro proximal tubule cell injury
Human proximal tubule (HK-2) cells were cultured in 48-well Costar plates with keratinocyte serum-free medium (K-SFM), as previously described [16]. The wells were divided into the following groups: K-SFM incubation alone (n = 8), addition of hepcidin (n = 8; 1 µg/mL; dosage equivalent of ∼10 times the peak human plasma hepcidin concentrations as per Figure 1) or 1 µg/mL bovine serum albumin (serving as a protein control for hepcidin addition; n = 8). Approximately 6 h later, half of the wells in each group were challenged with 15 µM cisplatin. The remaining half of the wells served as non-cisplatin-treated controls. Twenty four hours later, the extent of cell injury was determined by degrees of suppression of HK-2 cell MTT [(3-(4,5-dimethylthiazol-2-yl)-2,5-diphenyltetrazolium bromide] uptake compared with that observed in corresponding controls, as previously described [16].
![RBT-3 induces rapid and marked increases in plasma hepcidin levels. Within 4 h of RBT-3 injection, plasma hepcidin increases were observed with all test doses [360, 240 and 120 mg (left panel, middle panel and right panel, respectively)]. Values peaked at 24 h (∼15 times baseline with the 360- or 240-mg RBT-3 dose). The responses were comparable for the HV and CKD cohorts. The 95% confidence intervals (±) for the HV and CKD groups are given in the tables at the bottom of the figure. P-values were derived by analysis of variance for repeated measures (HVs and CKD data combined).](https://oup.silverchair-cdn.com/oup/backfile/Content_public/Journal/ndt/36/3/10.1093_ndt_gfaa348/1/m_gfaa348f1.jpeg?Expires=1747924183&Signature=NCiU3cnKX1fY-2E6hW7mghy77BYGIv6ZfJQgD6DFHDR9WmXT4oxEeaQTsH0zpr2LM6reEDNXWtv9EK3LWXrDZtqlOXvq1HsbiLcRvQ25VVNTUXQm1K79NSAnd2gmKlX4g278CBfa~ExHEBoJshICjcbB4wpKm-BxsYFQ1AC25XUElYu83F7ZofZse-B63UypScAnjZZHL3naYJMzLztJ2G2JBU6VrG4pYnweESYY2R-BDAx0OICdb52yUDXuM04rueD39BSyAlvltXv-s1CW-iJppNxKr9sGCYNfeF8kQ-VJ0fD2RGELjQOSxAvU2-fRSgcDJ4rwbcrMrNda1EQlkA__&Key-Pair-Id=APKAIE5G5CRDK6RD3PGA)
RBT-3 induces rapid and marked increases in plasma hepcidin levels. Within 4 h of RBT-3 injection, plasma hepcidin increases were observed with all test doses [360, 240 and 120 mg (left panel, middle panel and right panel, respectively)]. Values peaked at 24 h (∼15 times baseline with the 360- or 240-mg RBT-3 dose). The responses were comparable for the HV and CKD cohorts. The 95% confidence intervals (±) for the HV and CKD groups are given in the tables at the bottom of the figure. P-values were derived by analysis of variance for repeated measures (HVs and CKD data combined).
The above experiment was repeated, with the following two exceptions: the hepcidin or albumin concentrations used were 5 µg/mL instead of 1 µg/mL and MTT uptake was assessed at 48 h, not 24 h, post-cisplatin addition.
Calculations and statistics
Each hepcidin sample was assayed in duplicate with the average of the two values being used for data presentation and analysis. The human hepcidin data are presented as mean ± SD. Baseline plasma hepcidin values for the HV and CKD groups were compared by unpaired Student’s t-test. Comparisons of hepcidin levels over time were analyzed by analysis of variance for repeated measures with 95% confidence intervals. Baseline demographic data were compared by unpaired Student’s t-test. Mouse data are given as mean ± standard error of the mean (SEM). Significance was judged by a P-value <0.05.
RESULTS
Baseline subject information
Selected demographics for the study population have previously been presented in detail [8]. Table 1 provides a synopsis. The CKD subjects were significantly older than the HVs and there were fewer males compared with the HV group. The mean eGFR for the CKD group was 38 ± 8 mL/min/1.73 m2 (approximately half that of the HV group, which was >70 mL/min/1.73 m2). The lower eGFRs for the CKD subjects were manifested by elevated baseline BUN and plasma creatinine concentrations compared with those seen in the HVs. All subjects completed the infusion and a 28-day follow-up protocol without any apparent adverse renal or extrarenal effects.
Baseline and post-RBT-3 plasma hepcidin concentrations in HV and CKD subjects
Consistent with the literature [17–19], CKD subjects had elevated baseline plasma hepcidin levels compared with HVs (26 ± 25 versus 4 ± 5 ng/mL; P = 0.001). This presumably reflected a CKD-associated pro-inflammatory state and possibly decreased renal hepcidin clearance due to CKD-associated GFR reductions.
All HV and CKD subjects manifested dramatic plasma hepcidin increases in response to RBT-3 injection (Figure 1). The increases were observed as early as 4 h post-RBT-3 injection and reached peak values by 24 h. With the 240- and 360-mg RBT-3 dosages, the 24-h plasma hepcidin levels were ∼15 times higher compared with their baseline values. After 24 h, rapid plasma hepcidin declines were observed. However, at the final assessed time point (72 h), ∼3-fold plasma hepcidin increases over baseline values were still observed (all groups, P < 0.001).
Despite the fact that CKD was associated with increased baseline hepcidin levels, these increases did not impact the degree of RBT-3-induced hepcidin responses. For example, the 24-h increases over basal values were nearly identical for the HV and CKD groups whether the subjects received the 120-, 240- or 360-mg RBT-3 dosage (Figure 2).
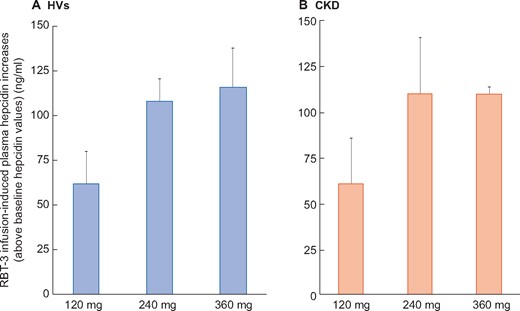
Increases in plasma hepcidin levels over baseline values. Because baseline plasma hepcidin levels were elevated in the CKD cohort compared with HVs, the RBT-3-induced increases over these baseline values were calculated (24-h peak values − baseline values). This allowed comparison between the CKD and HV hepcidin responses. As is apparent, the HV and CKD groups manifested highly comparable hepcidin increases with each iron dose. Values are mean ± 95% confidence interval. The 240- and 360-mg RBT-3 dose induced comparable hepcidin increases, both of which were greater than those observed in the 120-mg dose groups.
Human urinary hepcidin concentrations in response to RBT-3 injection
At baseline, urinary hepcidin concentrations did not differ between the HV and CKD groups (47 ± 36 versus 51 ± 72 ng/mg urine creatinine, respectively). By 24 h post-RBT-3 injection, both groups showed ∼4 times urine hepcidin increases over baseline values (HVs 219 ± 104 ng/mg creatinine, P = 0.04 versus baseline; CKD 176 ± 93 ng/mg creatinine, P < 0.015 versus baseline), consistent with filtration of increased plasma hepcidin levels.
Mouse experiments
Mouse HAMP1 gene expression; plasma, renal and hepatic hepcidin responses to RBT-3
Baseline mouse hepatic HAMP1 mRNA expression (Table 3) was at least 25 times greater than that observed in the renal cortex, consistent with the liver being the dominant site of hepcidin production [1]. While both liver and kidney each responded to RBT-3 injection with HAMP1 mRNA increases, the percent increase in HAMP1 mRNA was dramatically greater in the kidney versus the liver by a factor of ∼10 (Table 3). However, baseline and post-RBT-3 hepcidin protein levels were comparable for the two organs (∼5 times elevations over baseline values; see Table 3). These increases corresponded with an ∼3-fold RBT-3-induced increase in plasma hepcidin concentrations (Table 3).
Hepcidin expression in mouse liver, kidney and plasma under control conditions and 18 h following RBT-3 administration
| Group | Hepatic HAMP1 mRNA | Kidney HAMP1 mRNA | Plasma hepcidin (ng/mL) | Hepatic hepcidin (ng/mg protein) | Kidney hepcidin (ng/mg protein) |
|---|---|---|---|---|---|
| Control (n = 5) | 27 ± 4 | 0.9 ± 0.2 | 359 ± 53 | 2.0 ± 0.3 | 1.4 ± 0.1 |
| 24 h post-RBT-3 (n = 5) | 46 ± 6 | 578 ± 198 | 1057 ± 178 | 6.2 ± 0.4 | 6.6 ± 1.5 |
| P-value | 0.028 | 0.01 | <0.001 | <0.001 | <0.005 |
The HAMP1 mRNAs are factored by GAPDH. The values are mean ± SEM. P-values were derived by unpaired Student’s t-test.
Mouse renal cortical Nrf2 gene activation in response to RBT-3
Each of the four tested Nrf2 responsive mRNAs was elevated at 4 h post-RBT-3 injection (Figure 3). These increases corresponded with increased Nrf2 nuclear protein concentrations in the RBT-3-treated group.
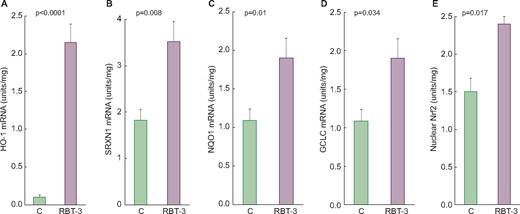
Renal Nrf2 pathway is activated by RBT-3 injection in CD-1 mice. At 4 h following RBT-3 injection, significant increases in each of the four tested Nrf2 responsive gene mRNAs were observed in the renal cortex (compared with simultaneously studied control mice). Further evidence of Nrf2 pathway activation was the finding of increased nuclear Nrf2 protein binding in nuclear protein extracts. (A) HO-1, (B) SRXN1, (C) NQO1, (D) GCLC and (E) nuclear Nrf2. Values are mean ± SEM.
HO-1 immunofluorescence
Focal proximal tubule HO-1 staining was observed in cortical proximal tubules in control kidney tissue (Figure 4, left panel). The extent and intensity of HO-1 cortical proximal tubule HO-1 staining were greatly increased at 18 h following RBT-3 injection (Figure 4, middle panel). No apparent increase in glomerular staining or tubule cell nuclear HO-1 staining was observed in response to RBT-3 injection. There was minimal HO-1 staining of medullary and papillary cells following RBT-3 injection (Figure 4, right panel), which did not differ versus non-RBT-3-treated tissues. As noted above, the HO-1 increases in the renal cortex, as observed by immunohistochemistry, correspond with an ∼10-fold FeS-induced increase in renal cortical HO-1 protein concentrations [14]. In sum, these findings imply that the RBT-3-induced increases in HO-1 protein levels reflect increases within proximal tubules.
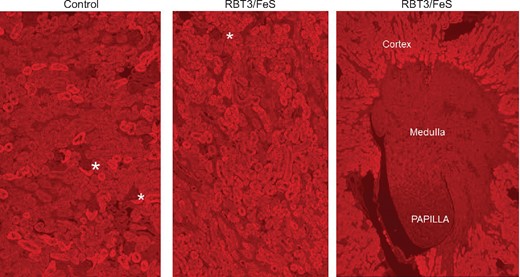
RBT-3 induces prominent increases in HO-1 expression in mouse proximal tubules, as assessed by immunohistochemistry. The control kidney, shown in the left-hand panel, demonstrates variable cytoplasmic staining of proximal tubule segments within the renal cortex. In contrast, the kidney harvested 18 h post-RBT-3 injection (middle panel) showed a prominent and near-confluent proximal tubule HO-1 increase. In contrast, no obvious increase in HO-1 staining was apparent in the glomeruli (depicted by the asterisks) or medullary papillary regions (right-hand panel). Thus these findings confirmed that the HO-1 mRNA changes depicted in Figure 5 were reflected by increased renal HO-1 protein levels and that these increases reflected HO-1 increases predominantly within cortical proximal tubules.
RBT-3 effects on cisplatin nephrotoxicity
By 3 days post-cisplatin injection, severe renal injury was apparent in the control mice, as denoted by marked BUN and plasma creatinine elevations (Table 4). RBT-3 preconditioning caused an ∼50% reduction in cisplatin-induced injury, as assessed by BUN and creatinine levels.
Cisplatin-induced AKI: impact of RBT-3 preconditioning 3 days after cisplatin injection
| Group | BUN (mg/dL) | Creatinine (mg/dL) | Plasma NAG (activity units/L) | Renal NGAL (ng/mg protein) | Plasma NGAL (ng/mg protein) | Tissue cisplatin (µg/g tissue wet weight) |
|---|---|---|---|---|---|---|
| Cisplatin | 105 ± 11 | 0.7 ± 0.1 | 19.5 ± 0.8 | 86 ± 18 | 1667 ± 360 | 227 ± 35 |
| Cisplatin/RBT-3 | 48 ± 5 | 0.43 ± 0.03 | 9.8 ± 1.2 | 28 ± 5 | 543 ± 160 | 142 ± 9 |
| P-value | <0.001 | <0.001 | 0.0025 | <0.04 | <0.05 | <0.05 |
| Normal values | 24 ± 1 | 0.3 ± 0.03 | 8.9 ± 2.0 | 7 ± 0.2 | 48 ± 6 | 0 |
The values are presented as mean ± SEM. Statistical comparisons were made by unpaired Student’s t-test. Plasma NAG and NGAL each significantly correlated with the BUN and plasma creatinine concentrations (see text).
Cisplatin caused marked increases in plasma NAG and NGAL concentrations (Table 4). RBT-3-mediated renal protection was also demonstrated by marked plasma NAG and NGAL reductions from those cisplatin-induced elevated values (Table 4). The 3-day plasma NGAL levels showed significant correlations with both the 3-day BUN and plasma creatinine concentrations (r = 0.76 and 0.81; P < 0.01 and < 0.005, respectively). Similar correlations between plasma NAG versus BUN (r = 0.74) and plasma creatinine concentrations (r = 0.81) were observed. Renal cortical NGAL levels in cisplatin-treated mice were elevated by ∼8-fold versus normal kidney concentrations (Table 4). RBT-3 pretreatment reduced these elevations by approximately two-thirds (Table 4).
RBT-3-mediated protection was associated with and almost certainly due in part to a 40% reduction in renal cortical cisplatin concentrations (Table 4). This occurred without any RBT-3 effect on either OCT2 or MATE1 mRNA levels (OCT2 baseline, 4 h, 18 h: 1.23 ± 0.05, 1.12 ± 0.08, 1.22 ± 0.04, respectively; MATE 1 baseline, 4 h, 18 h: 0.50 ± 0.02, 0.47 ± 0.02, 0.5 ± 0.02, respectively).
Exogenous hepcidin effects on mild in vivo cisplatin toxicity
Exogenous intravenous hepcidin injections (×3) over the course of cisplatin toxicity caused a significant reduction in mild (10 mg/kg) cisplatin nephrotoxicity [BUN 42 ± 5 versus 27 ± 1 mg/dL, P < 0.03; creatinine 0.42 ± 0.01 versus 0.3 ± 0, P < 0.01 (hepcidin versus hepcidin vehicle, respectively)]. In data not shown, hepcidin treatment was unable to significantly attenuate the severe cisplatin toxicity (15 µg/kg) model.
Exogenous hepcidin effects on in vitro proximal tubule cell injury
After 1-day incubations, cisplatin induced 19 ± 2%, 20 ± 1% and 20 ± 1% MTT reductions under control, 1 µg/mL hepcidin and 1 µg/mL albumin incubation conditions, respectively (Figure 5, left panel). In the absence of cisplatin, neither hepcidin nor albumin had any effect on MTT uptake.
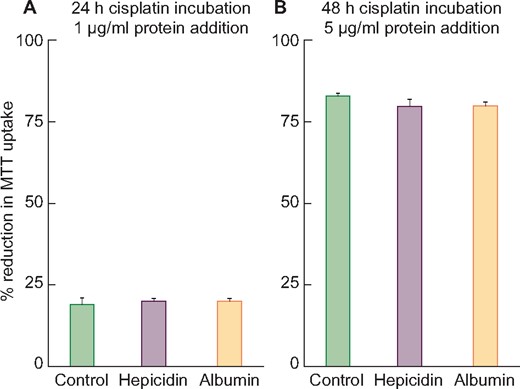
Treatment of HK-2 cells with 15 μM cisplatin with or without human hepcidin addition. (A) After a 24-h incubation, cisplatin induced ∼20% cell death (reductions in MTT uptake) irrespective of the presence or absence of 1 μg/mL hepcidin or albumin (albumin used as a nonspecific protein control). (B) After a 48-h incubation, cisplatin caused ∼80% MTT reductions irrespective of the addition of 5 μg/mL of hepcidin or albumin. Thus no evidence of hepcidin-mediated in vitro protection was observed with either mild or severe cisplatin toxicity.
Much more severe injury was observed after 48-h 5 ug/mL cisplatin incubations (83 ± 1%, 80 ± 1%, 83 ± 1% MTT uptake reductions under control, 5 µg/mL hepcidin or 5 µg/mL albumin, respectively) (Figure 5, right panel). Thus no evidence for hepcidin-mediated in vitro protection was observed.
DISCUSSION
Hepcidin is a key regulator of systemic and intracellular iron homeostasis and has recently been documented to possess renal tubular cytoprotective effects [3–7]. As previously discussed, following recombinant hepcidin administration, renal filtration, proximal tubular uptake and subsequent degradation of ferroportin result. Since ferroportin is the dominant cellular exporter of iron, its degradation is believed to increase proximal tubular iron content, which then stimulates ferritin production [6]. Given that ferritin is a potent antioxidant [8, 9], it may be a key arbiter of hepcidin’s cytoprotective effects.
In two previously reported mouse studies, our laboratory demonstrated that within 18–24 h of FeS administration, renal protection against diverse forms of AKI (glycerol, maleate or ischemia–reperfusion) results [14, 17]. We suggested that this was due in part to FeS-driven increases in proximal tubule ferritin content [8]. However, FeS gains minimal proximal tubule luminal access [17]. This suggests an alternative possibility for FeS-driven ferritin increases; that FeS might stimulate hepatic hepcidin synthesis that then evokes renal ferritin loading by the above-noted pathway. However, it remained unclear as to whether FeS can evoke rapid and sustained hepcidin production (i.e. within a 24-h period) such as would be required for it to contribute to our previously noted FeS-induced preconditioning state [14, 17].
To address this issue, we assessed the impact of a new intravenous FeS formulation, RBT-3, on hepcidin production in healthy human subjects and patients with advanced CKD. To gain additional insights, RBT-3 effects on hepcidin expression in mice were assessed. As shown in Figure 1, in both healthy humans and CKD subjects, rapid, dose-dependent plasma hepcidin increases were observed. This response peaked at 24 h, with both subject groups manifesting ∼15-fold plasma hepcidin increases in response to 240- or 360-mg RBT-3 injections. At baseline, plasma hepcidin levels were elevated in CKD subjects compared with HVs, likely reflecting CKD’s pro-inflammatory state [18–20]. This raised the theoretical possibility that in CKD patients, hepcidin production might already be maximized and thus further RBT-3-mediated hepcidin increases might not occur. However, this was clearly not the case given that absolute hepcidin increases over baseline values were virtually identical in the HV and CKD study groups (Figure 2). Of interest, the 24-h peak values fell by ∼50% within 48–72 h post-RBT-3 injection. This presumably reflected declining hepcidin production in concert with rapid renal uptake and urinary excretion. Indeed, the latter was evidenced by ∼4-fold increases in urinary hepcidin concentrations in both the CKD and HV groups at 24 h post-RBT-3 injection.
Hepatic hepcidin production in response to iron loading is thought to result exclusively from increased gene transcription [1], initiated by holotransferrin binding to its hepatic receptors (Tfr1 and Trf2). Subsequent bone morphogenetic protein–SMAD pathway activation then upregulates HAMP1 gene transcription. To confirm that this pathway was activated by RBT-3 injection, we measured HAMP1 mRNA in both mouse liver and kidney at 24 h post-RBT-3 injection. Surprisingly, whereas marked HAMP1 mRNA increases were observed in both organs, a 10-fold greater RBT-3 response was observed in the kidney. To our knowledge, preferential renal versus hepatic HAMP1 induction in response to Fe has not previously been reported. These findings imply that RBT-3 can trigger renal hepcidin loading by both indirect (hepatic production) and direct (renal derived) actions.
To expand our understanding of the scope of FeS’s protective effects, we have now tested whether RBT-3 can be expressed against experimental cisplatin-induced acute renal failure. This model was chosen for study in light of the following four considerations: First, unlike our previously tested AKI models (ischemia, maleate and glycerol-induced rhabdomyolysis), which are fully expressed within ∼24 h, cisplatin nephrotoxicity evolves slowly, requiring at least 3 days for the full expression of renal failure. Thus it was unclear as to whether FeS/RBT-3-mediated preconditioning effects could be expressed over this prolonged time frame. Second, cisplatin adducts induce early and prominent DNA damage (e.g. DNA cross-linking), culminating in apoptotic or necrotic cell death [21]. Given this unique injury-initiating event, it was unclear whether FeS/RBT-3 preconditioning could still confer a protective influence. Third, cisplatin remains a widely used chemotherapeutic agent, with a 25–30% clinical AKI rate [22]. Thus, identifying a protective mechanism to mitigate cisplatin toxicity could fill a currently unmet medical need. Fourth, cisplatin administration is a scheduled clinical event. Hence RBT-3 could be administered ∼18–24 h prior to cisplatin infusion, thereby allowing the necessary time for the full development of the cytoresistant state. Indeed, when RBT-3 was administered to mice 18 h prior to cisplatin injection, marked renal protection was observed, as evidenced by steep reductions in BUN, plasma creatinine and plasma/renal cortical NGAL concentrations (Table 4). Thus these findings add further support to the previously advanced concept that FeS preconditioning [8, 14, 17] can exert broad-based and potentially clinically applicable renal protective effects.
A number of feasible, interactive mechanisms likely account for the observed RBT-3 protective action. First, we have clearly demonstrated that RBT-3 causes renal hepcidin loading, presumably allowing it to exert its well-known and broad-based cytoprotective effect(s) [2–7]. Second, we have previously demonstrated that RBT-3 triggers marked increases in heavy chain ferritin in renal tubules [8]. Of note, it is ferritin’s heavy chain that accounts for ferritin’s antioxidant effects [8, 9]. Third, we have now demonstrated that RBT-3 upregulates the broad-based Nrf2 cytoprotective pathway, as evidenced by increased nuclear Nrf2 protein translocation, and activation of each of four Nrf2-sensitive antioxidant genes (HO-1, NQ01, GCLC and SRXN1). That proximal tubules are involved in this Nrf2 upregulation was confirmed by marked and localized HO-1 protein increases in this nephron segment. Given that Nrf2 is the so-called master regulator of antioxidant defenses, it stands to reason that this pathway could confer protection against cisplatin-based free radical attack. Indeed, there are recent suggestions that the Nrf2 and hepcidin pathways have beneficial interactive effects [10–13].
A fourth, and unexpected, protective action evoked by RBT-3 preconditioning was a dramatic suppression in renal cisplatin uptake or accumulation. Because cisplatin nephrotoxicity is highly dependent on proximal tubule cell uptake, the observed 40% reduction in renal cortical cisplatin levels must have played a dominant role in RBT-3’s protective effect. Proximal tubule cell cisplatin uptake is mediated via organic cation transporters (e.g. OCT2 and MATE1), located in the basolateral membrane [21]. While OCT2 transport is likely the prime determinant of proximal tubule cisplatin uptake [21–24], it has recently been suggested that MATE1 can also evoke luminal cisplatin efflux [24]. How RBT-3 impacts the function of these cellular uptake and efflux pathways remains unknown. That RBT-3 did not alter either OCT2 or MATE1 mRNA expression suggests that nontranscriptional changes in these transport pathways may have been involved. The delineation of the responsible mechanisms will clearly require further investigation.
An additional unresolved issue was whether the RBT-3-induced hepcidin increases specifically contributed to RBT-3’s overall cytoprotective effects. To address this issue, exogenous hepcidin was administered to mice that were challenged with a mild cisplatin insult. That renal protection was observed indicated that hepcidin can indeed mitigate a mild form of cisplatin toxicity in the absence of RBT-3 preconditioning. This confirms previous reports of hepcidin’s cytoprotective effects against other forms of AKI, as previously discussed. Conversely, we were unable to demonstrate that different doses of exogenous hepcidin lessened cisplatin toxicity in HK-2 cells. This was possible because cultured proximal tubule cells do not have a well-developed endocytic protein transport pathway, such as exists in in vivo proximal tubules. Furthermore, cultured versus in vivo proximal tubule cells utilize anaerobic versus aerobic energy production pathways, respectively [16]. These factors could well explain a failure of in vitro versus in vivo hepcidin-induced protection.
In conclusion, we document that RBT-3 can markedly (15 times) and rapidly (≤24 h) induce hepatic and renal hepcidin generation, leading to renal hepcidin loading. Thus RBT-3 may represent a simple pharmacologic approach for increasing renal hepcidin levels, thereby obviating the need for recombinant humanized hepcidin administration. In addition to stimulating cytoprotective hepcidin production, RBT-3 can evoke additional renal protective actions. One of the most promising is renal Nrf2 pathway activation, as documented for the first time in this study. We also demonstrate that RBT-3 preconditioning can reduce tubule cisplatin uptake. As previously demonstrated [8], RBT-3 administration also causes marked increases in antioxidant/cytoprotective heavy chain ferritin production in renal tubules [8]. Hence it seems likely that RBT-3-induced preconditioning is mediated via multiple overlapping cellular pathways. Finally, RBT-3 appears to be clinically well tolerated by both HVs and CKD patients [8]. These further point to its potential suitability as a renal preconditioning agent.
ACKNOWLEDGEMENTS
The authors thank Tracy Goodpasture, Experimental Histopathology Laboratory, Fred Hutchinson Cancer Research Institute, for preparing the immunohistochemistry slides. We thank Renibus Therapeutics, Dallas, TX, USA, for providing us with the clinical samples that made this study possible.
FUNDING
This work was sponsored by funds from Renibus Therapeutics, Southlake, TX, USA, and discretionary research funds from the Fred Hutchinson Cancer Research Center, Seattle, WA, USA.
CONFLICT OF INTEREST STATEMENT
R.A.Z. is a consultant to Renibus Therapeutics. This work has not been published in any form and is not under review by another journal.
DATA AVAILABILITY STATEMENT
All data will be made available upon request to R.A.Z.


Comments