


Abstract
Circulating desphospho-uncarboxylated matrix γ-carboxyglutamate (Gla) protein (dp-ucMGP), a marker of vitamin K status, is associated with renal function and may serve as a potentially modifiable risk factor for incident chronic kidney disease (CKD). We aimed to assess the association between circulating dp-ucMGP and incident CKD.
We included 3969 participants with a mean age of 52.3 ± 11.6 years, of whom 48.0% were male, enrolled in the general population–based Prevention of REnal and Vascular ENd-stage Disease study. Study outcomes were incident CKD, defined as either development of an estimated glomerular filtration rate (eGFR) <60 mL/min/1.73 m2 or microalbuminuria. Associations of dp-ucMGP with these outcomes were quantified using Cox proportional hazards models and were adjusted for potential confounders.
Median plasma dp-ucMGP was 363 [interquartile range (IQR) 219–532] pmol/L and mean serum creatinine- and serum cystatin C-based eGFR (eGFRSCr-SCys) was 95.4 ± 21.8 mL/min/1.73 m2. During 7.1 years of follow-up, 205 (5.4%) participants developed incident CKD and 303 (8.4%) developed microalbuminuria. For every doubling of plasma dp-ucMGP, hazard ratios for the development of incident CKD and microalbuminuria were 1.85 [95% confidence interval (CI) 1.59–2.16; P < 0.001] and 1.19 (95% CI 1.07–1.32; P = 0.001), respectively. These associations lost significance after adjustment for baseline eGFRSCr-SCys [0.99 (95% CI 0.88–1.12; P = 0.86)] and baseline age [1.03 (95% CI 0.94–1.14; P = 0.50)], respectively.
The associations of plasma dp-ucMGP with incident CKD and microalbuminuria were driven by the respective baseline effects of renal function and age.
What is already known about this subject?
Circulating desphospho-uncarboxylated matrix Gla protein (dp-ucMGP), a marker of poor vitamin K status, was recently shown to predict incident CKD [defined as estimated glomerular filtration rate (eGFR) <60 mL/min/1.73 m2] and microalbuminuria. However, to assess a biomarker’s performance and utility, it is recommended that novel markers be externally validated in an independent population.
What this study adds?
This article presents the independent replication of the associations of dp-ucMGP with incident CKD and microalbuminuria in 3969 community-dwelling individuals. The associations lost statistical significance after respective adjustment for baseline eGFR and age.
What impact this may have on practice or policy?
Further evaluation of the prognostic value of dp-ucMGP in CKD is warranted, as it could imply a role for low vitamin K status in the development of CKD and hence pave the way for potential preventive treatment to emerge.
INTRODUCTION
Chronic kidney disease (CKD) is a progressive, irreversible disease characterized by a chronic reduction in kidney function and structural kidney damage [1]. Around 1.2 million deaths were attributable to CKD in 2016, ranking 12th in the list of leading causes of death, and this number is expected to rise to 2.8 million deaths by 2060 [2]. Such a burden warrants the study of potentially modifiable risk factors that could facilitate the detection of renal deterioration in early stages of kidney injury.
Recently Wei et al. [3] reported on circulating desphospho-uncarboxylated matrix γ-carboxyglutamate (Gla) protein (dp-ucMGP), a marker of poor vitamin K status, as a predictor of incident CKD. Wei et al. found that a high plasma dp-ucMGP level, representing a vitamin K deficiency, was associated with an increased risk of progression to an estimated glomerular filtration rate (eGFR) <60 mL/min/1.73 m2 and development of microalbuminuria. These findings are of particular importance since they not only indicate that dp-ucMGP may be a biomarker predicting incident CKD, but also suggest a potential role for low vitamin K status in the development of renal insufficiency, thus paving the way for potential preventive treatment regimens to emerge.
Since the performance of a marker is generally overestimated in the population from which it was derived, external validation of such markers in an independent population is recommended and crucial to broadly appraise the performance and potential utility of such markers in distinct populations and settings [4–8]. We therefore aimed to independently replicate the results of the study by Wei et al. [3] in the Prevention of REnal and Vascular ENd-stage Disease (PREVEND) study, which was specifically designed to study changes of renal function in the general population. This allowed us to investigate the serum cystatin C–based equation (eGFRSCys) and the currently recommended combined equation of serum creatinine and serum cystatin C (eGFRSCr-SCys) for estimating GFR in addition to the serum creatinine–based equation (eGFRSCr) used by Wei et al. [9].
MATERIALS AND METHODS
Study design and participants
The PREVEND study prospectively investigates risk factors for and prevalence and consequences of microalbuminuria in otherwise healthy adults in the city of Groningen, The Netherlands. The objectives and design have been described in detail elsewhere [10]. Briefly, during 1997 and 1998, all 85 421 inhabitants of the city of Groningen, ages 28–75 years, were invited to participate and were sent a one-page questionnaire regarding demographics, cardiovascular morbidity, medication use and pregnancy along with a vial to collect first morning void urine. A total of 40 856 (47.8%) responded, in whom the urinary albumin concentration (UAC) was determined. Given the well-established link between cardiovascular or renal disease and microalbuminuria in individuals with insulin-dependent diabetes mellitus, and because pregnant females may present with temporary microalbuminuria, these individuals were excluded from the PREVEND study. After further exclusion of individuals unable or unwilling to participate, a total of 6000 individuals with a UAC ≥10 mg/L and a randomly chosen control group of 2592 individuals with a UAC <10 mg/L completed the screening protocol and constitute the PREVEND cohort (n = 8592). A second screening round took place from 2001 to 2003, encompassing 6894 participants, and was considered the ‘baseline’ for this study. We included 3969 participants with available data on plasma dp-ucMGP and incidence of CKD (Figure 1). The PREVEND study was approved by the local medical ethics committee and was undertaken in accordance with the Declaration of Helsinki. All participants provided written informed consent.
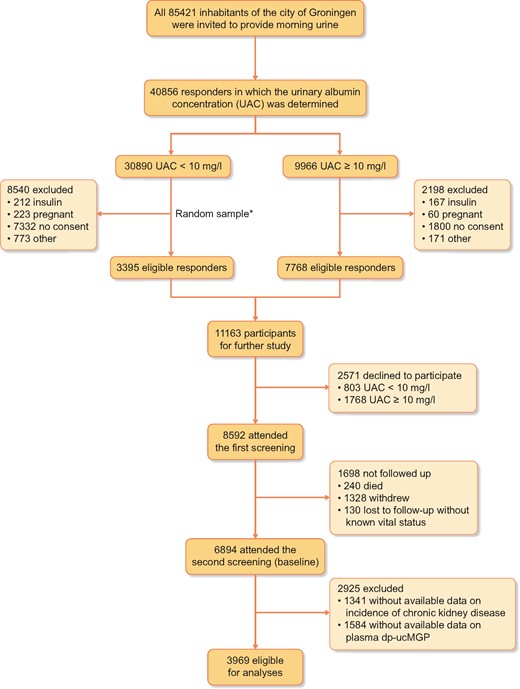
Flow of the participants through the study. *The size of the random sample was arbitrarily set at 3395 (out of the 22 350 eligible participants) to obtain a total cohort size of ∼10 000, taking into account a 15% non-participation rate.
Laboratory measurements
Each screening comprised two outpatient clinic visits separated by 3 weeks [10]. Self-administered questionnaires concerning demographics, cardiovascular and renal disease history, smoking habits and medication use were provided by all participants prior to the first visit. Information on medication use was combined with information from IADB.nl, a database containing information of prescribed medication in public pharmacies in The Netherlands since 1994 (http://www.iadb.nl/).
Participants had to collect two consecutive 24-h urine specimens after thorough oral and written instruction. During urine collection, participants were asked to refrain from heavy exercise and were instructed to postpone urine collection in case of urinary tract infection, menstruation or fever. Collected urine was subsequently stored at 4°C for a maximum of 4 days before the second visit. Specimens of the urine collections were stockpiled at −20°C until analysis. Baseline ethylenediaminetetraacetic acid plasma samples were drawn between 8:00 and 10:00 a.m. from all participants and aliquots of these samples were immediately stockpiled at −80°C until analysis. Functional vitamin K status was assessed by measuring plasma dp-ucMGP with a dual-antibody enzyme-linked immunoassay (IDS-iSYS InaKtif MGP assay), wherein the capture antibody was directed against the non-phosphorylated epitope (amino acids 3–15) and the detection antibody against the uncarboxylated epitope (amino acids 35–49) of MGP. The lower limit of detection was 21 pmol/L and the intra- and interassay coefficients of variation (CVs) were 4.5% and 7.9% at 591 pmol/L, 6.2% and 8.2% at 870 pmol/L and 0.8% and 3.5% at 2558 pmol/L, respectively. Plasma dp-ucMGP was measured in a single run by the Laboratory of Coagulation Profile, Department of Biochemistry, Maastricht, The Netherlands. Serum creatinine was measured with an enzymatic method on a modular analyser using reagents and calibrators from Roche Diagnostics (Mannheim, Germany). Serum cystatin C was measured with the Gentian Cystatin C Immunoassay (Gentian, Moss, Norway) on a Roche modular analyser and was calibrated directly with the standard supplied by the manufacturer. UAC was measured by nephelometry (Dade Behring, Marburg, Germany). This concentration was multiplied by urine volume to obtain a value in milligrams per 24 h, hereafter referred to as urinary albumin excretion (UAE).
Outcomes
Coprimary study outcomes were incident CKD and microalbuminuria, defined as reaching an eGFRSCr-SCys <60 mL/min/1.73 m2 or a UAE >30 mg/24 h, respectively. Secondarily, we also performed analyses with incident CKD defined as reaching an eGFRSCr <60 mL/min/1.73 m2 or an eGFRSCys <60 mL/min/1.73 m2. Survival time for incident CKD was estimated using midpoint imputation and censoring was defined as the exact date of loss to follow-up or the end of the follow-up period (1 January 2011), whichever came first. If a person had moved to an unknown destination, the date on which the person was deregistered from the municipal registry was used as the census date. The GFR was estimated with the three distinct equations of the combined creatinine–cystatin C–based Chronic Kidney Disease Epidemiology Collaboration (CKD-EPI) equation from 2012 [11], the creatinine-based CKD-EPI equation from 2009 [12] and the cystatin C–based CKD-EPI equation from 2012 [11], the results of which are referred to in this study as eGFRSCr-SCys, eGFRSCr and eGFRSCys, respectively.
Statistical analyses
Statistical analyses were performed with R version 3.6.1 (R Foundation for Statistical Computing, Vienna, Austria). Results were expressed as mean ± standard deviation (SD), median [interquartile range (IQR)] or number (percentage) for normally distributed, skewed and categorical data, respectively. A two-sided P-value <0.05 was considered to indicate statistical significance.
Baseline characteristics are presented for the total population and according to sex-stratified quartiles of dp-ucMGP. Linear trends across the quartiles were determined using analysis of variance for normally distributed data, the Jonckheere–Terpstra test for skewed data and the Mantel–Haenszel test of trend for categorical data. The assumption of homogeneity of variance was validated by plotting the residuals per quartile against the fitted values. Deviations from this assumption were resolved by modelling the variance with generalized least squares. To account for potential bias that could result from excluding participants with missing values [13], multiple imputation using fully conditional specification was performed to obtain 10 imputed data sets with 10 iterations in the Gibbs sampler per data set [14], wherein Rubin’s rules were applied to acquire pooled estimates of the regression coefficients and their standard errors across the imputed data sets [15]. All covariates had <5% missing values except for C-reactive protein and use of vitamin K antagonists (Supplementary data, Table S1).
Multivariable linear regression was used to assess the association of eGFRSCr-SCys with dp-ucMGP. A log2 transformation was applied to the dp-ucMGP distribution to approximate a Gaussian error distribution. Homoscedasticity was ascertained by plotting the residuals against the fitted values and every independent variable. The assumption of normally distributed error terms was validated by inspection of Q-Q plots of the residuals. Analyses were adjusted for the baseline values of all potential confounding variables (i.e. age, sex, current smoking, BMI, systolic blood pressure, use of antihypertensive and lipid-lowering drugs, prevalence of type 2 diabetes at baseline, prevalent cardiovascular disease and UAE). We used Cox models to compute hazard ratios (HRs) of the association of plasma dp-ucMGP with incident CKD (<60 mL/min/1.73 m2) and incident microalbuminuria. Prior to entering the model, the correct covariate functional form of dp-ucMGP was graphically determined by fitting a smoothing spline to the martingale residuals, obtained from a single Cox model fitting all covariates but dp-ucMGP along with a multivariable regression line with dp-ucMGP as the dependent variable and all other covariates as independent variables [16]. Considerable deviation from the linearity of each of the smoothers was observed, for which the dp-ucMGP distribution was log2 transformed. Point estimates are hence shown per doubling of plasma dp-ucMGP. The proportional hazards assumption was verified with plots of the scaled Schoenfeld residuals. Participants with baseline eGFR <60 mL/min/1.73 m2 and microalbuminuria were excluded from analyses for incident eGFR <60 mL/min/1.73 m2 and microalbuminuria, respectively. Analyses were adjusted for the baseline values of potential confounding variables mentioned above (including eGFR). Potential modification of the effect of dp-ucMGP on the risk of an event by sex was explored by including product terms in the model. Associations in the total population are shown along with sex-specific prospective associations. Regarding the association of plasma dp-ucMGP with incident CKD, only the results of the endpoint of incident eGFRSCr-SCys <60 mL/min/1.73 m2 are reported in the main text. Subsequent sensitivity analyses were conducted to evaluate the robustness of the findings, wherein any potential bias caused by the use of vitamin K antagonists was accounted for by excluding participants with known use of vitamin K antagonists.
RESULTS
Baseline characteristics
The mean age of the 3969 participants was 52.3 ± 11.6 years, of whom 1907 (48.0%) were male. Baseline plasma dp-ucMGP was 363 (IQR 219–532) pmol/L. Plasma dp-ucMGP was substantially higher in males than females (381 versus 341 pmol/L, respectively; P < 0.001). Therefore baseline characteristics of the study participants are shown according to sex-stratified quartiles of dp-ucMGP (Table 1). Participants with higher plasma dp-ucMGP were more likely to be older; Caucasian; to have prevalent type 2 diabetes and cardiovascular disease; to have a higher BMI, waist circumference, systolic and diastolic blood pressure, total cholesterol, total cholesterol:high-density lipoprotein (HDL) cholesterol ratio, low-density lipoprotein (LDL) cholesterol, triglycerides, C-reactive protein, serum creatinine, serum cystatin C and UAE; and to be more frequently using antihypertensive and lipid-lowering drugs and vitamin K antagonists at baseline. Conversely, participants with higher dp-ucMGP had lower eGFR and HDL cholesterol and were less likely to be currently smoking.
Baseline characteristics of the 3969 participants according to sex-stratified quartiles of dp-ucMGP
| Sex-stratified quartiles of dp-ucMGP | |||||||
|---|---|---|---|---|---|---|---|
| I | II | III | IV | ||||
| dp-ucMGP (pmol/L) | Males | <245 | 245–381 | 382–550 | >550 | ||
| Females | <193 | 193–341 | 342–513 | >513 | |||
| No. of participants | All participants (N = 3969) | Males | 477 | 477 | 477 | 476 | |
| Females | 516 | 515 | 516 | 515 | Ptrend | ||
| Sociodemographic characteristics | |||||||
| Age (years), mean ± SD | 52.3 ± 11.6 | 48.7 ± 10.5 | 49.4 ± 10.3 | 52.5 ± 11.1 | 58.7 ± 11.6 | <0.001 | |
| Race, n (%) | |||||||
| Caucasian | 3773 (95.1) | 925 (93.2) | 942 (95.0) | 946 (95.3) | 960 (96.9) | <0.001 | |
| Negroid | 32 (0.8) | 16 (1.6) | 6 (0.6) | 8 (0.8) | 2 (0.2) | ||
| Asian | 83 (2.1) | 25 (2.5) | 20 (2.0) | 23 (2.3) | 15 (1.5) | ||
| Other | 49 (1.2) | 20 (2.0) | 16 (1.6) | 9 (0.9) | 4 (0.4) | ||
| Education, n (%) | |||||||
| Low | 1629 (41.0) | 338 (34.0) | 352 (35.5) | 418 (42.1) | 521 (52.6) | <0.001 | |
| Middle | 1028 (25.9) | 279 (28.1) | 262 (26.4) | 254 (25.6) | 223 (23.5) | ||
| High | 1312 (33.1) | 376 (37.9) | 378 (38.1) | 321 (32.3) | 237 (23.9) | ||
| Current smoking | 1080 (27.2) | 309 (31.1) | 324 (32.7) | 263 (26.5) | 184 (18.6) | <0.001 | |
| Drinking alcohol (≥10 g/day), n (%) | 1049 (26.4) | 252 (25.4) | 248 (25.0) | 272 (27.4) | 277 (28.0) | 0.11 | |
| Prevalent type 2 diabetes, n (%) | 14 (0.35) | 1 (0.10) | 3 (0.30) | 2 (0.20) | 8 (0.81) | 0.017 | |
| Prevalent cardiovascular disease, n (%) | 223 (5.6) | 24 (2.4) | 37 (3.7) | 61 (6.1) | 101 (10.2) | <0.001 | |
| Body composition, mean ± SD | |||||||
| BMI (kg/m2) | 26.4 ± 4.1 | 25.4 ± 3.7 | 25.6 ± 3.7 | 26.6 ± 4.0 | 28.0 ± 4.6 | <0.001 | |
| Waist circumference (cm) | 91.1 ± 12.3 | 87.9 ± 11.3 | 88.7 ± 11.6 | 92.0 ± 12.1 | 96.0 ± 12.5 | <0.001 | |
| Males | 96.2 ± 10.6 | 92.5 ± 9.9 | 94.4 ± 10.0 | 97.6 ± 10.2 | 100.5 ± 10.7 | <0.001 | |
| Females | 86.4 ± 11.9 | 83.6 ± 10.8 | 83.4 ± 10.5 | 86.8 ± 11.5 | 91.9 ± 12.7 | <0.001 | |
| Haemodynamic, mean ± SD | |||||||
| Systolic blood pressure (mmHg) | 124.6 ± 18.0 | 121.7 ± 15.6 | 120.7 ± 16.2 | 125.3 ± 18.4 | 130.6 ± 20.0 | <0.001 | |
| Diastolic blood pressure (mmHg) | 72.7 ± 8.8 | 71.7 ± 8.4 | 71.7 ± 8.7 | 72.8 ± 9.0 | 74.5 ± 9.0 | <0.001 | |
| Lipid spectrum, mean ± SD | |||||||
| Total cholesterol (mmol/L) | 5.4 ± 1.0 | 5.3 ± 1.1 | 5.4 ± 1.0 | 5.5 ± 1.1 | 5.5 ± 1.1 | <0.001 | |
| HDL cholesterol (mmol/L) | 1.27 ± 0.30 | 1.30 ± 0.31 | 1.29 ± 0.30 | 1.26 ± 0.30 | 1.24 ± 0.29 | <0.001 | |
| Total cholesterol:HDL ratio | 4.5 ± 1.3 | 4.3 ± 1.3 | 4.4 ± 1.3 | 4.5 ± 1.2 | 4.6 ± 1.2 | <0.001 | |
| Triglycerides (mmol/L), median (IQR) | 1.08 (0.79–1.55) | 1.05 (0.76–1.48) | 1.02 (0.76–1.50) | 1.07 (0.79–1.53) | 1.21 (0.90–1.68) | 0.001 | |
| Inflammation | |||||||
| High-sensitive C-reactive protein, median (IQR) | 1.26 (0.58–2.85) | 1.08 (0.50–2.89) | 0.99 (0.49–2.37) | 1.23 (0.60–2.68) | 1.68 (0.87–3.51) | 0.002 | |
| Kidney function parameters, mean ± SD | |||||||
| Serum creatinine (μmol/L) | 72.4 ± 16.9 | 70.3 ± 12.8 | 70.8 ± 12.3 | 71.7 ± 14.2 | 76.9 ± 24.5 | <0.001 | |
| Serum cystatin C (mg/L) | 0.90 ± 0.19 | 0.85 ± 0.15 | 0.86 ± 0.14 | 0.89 ± 0.16 | 1.00 ± 0.26 | <0.001 | |
| eGFRSCr-SCys (mL/min/1.73 m2) | 95.4 ± 21.8 | 102.2 ± 20.9 | 99.7 ± 20.2 | 95.7 ± 20.3 | 84.1 ± 21.3 | <0.001 | |
| eGFRSCr (mL/min/1.73 m2) | 94.0 ± 15.1 | 98.4 ± 13.8 | 97.1 ± 13.0 | 94.5 ± 13.4 | 86.1 ± 16.7 | <0.001 | |
| eGFRSCys (mL/min/1.73 m2) | 91.3 ± 18.8 | 97.9 ± 16.5 | 95.8 ± 16.1 | 91.7 ± 17.0 | 79.9 ± 19.9 | <0.001 | |
| UAE (mg/24 h), median (IQR) | 7.9 (5.9–12.5) | 7.6 (5.8–11.4) | 7.4 (5.7–11.0) | 7.9 (6.0–12.1) | 8.9 (6.1–15.7) | <0.001 | |
| Categories of UAE (mg/24 h), n (%) | |||||||
| <15 | 3211 (80.9) | 844 (85.0) | 827 (83.4) | 815 (82.1) | 725 (73.2) | <0.001 | |
| 15–29.9 | 412 (10.4) | 92 (9.3) | 104 (10.5) | 98 (9.9) | 118 (11.9) | ||
| 30–300 | 315 (7.9) | 54 (5.4) | 56 (5.6) | 73 (7.4) | 132 (13.3) | ||
| >300 | 31 (0.8) | 3 (0.3) | 5 (0.5) | 7 (0.7) | 16 (1.6) | ||
| Medication, n (%) | |||||||
| Antihypertensive drugs | 758 (19.1) | 143 (14.4) | 127 (12.8) | 162 (16.3) | 326 (32.9) | <0.001 | |
| Lipid-lowering drugs | 362 (9.1) | 54 (5.4) | 69 (7.0) | 88 (8.9) | 151 (15.2) | <0.001 | |
| Vitamin K antagonists | 87 (2.2) | 7 (0.7) | 4 (0.4) | 6 (0.6) | 70 (7.1) | <0.001 | |
dp-ucMGP and renal function
Higher plasma dp-ucMGP was associated with lower eGFR (Table 1); eGFRSCr-SCys in the second, third and fourth sex-stratified quartiles was lower, with respective mean values for difference compared with the first quartile of the dp-ucMGP distribution of −2.5, −6.5 and −18.1 mL/min/1.73 m2 (P < 0.001), indicative of a quadratic association. Indeed, addition of a squared term to the crude model significantly improved the model fit (P < 0.001; Table 2). A graphical representation of this association is shown in Figure 2. After full adjustment for potential confounders, eGFRSCr-SCys remained associated with plasma dp-ucMGP in a curvilinear fashion, wherein lower values of eGFRSCr-SCys predicted ever-increasing levels of plasma dp-ucMGP (P for squared term = 0.006; Table 2). Associations of eGFRSCr and eGFRSCys with log2 dp-ucMGP were of similar magnitude (Supplementary data, Table S2).
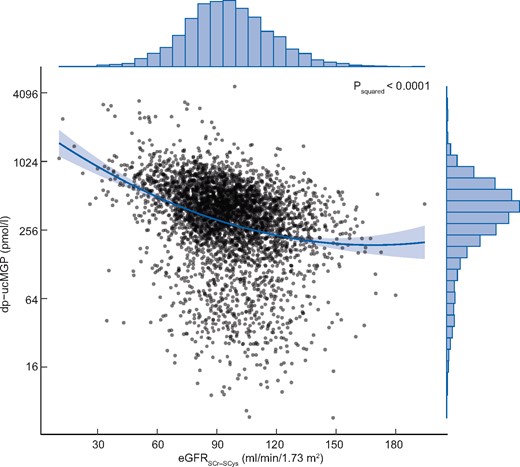
Graphic representation of the curvilinear association of eGFRSCr-SCys with functional vitamin K status derived from the univariable linear regression model defined as log2 dp-ucMGPi = b0 + b1 × eGFRSCr-SCysi + b2 × eGFRSCr-SCys2i + ei. The dark sea green line represents the regression line and the light grey area about the line is the associated 95% confidence band. The distributions of log2 dp-ucMGP and eGFRSCr-SCys in the study sample are given by the histograms in the right and upper margin, respectively. SCr, serum creatinine; SCys, serum cystatin C.
Multivariable linear regression models of eGFRSCr-SCys as a determinant of dp-ucMGP
| Model | Variables | β | 95% CI of β | Std. β | P-value | Adjusted R2 | AIC | Pcomparisona |
|---|---|---|---|---|---|---|---|---|
| 1 | eGFRSCr-SCys (+10 mL/min/1.73 m2) | −0.170 | −0.187 to −0.153 | −0.296 | <0.001 | 0.087 | 12693 | <0.001 |
| 2 | eGFRSCr-SCys | −0.401 | −0.500 to −0.303 | −0.698 | <0.001 | 0.092 | 12673 | |
| 0.012 | 0.007–0.017 | 0.408 | <0.001 | |||||
| 3b | eGFRSCr-Scys | −0.117 | −0.140 to −0.094 | −0.204 | <0.001 | 0.102 | 12631 | <0.001 |
| 4b | eGFRSCr-SCys | −0.281 | −0.384 to −0.178 | −0.489 | <0.001 | 0.104 | 12623 | |
| 0.008 | 0.003–0.013 | 0.283 | 0.001 | |||||
| 5c | eGFRSCr-Scys | −0.109 | −0.131 to −0.086 | −0.189 | <0.001 | 0.121 | 12554 | 0.001 |
| 6c | eGFRSCr-SCys | −0.254 | −0.361 to −0.148 | −0.442 | <0.001 | 0.122 | 12548 | |
| 0.007 | 0.002–0.012 | 0.250 | 0.006 |
Evidence against the null hypothesis of no improvement in fit for the data by the more complex model based upon a likelihood-ratio test.
Adjusted for age and sex.
Adjusted for age, sex, current smoking, BMI, systolic blood pressure, use of antihypertensive drugs, use of lipid-lowering drugs, prevalent type 2 diabetes, prevalent cardiovascular disease and UAE.
AIC, Akaike information criterion; std. β, standardized regression coefficient; SCr, serum creatinine; SCys, serum cystatin C.
dp-ucMGP, incident CKD and microalbuminuria
At baseline, 142 (3.6%) participants had an eGFRSCr-SCys <60 mL/min/1.73 m2 and 346 (8.7%) had microalbuminuria, who were excluded from analyses for incident eGFR <60 mL/min/1.73 m2 and incident microalbuminuria, respectively. Among 3827 participants at risk, 205 (5.4%) developed incident CKD during a median follow-up of 7.1 (IQR 5.0–7.4) years. For every 2-fold increase in plasma dp-ucMGP at baseline, the HR for incident CKD was 1.85 [95% confidence interval (CI) 1.59–2.16; P < 0.001] (Figure 3A). Risk estimates did not significantly differ between the sexes (Table 3). Similar results were found for the associations of plasma dp-ucMGP with incident CKD based on eGFRSCr <60 mL/min/1.73 m2 and eGFRSCys <60 mL/min/1.73 m2 (Table 3). The association of plasma dp-ucMGP with incident CKD disappeared following adjustment for the confounding effect of baseline eGFR [HR 0.99 (95% CI 0.88–1.12); P = 0.86] (Figure 3B). Exclusion of participants using vitamin K antagonists did not materially alter the results obtained from the main analysis (Supplementary data, Table S3).
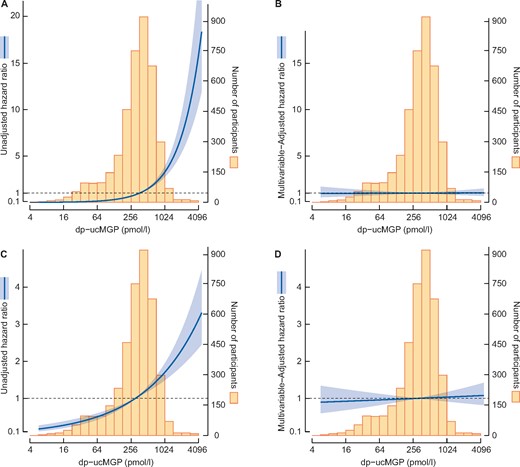
Graphic representation of the association of log2 dp-ucMGP with incident CKD (A and B) and development of microalbuminuria (C and D). Incident CKD was defined as reaching eGFRSCr-SCys <60 mL/min/1.73 m2. The mean concentration of log2 plasma dp-ucMGP was chosen as a reference. The dark sea green line refers to the HR for any particular concentration of dp-ucMGP and the light grey area about the line is the associated 95% confidence band. The distribution of log2 dp-ucMGP in the study sample is given by the histogram in the background. The evidence against the null hypothesis of no quadratic association of eGFRSCr-SCys with log2 dp-ucMGP is indicated by the P2 within the box. SCr, serum creatinine; SCys, serum cystatin C.
Total and sex-stratified associations of dp-ucMGP with incident CKD (eGFR <60 mL/min/1.73 m2) and incident microalbuminuria
| eGFRSCr-SCys <60 mL/min/1.73 m2 | eGFRSCr <60 mL/min/1.73 m2 | eGFRSCys <60 mL/min/1.73 m2 | Incident microalbuminuria | |||||||||
|---|---|---|---|---|---|---|---|---|---|---|---|---|
| Males | nevents/ntotal = 111/1825 | nevents/ntotal = 91/1845 | nevents/ntotal = 156/1759 | nevents/ntotal = 181/1689 | ||||||||
| Females | nevents/ntotal = 94/2002 | nevents/ntotal = 81/2019 | nevents/ntotal = 127/1960 | nevents/ntotal = 122/1934 | ||||||||
| Log2 dp-ucMGP | HR (95% CI) | P-value | Pinteractiona | HR (95% CI) | P-value | Pinteractiona | HR (95% CI) | P-value | Pinteractiona | HR (95% CI) | P- value | Pinteractiona |
| Total population | ||||||||||||
| Model 1 | 1.85 (1.59–2.16) | <0.001 | 1.68 (1.43–1.98) | <0.001 | 1.73 (1.52–1.98) | <0.001 | 1.19 (1.07–1.32) | 0.001 | ||||
| Model 2 | 1.26 (1.10–1.44) | 0.001 | 0.07 | 1.16 (1.01–1.33) | 0.040 | 0.25 | 1.22 (1.09–1.36) | 0.001 | 0.08 | 1.03 (0.94–1.14) | 0.50 | 0.028 |
| Model 3 | 1.20 (1.05–1.37)ǁ | 0.007 | 0.06 | 1.11 (0.97–1.27)ǁ | 0.14 | 0.37 | 1.17 (1.05–1.31)ǁ | 0.006 | 0.049 | 1.01 (0.91–1.11)† | 0.92 | 0.08 |
| Model 4 | 0.99 (0.88–1.12)† | 0.86 | 0.22 | 1.01 (0.88–1.15)‡ | 0.90 | 0.55 | 1.06 (0.96–1.18)# | 0.27 | 0.11 | 1.03 (0.93–1.14)ǁ | 0.61 | 0.29 |
| Males | ||||||||||||
| Model 1 | 1.61 (1.32–1.97) | <0.001 | 1.90 (1.52–2.39) | <0.001 | 1.56 (1.31–1.85) | <0.001 | 1.37 (1.17–1.60) | <0.001 | ||||
| Model 2 | 1.11 (0.93–1.32) | 0.26 | 1.23 (1.00–1.52) | 0.06 | 1.09 (0.94–1.27) | 0.27 | 1.10 (0.95–1.27) | 0.20 | ||||
| Model 3 | 1.08 (0.91–1.28)ǁ | 0.40 | 1.17 (0.96–1.44)ǁ | 0.12 | 1.05 (0.90–1.22)ǁ | 0.54 | 1.03 (0.89–1.20)† | 0.67 | ||||
| Model 4 | 0.94 (0.80–1.11)† | 0.48 | 1.05 (0.86–1.28)‡ | 0.61 | 0.98 (0.85–1.14)# | 0.81 | 1.07 (0.92–1.24)ǁ | 0.39 | ||||
| Females | ||||||||||||
| Model 1 | 2.20 (1.72–2.81) | <0.001 | 1.47 (1.18–1.82) | 0.001 | 1.95 (1.58–2.39) | <0.001 | 1.02 (0.89–1.16) | 0.80 | ||||
| Model 2 | 1.47 (1.18–1.83) | 0.001 | 1.11 (0.92–1.34) | 0.27 | 1.38 (1.16–1.64) | <0.001 | 0.99 (0.87–1.13) | 0.88 | ||||
| Model 3 | 1.39 (1.12–1.71)ǁ | 0.003 | 1.06 (0.88–1.27)ǁ | 0.55 | 1.33 (1.12–1.57)ǁ | 0.001 | 0.98 (0.88–1.12)† | 0.78 | ||||
| Model 4 | 1.05 (0.87–1.28)† | 0.60 | 0.95 (0.80–1.13)‡ | 0.58 | 1.15 (0.99–1.35)# | 0.07 | 1.00 (0.87–1.15)ǁ | 0.99 | ||||
Evidence against the null hypothesis of no effect modification by sex on the association of binary logarithmic dp-ucMGP with the specific outcome concerned.
Model 1: crude.
Model 2: adjusted for age and sex (only applicable for the total population).
Model 3: model 2 + current smoking, BMI, systolic blood pressure, use of antihypertensive drugs, use of lipid-lowering drugs, prevalent type 2 diabetes, prevalent cardiovascular disease and †eGFRSCr-SCys or ǁUAE.
Model 4: model 3 + †eGFRSCr-SCys,
eGFRSCror
eGFRSCys,
UAE.
SCr, serum creatinine; SCys, serum cystatin C.
Of the 3623 participants at risk of microalbuminuria, 303 (8.4%) developed microalbuminuria during a median follow-up of 7.3 (IQR 6.1–7.7) years. A doubling in plasma dp-ucMGP was associated with increased risk of microalbuminuria in the total population [1.19 (IQR 1.07–1.32); P = 0.001] and risk estimates differed significantly between the sexes (Pinteraction = 0.028) (Table 3; Figure 3C). The association of plasma dp-ucMGP with the development of microalbuminuria appeared to be present in males [1.37 (IQR 1.17–1.60); P < 0.001] but not in females [1.02 (IQR 0.89–1.16); P = 0.80]. However, this association lost significance after adjustment for age in both the total population [1.03 (IQR 0.94–1.14); P = 0.50] (Figure 3D) and in males [1.10 (IQR 0.95–1.27); P = 0.20]. Similar risk estimates were obtained after excluding participants using vitamin K antagonists (Supplementary data, Table S3).
DISCUSSION
In this study we found that baseline eGFR was significantly associated with plasma dp-ucMGP, a marker of poor vitamin K status, wherein lower values of eGFR were associated with increasing levels of plasma dp-ucMGP. In time-to-event analyses, higher plasma dp-ucMGP was associated with incident CKD (eGFR <60 mL/min/1.73 m2) and microalbuminuria, separately. However, these associations lost significance, with lower point estimates of HRs after respective adjustment for baseline values of eGFR and age, indicating that the association of dp-ucMGP with incident CKD was driven by the participants’ baseline renal function and that of plasma dp-ucMGP with microalbuminuria by baseline age.
Circulating vitamin K concentrations are rarely measured in clinical practice, partially due to scarce availability of validated high-throughput analyses [17], but primarily because they merely reflect short-term dietary intake and production by microbiota in the colon, albeit unclear to what extent, if any, absorption occurs at such distal sites [18]. Conversely, circulating dp-ucMGP provides a reliable indicator of functional vitamin K status [19]. In 2016, Wei et al. [20] demonstrated that circulating dp-ucMGP is inversely proportional to eGFR, lending support to the concept that active MGP heralds renoprotective effects beyond its capacity to inhibit vascular calcification [21]. One year later, Wei et al. [3] overcame the cross-sectional limitation of their previous study using available follow-up data in a subset of the initial cohort of the FLEMENGHO study, wherein they showed that circulating dp-ucMGP is a predictive marker of incident CKD and microalbuminuria in the general population [20]. Likewise, we found that plasma dp-ucMGP was independently associated with baseline eGFR, which was best described by a curvilinear association. However, in the PREVEND cohort, the prospective associations of plasma dp-ucMGP with incident CKD and microalbuminuria, as demonstrated by Wei et al. [3], were lost following respective adjustments for baseline eGFR and age.
There are a few differences between the study of Wei et al. [3] and this study, which could potentially explain the observed discrepancy. In the description of the results of Wei et al. [3], it remained unclear whether associations were established crudely or with multivariable adjustment, including simultaneous adjustment for age, sex and BMI. Furthermore, the mean age of the participants in the PREVEND study was 52.3 ± 11.6 years, while the mean age of the participants of the FLEMENGHO study was 42.2 ± 15.6 years. Cranenburg et al. [22] demonstrated that plasma dp-ucMGP levels increase with advancing age in the general population, which was corroborated by the strong trend in age across sex-stratified quartiles of dp-ucMGP (Table 1). Considering the fact that the multivariable-adjusted analyses of Wei et al., in which the endpoint of incident CKD was considered, were neither adjusted for age (nor for sex or BMI) leaves the possibility that a large part of the association found by Wei et al. was driven by a remaining confounding effect of age. Moreover, we showed that higher plasma dp-ucMGP was associated with higher BMI and waist circumference (P < 0.0001), further extending the possibility of residual confounding.
Noteworthy strengths of this study were the size of the study, the complete follow-up and extensive data collection, allowing for adjustment for a wide variety of potential confounders. Further, the availability of both serum creatinine and serum cystatin C allowed us to investigate the currently recommended serum cystatin C–based equations for estimating GFR in addition to the commonly used serum creatinine–based equation [9]. An additional major strength is the collection of 24-h urinary collections, permitting accurate assessment of the endpoint of incident microalbuminuria.
Our study has a few limitations. First, the evaluation of plasma dp-ucMGP was based on a single measurement and within-person variation may therefore be a potential source for measurement error. Osteocalcin—like MGP, a protein of which the carboxylation status also depends upon vitamin K—is known to have a diurnal variation, with peak concentrations at 4:00 a.m. and a nadir between 12:00 and 4:00 p.m. [23]. Since all blood samples were obtained between 8:00 and 10:00 a.m., the measurement error derived from potential within-person variation in dp-ucMGP is assumed to be negligible, provided that dp-ucMGP follows a similar diurnal pattern. Second, the relative overrepresentation of Caucasian individuals in this study reduces the generalizability of our findings to individuals of other ethnicity and therefore requires verification in other populations.
Taken together, we were unable to independently replicate the findings of Wei et al. [3]. The association between plasma dp-ucMGP and incident CKD lost significance after adjustment for baseline eGFR, implying that the effect of dp-ucMGP on eGFR is dependent upon the effect of baseline eGFR. Future studies should aim to further investigate the potential prognostic value of dp-ucMGP in the prediction of renal function deterioration and development of albuminuria. Provided that the associations found by Wei et al. [3] hold after simultaneous adjustment for age, BMI and baseline eGFR (indicating independence of these confounders), they comprise important data in that they indicate a potential role of low vitamin K status in the development of renal insufficiency and the opening of a new avenue for potential preventive treatment.
SUPPLEMENTARY DATA
Supplementary data are available at ndt online.
FUNDING
The Dutch Kidney Foundation supported the infrastructure of the PREVEND program from 1997 to 2003 (grant E.033). The University Medical Center Groningen supported the infrastructure from 2003 to 2006. Dade Behring, Ausam, Roche and Abbott financed laboratory equipment and reagents. The Dutch Heart Foundation supported studies on lipid metabolism from 2001 to 2005.
AUTHORS’ CONTRIBUTIONS
All authors substantially contributed to the manuscript design and/or revision. The authors have agreed to accountability for all aspects of this study. D.G. had full access to all of the data in the study and takes responsibility for the integrity of the data and the accuracy of the data analysis. D.G. and I.J.R. had final responsibility for the decision to submit for publication. D.G. conducted the literature search, analysed the data and created the figures. D.G. and A.P. wrote the article. D.G. and I.J.R. conceived and designed the study. E.H., J.H.J.B. and S.J.L.B. acquired data. D.G., S.J.L.B. and I.J.R. interpreted the data. I.J.R. supervised the study. All authors critically revised the manuscript for important intellectual content and approved the final version of the manuscript.
CONFLICT OF INTEREST STATEMENT
L.J.S. received funding from NattoPharma and IDS. All other authors declare no conflicts of interest.
DATA AVAILABILITY STATEMENT
The data underlying this article will be shared upon reasonable request to the corresponding author.


Comments