


Abstract
The effect of dialysis dose on mortality remains unsettled. Current guidelines recommend targeting a single-pool Kt/V (spKt/V) at 1.20–1.40 per thrice-weekly dialysis session. However, the optimal dialysis dose remains mostly disputed.
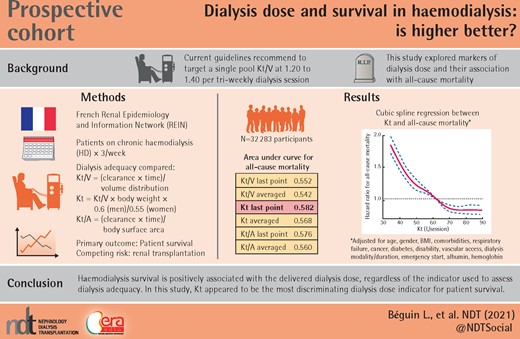
In a nationwide registry of all incident patients receiving thrice-weekly haemodialysis, 32 283 patients had available data on dialysis dose, estimated by Kt/V and its variants epuration volume per session (Kt) and Kt indexed to body surface area (Kt/A). Survival was analysed with a multivariate Cox model and a concurrent risk model accounting for renal transplantation. A predictive model of Kt in the upper quartile was developed.
Regardless of the indicator, a higher dose of dialysis was consistently associated with better survival. The survival differential of Kt was the most discriminating, but marginally, compared with the survival differential according to Kt/V and Kt/A. Patient survival was higher in the upper quartile of Kt (>69 L/session) then deteriorated as the Kt decreased, with a difference in survival between the upper and lower quartile of 23.6% at 5 years. Survival differences across Kt distribution were similar after accounting for kidney transplantation as a competing risk. Predictive factors for Kt in the upper quartile were arteriovenous fistula versus catheters and graft, haemodiafiltration versus haemodialysis, scheduled dialysis start versus emergency start, long weekly dialysis duration and spKt/V measurement versus double-pool equilibrated Kt/V.
Our data confirm the existence of a relationship between dialysis dose and survival that persisted despite correcting for known confounders. A model for predicting a high dose of dialysis is proposed with practical relevance.
KEY LEARNING POINTS
What is already known about this subject?
Optimal dialysis dose, as measured by Kt/V or its variant epuration volume per session (Kt), is a controversial issue in haemodialysis.
Past randomized trials either failed to demonstrate a beneficial effect on survival by increasing dialysis doses or used target dialysis doses considered as obsolete in recent guidelines.
What this study adds?
Using a contemporary nationwide registry, we analysed the relationship between survival and dialysis dose assessed by Kt/V and its variants Kt and Kt/S and used competitive risk models.
We found a direct relationship between survival and dialysis dose up to a Kt/V of 1.8 or a Kt of 69 L/session.
What impact this may have on practice or policy?
Based on our results, we suggest optimal dialysis doses higher than those previously recommended.
A predictive model of Kt in the upper quartile was developed, some factors of which are amenable in daily practice.
INTRODUCTION
The number of patients receiving dialysis is skyrocketing worldwide, expected to reach ∼4.9 million by 2025. Survival of these patients varies from country to country but generally remains poor. For example, in the French Renal Epidemiology and Information Network (REIN) registry, the median survival rate was 5 years with a median age of 71 years at renal replacement therapy (RRT) initiation [1].
The effect of dialysis dose on mortality in haemodialysis (HD) patients remains disputed. Current guidelines suggest quantifying the dialysis dose from a dimensionless index Kt/V, where K is the clearance of urea from the dialyser, t is the duration of the session and V is the volume of distribution of the urea [2, 3]. The determination of Kt/V is based on models of per-dialytic urea kinetics and can be estimated either by single-pool Kt/V (spKt/V) or by double-pool Kt/V, which accounts for the post-dialytic rebound of urea [equilibrated Kt/V (eKt/V)] [2–4]. Current guidelines recommend targeting an spKt/V of 1.40 per thrice-weekly dialysis session with a minimum delivered spKt/V of 1.20 [2, 4].
The National Cooperative Dialysis Study (NCDS) indicated the dialysis dose values below which mortality increases but did not provide information on the optimal quantity of dialysis dose for treatment [5–9]. This study included only 185 patients and showed a lower survival and more frequent hospitalizations when spKt/V equivalent was <0.80. The hemodialysis (HEMO) Study, conducted in 1846 patients, examined the effect of two dialysis doses on patient survival: spKt/V 1.25 (or eKt/V 1.05) versus spKt/V 1.65 (or eKt/V 1.45) [6]. There was no overall effect of dialysis dose on survival, but subgroup analyses suggested a beneficial effect of a higher dialysis dose in women [10]. The international Dialysis Outcomes and Practice Patterns Study (DOPPS I, found no difference in survival according to the dialysis dose, but a secondary subgroup analysis showed a benefit of a Kt/V equivalent >1.20 on female survival [11]. Several other retrospective studies found an impact of dialysis dose on survival [12–15]. Of note, most of these studies were conducted in 1980–2000, before the wider availability of high-flux dialysers.
To quantify the dialysis dose, Kt/V remains the recommended index [2, 3]. V is not measured directly, and is estimated at 60% of the body weight, but can vary considerably among patients and over time. Recently Kt/V was proposed to be calculated from ionic dialysance of sodium and a hypothetical V [16]. Other dialysis dose indicators have been explored, particularly the epuration volume per session (Kt) and its variants. Lowrie et al. [17] showed that Kt increases with body surface area according to a curvilinear curve and validated a Kt target adapted to the body surface area [18]. In 2013, a Spanish multicentre study in 3275 patients compared Kt with Kt/V and found 25% of patients reaching the target Kt/V without reaching the minimum target Kt, including most women and patients dialysing on catheters [19]. Other authors have proposed indexing Kt to body surface area (Kt/A), which would be better correlated to metabolic activity and normalized protein catabolism [20, 21]. Studies of Kt/A have generally revealed an insufficient dialysis dose in women and small-stature patients [21–24].
In this work based on data from the REIN registry, we assessed the impact of the dialysis dose on survival according to Kt/V and its variants. Also, we analysed the dialysis parameters determining mortality and high dialysis dose.
MATERIALS AND METHODS
Our study was based on data from the French nationwide REIN registry, which covers all incident patients from 2008 to the end of 2016 in 22 metropolitan regions and 5 overseas departments. We included all adult patients treated with chronic HD three times a week who had data for at least one Kt/V during their follow-up. Exclusion criteria were paediatric patients (<18 years of age), patients treated with peritoneal dialysis, patients who were dialysed daily or twice weekly at any time during their course and patients without Kt/V information.
The data recorded directly in the REIN have been extensively reported [1]. Kt/V is recorded directly in the registry as well as its measurement modes: spKt/V, double pool, ionic dialysance, standard Kt/V and weekly urea clearance. For evaluating survival according to dialysis dose and exposure we used six indicators derived from Kt/V [25]: Kt/V available at the last point, average of Kt/V during follow-up, Kt at the last point [calculated as Kt/V × Bodyweight (BW) × 0.60 for men or Kt/V × BW × 0.55 for women], average of Kt during follow-up, Kt/A at the last point (A = body surface area in square meters calculated according to Boyd’s formula [26]) and averaged Kt/A.
The population was described in terms of its demographic characteristics, comorbidities and HD technique, using percentage distribution. Quantitative variables were described in groups of increasing values. Qualitative variables were represented by the frequency of each of their modalities.
To assess the causal relationship between dialysis dose and mortality we used directed acyclic graphs (DAGs; http://dagitty.net/dags.html), based on clinical expertise, including the potential confounders (dialysis modality and duration, comorbidities, gender, vascular access, emergency start, serum albumin and unobserved practice patterns). C-test analyses and survival curves were used to identify the final dose indicator (Kt/V and its variants).
Factors associated with the probability of all-cause mortality were explored with a Cox regression and restricted cubic splines for the last Kt and last Kt/V treated as a continuous variable. Model 1 was adjusted for age; Model 2 was adjusted for age, gender, body mass index (BMI), number of cardiovascular comorbidities, respiratory failure, malignancy and diabetes; Model 3 was adjusted for Model 2 covariates plus disability, vascular access, dialysis modality, dialysis duration, emergency start, serum albumin and haemoglobin at the last point.
Mortality in dialysis, taking into account the concurrent risk of transplantation, was studied with a Cox model censored at transplantation (‘cause-specific HR’) with cubic splines, adjusted on the confounding variables [27].
Analysis of the factors predicting the achievement of the upper quartile indicator was performed by logistic regression.
Finally, the distribution of the different Kt/V measurement methods (double pool, spKt/V and ionic dialysance) were analysed and integrated into the logistic regression model and an interaction analysis using the Wald test was performed [28].
Hazard ratios (HRs) and odds ratios (ORs) are presented with their 95% confidence intervals (CIs). All statistical tests were two-tailed and the threshold for statistical significance was set to P < 0.05.
Analyses were performed with SAS Enterprise Guide version 5.1 (SAS Institute, Cary, NC, USA) software.
RESULTS
A total of 70 064 incident patients were included in the REIN registry from 2008 to 2016. We excluded 1694 patients due to peritoneal dialysis during their follow-up, 4026 patients who had dialysis other than three times a week during their course, 21 701 patients with no Kt/V information and 10 414 patients with no weight information. A total of 32 283 patients were retained in the final analysis (Flow chart, Supplementary data, Figure S1), whose characteristics are summarized in Table 1. The median follow-up was 37.2 months [interquartile range (IQR) 20.1–61.6] and the mean was 43.1 months [standard deviation (SD) 28.6]. The median number of Kt/V determinations per patient was 3 [IQR 1–4; mean 2.97 (SD 1.89)] and 8365 patients (25.8%) had only one Kt/V available during the follow-up.
Descriptive characteristics of the population, by quartiles of Kt
| Variable, % | Kt <48 L | Kt 48–58L | Kt 58–69 L | Kt ≥69 L | P-value | P adjusted for age |
|---|---|---|---|---|---|---|
| Age ≥75 years | 47.9 | 40.3 | 37.6 | 31.6 | *** | |
| Male | 51.7 | 64.6 | 69.6 | 69.9 | NS | NS |
| Diabetes | 35.2 | 40.5 | 46.9 | 56.2 | *** | *** |
| BMI ≥30 kg/m2 | 6.7 | 10.8 | 24.5 | 53.6 | *** | *** |
| Coronary heart disease | 24.1 | 24.6 | 27.7 | 26.4 | NS | NS |
| Congestive heart failure | 27.3 | 24.3 | 23.8 | 24.1 | NS | NS |
| Heart rhythm disorders | 23.8 | 21.8 | 21.8 | 23.2 | ** | ** |
| Peripheral arteriopathy | 20.5 | 20.0 | 21.7 | 21.6 | NS | * |
| Stroke | 11.4 | 11.8 | 11.1 | 10.8 | NS | NS |
| Aortic aneurysm | 4.2 | 4.4 | 4.5 | 4.3 | NS | NS |
| Respiratory insufficiency | 12.8 | 13.3 | 15.2 | 19.5 | *** | *** |
| Active cancer | 13.4 | 11.5 | 9.7 | 9.6 | NS | NS |
| Autonomous walking | 79.1 | 84.0 | 86.5 | 85.6 | NS | NS |
| Emergency start of HD | 35.9 | 33.2 | 30.0 | 26.4 | *** | *** |
| AVF as last access | 61.3 | 74.2 | 79.5 | 84.4 | *** | *** |
| Dialysis modality: HD at last point | 81.3 | 74.3 | 63.6 | 50.5 | *** | *** |
| In-centre HD at last point | 74.8 | 65.0 | 62.0 | 61.8 | NS | NS |
| Weekly dialysis duration ≥12 h at last point | 56.7 | 78.6 | 87.2 | 93.8 | *** | *** |
Lacking data: 0% for diabetes, 11% for BMI, 2% for coronary heart disease, 2% for heart failure, 2% for heart rhythm disorders, 3% for peripheral arteriopathy, 2% for aortic aneurysm, 2% for cancer, 3% for respiratory insufficiency, 8% for autonomous walking and 5% for emergency start.
NS, non-significant. *P < 0.05, **P < 0.01, ***P < 0.001.
The six indicators were compared using survival curves and a C-test to determine the most discriminating indicator with the area under the curve (AUC) (Table 2). The indicator for which differences in survival was most pronounced, although marginally, was the Kt at the last point, which was retained for further analyses.
Comparison of the AUC of the six indicators with the C-test of logistic regression
| Kt/V last point | Kt/V averaged | Kt last point | Kt averaged | Kt/S last point | Kt/S averaged | |
|---|---|---|---|---|---|---|
| AAUC | 0.552 | 0.542 | 0.582 | 0.568 | 0.576 | 0.56 |
| Kt/V last point | Kt/V averaged | Kt last point | Kt averaged | Kt/S last point | Kt/S averaged | |
|---|---|---|---|---|---|---|
| AAUC | 0.552 | 0.542 | 0.582 | 0.568 | 0.576 | 0.56 |
AUC, Area Under the Curve.
Survival HR according to Kt at the last point is depicted in Figure 1. There was a dose–effect relationship for survival across the whole range of Kt values. We found a steady curvilinear decrease in mortality HRs for Kt up to 69 L, but the relationship flattened beyond that threshold. A similar relationship between survival HRs and Kt was observed in the three adjusted models. We found a similar curve between survival HRs and Kt/V (Figure 2) and Kt/S. The nadir of mortality risk was observed for Kt/V > 1.8.
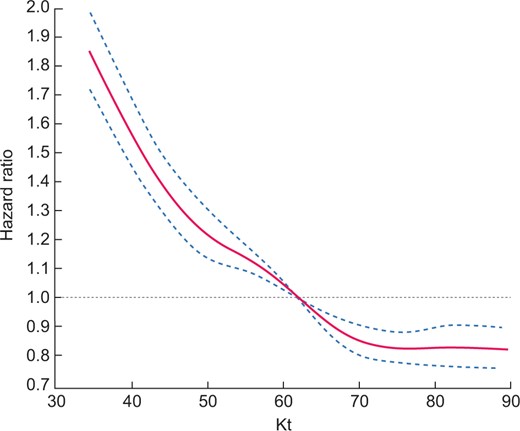
Cubic spline regression analyses of the relationship between all-cause mortality and Kt (L/session) as dose of dialysis: Model 3, adjusted for age, gender, BMI, comorbidities, respiratory failure, cancer, diabetes, disability, vascular access, dialysis modality, dialysis duration, emergency start, serum albumin and haemoglobin at last point.
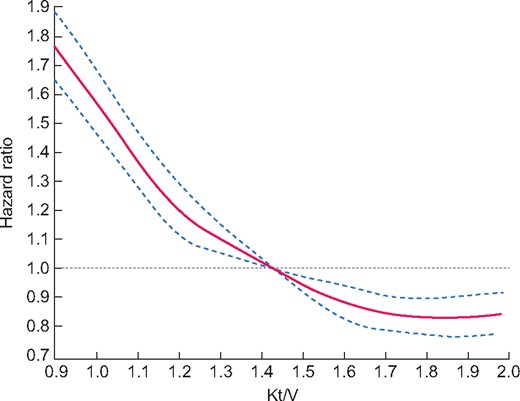
Cubic spline regression analyses of the relationship between all-cause mortality and Kt/V as dose of dialysis: Model 3, adjusted for age, gender, BMI, comorbidities, respiratory failure, cancer, diabetes, disability, vascular access, dialysis modality, dialysis duration, emergency start, serum albumin and haemoglobin at last point.
We compared the causes of death in the four Kt quartiles (Table 3). Mortality related to cachexia was significantly higher in the lower Kt group (<48 L) and decreased with increasing Kt (P < 0.0001). The other causes of mortality were comparable among the Kt quartiles.
Causes of death according to Kt quartiles
| Cause of death | Kt <48 L, % | Kt 48–58 L, % | Kt 58–69 L, % | Kt ≥69 L, % | P-value |
|---|---|---|---|---|---|
| Cardiovascular death | 21.13 | 23.53 | 23.02 | 23.55 | 0.04 |
| Cancer | 11.76 | 11.23 | 12.15 | 11.02 | 0.54 |
| Infections | 11.45 | 12.66 | 13.05 | 14.36 | 0.005 |
| Cachexia | 10.64 | 9.44 | 7.45 | 5.96 | <0.0001 |
| Sudden/unexpected death | 9.02 | 9.53 | 10.44 | 10.95 | 0.004 |
| Unknown causes | 20.69 | 20.03 | 19.82 | 19.91 | 0.79 |
| Other known causes | 15.31 | 13.58 | 14.07 | 14.25 | 0.18 |
| Total | 4089 | 3285 | 2750 | 2667 | – |
Kidney transplantation is a competitive event to death in dialysis. Access to kidney transplantation was comparable among Kt quartiles: 14.78% for Kt <48 L, 18.02% for 48–58 L, 16.76% for 58–69 L and 14.98% for >69 L. After accounting for the competing risk of transplantation, the relation between dose and mortality showed similar trends (Supplementary data, Figures S2 and S3).
Other ‘traditional’ contributors to mortality of HD patients in the multivariate analysis are reported in Supplementary data, Table S1. Pertaining to this study, the use of a tunnelled catheter at the last point or an ‘other’ access was a risk factor for death, with an increase in the instantaneous risk of dying of 83% (P < 0.0001) and >300% (P < 0.001), respectively, compared with an arteriovenous fistula (AVF). There was a non-significant trend of excess risk of death between graft use and AVF percentage (P = 0.0994). Haemodiafiltration was a protective factor compared with HD, with an instant risk reduction of 24% (P < 0.001). There was a trend between the use of haemofiltration and death, with a non-significant excess of risk of 17% (P = 0.49) compared with HD. The weekly duration of dialysis analysed in three classes (<12, 12–15 and >15 h weekly) did not significantly influence survival.
The predictive factors for a Kt in the upper quartile (>69 L/session) were male gender, BMI between 25 and 30 kg/m2 and >30 kg/m2 compared with a BMI of 23–25 kg/m2, presence of active cancer, use of an AVF versus catheter or graft, haemodiafiltration versus HD, haemofiltration versus HD, long weekly dialysis duration, scheduled start of dialysis compared with an emergency start and measurement of Kt/V by spKt/V compared with eKt/V (Table 4). This model had an excellent discrimination property with C-test at 0.85.
Predictive factors of Kt in the upper quartile (>69 L) with their ORs and 95% CIs
| Variable | OR | 95% CI | P-value |
|---|---|---|---|
| Female versus male | 0.58 | 0.54–0.63 | <0.0001 |
| BMI (kg/m2) | |||
| 23–25 (reference) | 1.0 | – | – |
| <18.5 versus 23–25 | 0.08 | 0.04–0.16 | <0.0001 |
| <23 versus 23–25 | 0.43 | 0.37–0.50 | <0.0001 |
| ≥25–<30 versus 23–25 | 2.49 | 2.22–2.80 | <0.0001 |
| ≥30 versus 23–25 | 10.41 | 9.24–11.72 | <0.0001 |
| Cancer versus no cancer | 1.15 | 1.02–1.29 | 0.0245 |
| Vascular access at last point | – | – | – |
| AVF (reference) | 1.0 | – | – |
| Other vascular access versus AVF | 0.58 | 0.40–0.84 | <0.0001 |
| Tunnelled catheter versus AVF | 0.49 | 0.45–0.55 | <0.0001 |
| Graft versus AVF | 0.72 | 0.58–0.90 | <0.0001 |
| HD (reference) | 1.0 | – | – |
| Acetate-free biofiltration versus HD | 0.71 | 0.08–6.14 | – |
| Haemodiafiltration versus HD | 2.92 | 2.71–3.14 | <0.0001 |
| Haemofiltration versus HD | 3.82 | 1.95–7.46 | <0.0001 |
| Weekly duration of dialysis (h) | 4.54 | 3.99–5.17 | <0.0001 |
| Emergency start versus scheduled start | 0.87 | 0.80–0.94 | 0.0008 |
| eKt/V (reference) | 1.0 | – | |
| Method of measure ‘other’ versus eKt/V | 0.89 | 0.64–1.23 | – |
| Method of measure dKt/V versus eKt/V | 0.57 | 0.52–0.62 | <0.0001 |
| Method of measure spKt/V versus eKt/V | 1.43 | 1.30–1.58 | <0.0001 |
| Method of measure not available versus eKt/V | 0.90 | 0.80–1.01 | – |
dKt/V, ionic dialysance Kt/V.
The distribution of Kt/V measurement methods is described in Supplementary data, Table S3. Of the 32 383 Kt/V available, 9619 (29.70%) were measured by the double-pool method, 9201 (28.41%) by ionic dialysance and 6869 (21.21%) by spKt/V. The measurement method was missing for 6280 Kt/V. The ‘other’ group included the weekly clearances of urea or standard Kt/V in 414 patients (1.28%). After adjusting for confounders identified by the Cox model, the dose–effect on survival persisted regardless of the Kt/V measurement method. An interaction analysis using the Wald test found no significant differences among the measurement methods and survival (P = 0.408). The effect of Kt/V on survival was not different depending on the method of measurement of Kt/V.
In the DAG analysis, and after accounting for the link with serum albumin, emergency start, vascular access, gender, dialysis modality and duration, a monodirectional relationship between Kt and mortality was shown, implying that the model measures the effect of dialysis dose on mortality (Supplementary data, Figure S2). A DAG diagram including the measurement method of Kt found similar results, which suggests that this adjustment was not necessary for the predictive model (data not shown).
DISCUSSION
In this study we tested the hypothesis that the dialysis dose influences the survival of patients treated with HD three times a week. To quantify the dialysis dose, we compared the currently recommended Kt/V and its variants Kt and Kt/A. Regardless of the indicator studied, a high dose of dialysis was consistently associated with better survival and this effect was more pronounced with the indicator at the last point than with the averaged indicator during the follow-up. The survival differential according to Kt was the most discriminating, but marginally, compared with the survival differential according to Kt/V and Kt/A. The better performance of Kt as a dialysis dose indicator as suggested in this study is consistent with recent data in the literature [19, 24, 29], possibly because of the lack of approximation of the volume of distribution of urea [13, 30].
We further studied the determinants of survival besides the dialysis dose. Among the dialysis predictors, the protective factors against death were using an AVF rather than a tunnelled catheter or a graft, the scheduled start of dialysis compared with an emergency start and haemodiafiltration compared with HD. Several studies have shown a harmful effect of a central venous catheter versus an AVF, attributed to a higher risk of infection, clotting or bleeding [31, 32]. The emergency start of dialysis has also been described as having a negative impact on survival [33]. Haemodiafiltration appeared to increase patient survival, with a relative risk of mortality of 0.76 compared with HD, a figure comparable to a recent meta-analysis by Nubé et al. [34] when convection volume was >23 L/s.
Our results confirm that the delivered dialysis dose was associated with HD survival. Patient survival was better in the upper quartile of Kt (>69 L/s), then it quasi-linearly deteriorated as the Kt decreased beneath this threshold. The dialysis dose–effect was specific of mortality by cachexia, which was markedly reduced when Kt increased to >69 L/s. Survival differences according to Kt persisted after accounting for all confounders and kidney transplantation as a competing risk.
The evidence of a significant dose–effect relationship on survival in a contemporary dialysis cohort is quite challenging. Indeed, retrospective studies that suggested a beneficial effect of a high dialysis dose on survival are old. Some used the urea reduction rate as an indicator of dialysis dose and dialysis doses were generally well below the current practices [13–15, 35]. The only prospective study that demonstrated an impact of the dialysis dose on survival was the NCDS study that compared equivalent spKt/V between 0.80 and 1.0 [5], values now considered obsolete by current guidelines. The other prospective study, HEMO, and the international registry DOPPS I did not find any benefit of dialysis dose on survival, except in subgroups [6, 9–11], possibly because in these studies an equivalent weight was given to urea clearance (K) and dialysis duration (t), which is disputed [36].
In our work, the dose–effect on survival was quasi-linear up to a Kt of 69 L/s, with an apparent ceiling effect above this value. The dose–effect on survival was consistent for all six dialysis dose indicators studied but tended to lessen in the higher values. These results are reminiscent of studies reporting a survival curve according to Kt/V with an ‘inverted J’ shape [12, 37]. Two retrospective studies found no improvement or even a deleterious impact on survival when the Kt/V was >1.60. One of these studies [12] was challenged in a re-analysis attributing the excess mortality for Kt/V >1.60 to malnourished patients with an underestimation of the extracellular volume [38]. In our study, which was adjusted for serum albumin as a nutritional marker, we did not find any harmful effect associated with high dialysis doses; on the contrary, we saw an improvement in survival that persisted throughout the upper quartile of dialysis doses. The relationship between survival and dialysis dose appears asymptotic, although the ‘optimal’ dialysis dose, beyond which survival no longer improves, remains uncertain. Our data suggest the relevance of targeting a dialysis dose of 69 L based on Kt or 1.8 based on Kt/V.
We developed a predictive model of Kt in the upper quartile. Predictors for high Kt included an AVF versus catheters or grafts, haemodiafiltration versus HD, scheduled dialysis start versus an emergency start, long weekly dialysis duration and spKt/V measurement versus double-pool measurement. These data appear to be physiopathologically sound, as they can contribute to a higher dialysis dose. The spKt/V measurement method was also associated with a high dialysis dose. However, this relationship is probably artefactual due to the omission of the post-dialysis rebound in urea, in contrast to double pool, leading to an overestimate of the dialysis dose [4]. In any case, the description of this model is of direct clinical relevance by suggesting ways to improve the dialysis dose. Other factors that cannot be modified to predict a high Kt have been identified, including male gender, BMI >25 kg/m2 and cancer. In the literature, BMI was described as related to dialysis dose and survival [11, 39]. Finally, the reliability of this model was tested using a receiver operating characteristics curve with an AUC of 0.85. To our knowledge, there is currently no other model reported in the literature predicting a high dose of dialysis.
Our study has some strengths and limitations that should be kept in mind. Based on a nationwide registry, our contemporary cohort of incident HD patients has strong statistical power. The dose–effect relationship of the dialysis dose on survival was consistent across dialysis dose indexes (Kt/V, Kt and Kt/A) and persisted after adjusting for many potential confounding factors. Our analysis was also confirmed by a model of competing risk for kidney transplantation. Finally, we established a reliable predictive model of a high dose of dialysis that highlights the beneficial role of AVF as the vascular access, haemodiafiltration as the dialysis modality and longer weekly treatment time.
As with any observational study, we cannot exclude residual confounding and selection bias and therefore our results are only hypothesis generating and do not have the strength of a randomized trial. It is arguably difficult to imply a causal relationship between dialysis dose and mortality from an observational study. Patients with Kt in the lowest quartile tended to be older and less autonomous, a clinical profile that could focus on treatment options favouring patient comfort over dialysis performance . However, kidney transplantation incidence was similar in the four Kt groups, suggesting that the patients’ clinical pattern and management were relatively comparable across the Kt distribution.
Another limitation of the study is that the dialysis dose was quantified from a limited number of Kt/V values for each patient. This is an inherent limitation of our registry, as patient data, including dialysis parameters, were only collected at the end of the year. For some patients who died quickly, only one Kt/V value was available, whose representativeness is questionable. Paradoxically, the survival differential was wider with the last available Kt/V than with the averaged Kt/V during follow-up, suggesting that even short periods of inadequate dialysis may have an immediate impact on mortality. Indeed, deterioration of patient clinical conditions, predictive of increased mortality, may limit the ability to reach the target Kt/V (hypotension, vascular access, etc.). However, we carefully excluded the patients from analyses on a twice-weekly dialysis regimen at any time during the follow-up, as they are more likely to represent those patients on palliative dialysis. Furthermore, we did not find a clear relationship between dialysis session length and outcomes. Finally, analysis of the specific causes of death found a more marked reduction in cachexia associated with a high dose of dialysis, which is compatible with the old concept of urea as a proxy of uraemic toxins [40].
CONCLUSIONS
Our data suggest that HD survival is associated with the delivered dialysis dose, regardless of the indicator used. In our study, Kt appeared to be the most discriminating dialysis dose indicator of survival. We have established a model for predicting a high dose of dialysis, some factors of which are amendable. Further work is needed to confirm the relevance of Kt as a dialysis indicator and to explore the impact of different measurement methods on the dialysis dose.
SUPPLEMENTARY DATA
Supplementary data are available at ndt online.
FUNDING
This work was supported by the Agence de Biomédecine, Paris (Grant REIN 2018).
AUTHORS’ CONTRIBUTIONS
T.H., L.B., T.K. and C.C. conceived and/or designed the work that led to the submission and drafted and revised the manuscript. N.L., R.G. and C.C. acquired data and/or played an important role in interpreting the results. All authors approved the final version.
CONFLICT OF INTEREST STATEMENT
None of the authors declare any conflicts of interest.
DATA AVAILABILITY STATEMENT
Source data are available on request to the Scientific Council of the REIN registry.


Comments