


Abstract
Optimal parathyroid hormone (PTH) control during non-dialysis chronic kidney disease (ND-CKD) might decrease the subsequent risk of parathyroid hyperplasia and uncontrolled secondary hyperparathyroidism (SHPT) on dialysis. However, the evidence for recommending PTH targets and therapeutic strategies is weak for ND-CKD. We evaluated the patient characteristics, treatment patterns and PTH control over the first year of haemodialysis (HD) by PTH prior to HD initiation.
We studied 5683 incident HD patients from 21 countries in Dialysis Outcomes and Practice Patterns Study Phases 4–6 (2009–18). We stratified by PTH measured immediately prior to HD initiation and reported the monthly prescription prevalence of active vitamin D and calcimimetics over the first year of HD and risk of PTH >600 pg/mL after 9–12 months on HD.
The 16% of patients with PTH >600 pg/mL prior to HD initiation were more likely to be prescribed active vitamin D and calcimimetics during the first year of HD. The prevalence of PTH >600 pg/mL 9–12 months after start of HD was greater for patients who initiated HD with PTH >600 (29%) versus 150–300 (7%) pg/mL (adjusted risk difference: 19%; 95% confidence interval : 15%, 23%). The patients with sustained PTH >600 pg/mL after 9–12 months on HD were younger, more likely to be black, and had higher serum phosphorus and estimated glomerular filtration rates at HD initiation.
Increased PTH before HD start predicted a higher PTH level 9–12 months later, despite greater use of active vitamin D and calcimimetics. More targeted PTH control during ND-CKD may influence outcomes during HD, raising the need for PTH target guidelines in these patients.
INTRODUCTION
Chronic kidney disease (CKD) is associated with mineral and bone disorders (MBDs) that occur early in CKD and worsen during disease progression [1]. One of the hallmarks of CKD-MBD is secondary hyperparathyroidism (SHPT). The pathogenesis of SHPT is complex and only partly understood [2]. Several lines of evidence indicate that disturbed vitamin D metabolism and phosphate regulation, caused by increased serum levels of fibroblast growth factor 23 (FGF23), play an important role [3–5].
What is already known about this subject?
chronic kidney disease (CKD) is associated with mineral and bone disorders, such as secondary hyperparathyroidism (SHPT), that occur early in CKD and worsen during disease progression;
optimal parathyroid hormone (PTH) control during non-dialysis (ND)-CKD might decrease the subsequent risk of parathyroid hyperplasia and uncontrolled SHPT on dialysis; and
however, the evidence for recommending PTH targets and therapeutic strategies is weak for ND-CKD, and the extent that PTH levels in the non-dialysis phase might influence treatment patterns and the risk of SHPT during haemodialysis (HD) remains unknown.
What this study adds?
the 16% of patients with PTH >600 pg/mL prior to HD initiation were more likely to receive active vitamin D and calcimimetic therapy in the first year of HD;
the prevalence of high PTH (>600 pg/mL) 9–12 months after start of HD was much greater for patients who initiated HD with PTH >600 (29%) versus 150–300 (7%) pg/mL; and
PTH decreased towards recommended values following the start of HD in more than two-thirds of patients with prior-to-HD high PTH (>600 pg/mL), albeit at the expense of greater use of PTH-lowering medication.
What impact this may have on practice or policy?
more targeted PTH control during ND-CKD may influence outcomes during HD and potentially reduce the requirement for PTH-lowering medication during HD, though randomized trials are needed to confirm these results; and
these findings can help inform improved clinical management in ND-CKD, including raising the need for PTH target guidelines in these patients and providing insight into cost drivers for PTH management in HD.
During CKD, strategies to control SHPT range from the use of calcium supplements, intestinal phosphate binders, native vitamin D supplementation and the reduction of dietary phosphate intake [19]. Other therapies utilized in CKD with progression of SHPT include active vitamin D analogues. Their efficacy in PTH control is counterbalanced by potential hypercalcaemia and hyperphosphataemia, calling into question their risk–benefit profile in non-dialysis (ND)-CKD. Both active vitamin D analogues and calcimimetics are used in ESKD, and sometimes surgical parathyroidectomy (PTX) is also required to correct SHPT [20]. However, all of these treatments have potential adverse effects and thus represent imperfect therapies [21, 22]. Furthermore, some component of the PTH increase during CKD is an adaptive mechanism that is necessary to maintain phosphate balance, overcome the skeletal resistance to PTH in order to maintain appropriate bone remodelling and avoid complications such as low bone turnover disease and adynamic bone [23, 24]. It has also been shown that low PTH levels (less than twice the upper limit of normal values) in patients with ESKD were associated with higher mortality risk [25]. Consistently, during dialysis, current guidelines recommend maintaining PTH levels as much as 2- to 9-fold above the normal range in order to maintain this adaptive process [1].
Whereas recommendations are available for haemodialysis (HD) patients, no such guidelines are currently available for patients with CKD Stages 3–5, with regard to PTH targets and therapeutic strategies, mainly due to a lack of clinical trial results. The 2003 KDOQI guidelines recommended maintaining PTH levels in the normal ranges in ND-CKD, and <300 pg/mL in CKD Stage 5D, with no clear evidence of a benefit [26]. Yet, standard care and treatment are all the more crucial as earlier PTH suppression might decrease the risk of uncontrolled SHPT because of important parathyroid gland hyperplasia, hypertrophy and monoclonal growth transformation [27, 28]. Consequently, better PTH control in the pre-ESKD phases of CKD may improve eventual outcomes, but few clinical studies have assessed the benefit of such management. Moreover, to what extent the level of PTH in the pre-ESKD phase might influence treatment patterns and the risk of SHPT during HD remains unknown.
Thus, we evaluated patients’ characteristics, treatment patterns and PTH control according to the PTH levels prior to HD initiation. We also evaluated factors that could influence a sustained high PTH level 1 year after HD initiation.
MATERIALS AND METHODS
Data source
Data were obtained from the Dialysis Outcomes and Practice Patterns Study (DOPPS), an international, multiphase prospective cohort study of patients ≥18 years treated with in-centre HD in 21 countries. Maintenance HD patients were randomly selected from national samples of HD facilities in each country; detailed information is included in prior publications [29, 30] and at http://www.dopps.org. Study approval and patient consent were obtained as required by national and local ethics committee regulations. The analysis was based on DOPPS Phase 4 (2009–11), Phase 5 (2012–15) and Phase 6 (2015–18), and included patients from all 21 countries.
Variables
The primary exposure is PTH measured immediately prior to initiating HD, which served as a partial proxy for management of SHPT during advanced-stage ND-CKD. In 345 US facilities participating in an electronic health record transfer to DOPPS, PTH value immediately prior to HD start is defined as the most recent PTH level from 0 to 45 days prior to HD start. In facilities completing data collection through online questionnaires (57 US facilities plus all 503 non-US facilities), this PTH value is the response to the question ‘Please report the values of the following labs immediately before the start of chronic dialysis’, where the meaning of ‘immediately’ is at the discretion of the study coordinator. This question was only asked if patients enrolled in DOPPS within 120 days after initiating HD.
Information on patient demographics and comorbidity history was abstracted from medical records at DOPPS enrollment in each phase. Monthly data on measured laboratory values and medication prescriptions were abstracted from medical records at baseline and during follow-up. Outcomes included prescription (yes/no) of PTH-lowering medications (i.e. active vitamin D and calcimimetics) over the first year of HD and risk of high PTH (>600 pg/mL) 9–12 months after HD initiation (first available measurement after 9 months but before 12 months); we allowed for a 3-month ascertainment window because some HD facilities only routinely measure PTH every 3 months.
Inclusion/exclusion criteria
Incident HD patients who enrolled in DOPPS within 120 days after initiating HD and who had not previously undergone a PTX were included. We excluded patients (71%) who were missing the exposure variable (i.e. no PTH value available immediately prior to HD initiation). Included and excluded patients had a similar mean age, similar PTH levels in the first 4 months after HD initiation and a similar prevalence of comorbidity history. Included patients were more likely to have received >6 months of pre-ESKD nephrologist care and were less likely to be dialysing with a catheter at DOPPS enrolment (Supplementary data, Table S1).
The analysis of PTH 9–12 months after HD initiation required further exclusion of patients who died, received a kidney transplant, switched modalities, transferred facilities or for whom the outcome variable could otherwise not be defined. See Figure 1 for a full description of the reasons for exclusion.
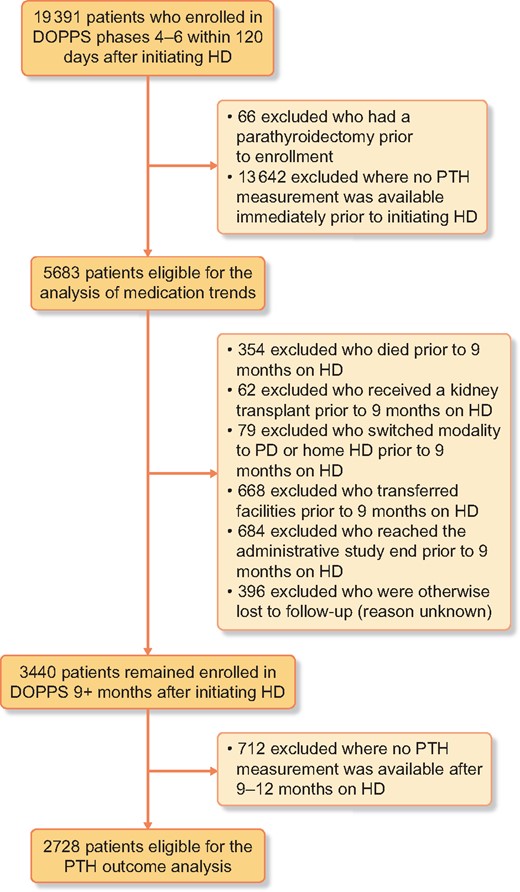
Flow chart of patient inclusion/exclusion criteria. PD, peritoneal dialysis.
Statistical analyses
We first summarized the distribution of PTH immediately prior to HD initiation by country and compared patient characteristics across PTH categories. CKD-MBD parameters and treatments were summarized at HD initiation and 9–12 months later. To assess the intensity of PTH-lowering therapies during the first year of HD, we reported the proportion of patients prescribed active vitamin D and calcimimetic in each month by PTH level immediately prior to HD initiation.
We used linear probability models to estimate the risk of high PTH (>600 pg/mL) 9–12 months after HD initiation for each PTH category immediately prior to HD start. Adjusted risk differences were reported for each category of PTH prior to HD start, compared with the reference level of PTH 150–300 pg/mL prior to HD start. Models used a random facility intercept to account for clustering and were progressively adjusted for potential confounders to evaluate the impact of each set of covariates on the estimated association.
We performed a subgroup analysis among patients with PTH >600 pg/mL immediately prior to HD initiation. We compared patient characteristics for those who remained >600 pg/mL versus those who experienced a decrease to <600 pg/mL. A similar linear probability model was used to identify predictors of PTH >600 pg/mL 9–12 months after HD initiation.
We used multiple imputation, assuming data were missing at random, to derive missing covariate values using the Sequential Regression Multiple Imputation Method by IVEware [31]. Results from 20 such imputed data sets were combined for the final analysis using Rubin’s formula [32]. The proportion of missing data was <8% for all covariates. All analyses were conducted using SAS software, version 9.4 (SAS Institute, Cary, NC, USA).
RESULTS
Descriptive analyses
The distribution of PTH immediately prior to HD initiation is shown in Table 1 and by country in Figure 2; 16% of the 5683 patients initiated HD with PTH >600 pg/mL. Countries with over 20% of patients initiating HD with PTH >600 pg/mL included Russia (25%), Gulf Cooperation Council (GCC) countries (22%) and the UK (21%). Countries with fewer than 10% of patients initiating HD with PTH >600 pg/mL included China (4%), Japan (7%), Belgium (9%) and Spain (9%).
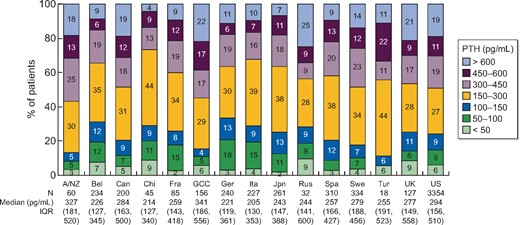
PTH immediately prior to HD initiation, by country. A/NZ, Australia/New Zealand; Bel, Belgium; Can, Canada; Chi, China; Fra, France; GCC, Gulf Cooperation Council countries (Bahrain, Kuwait, Oman, Qatar, Saudi Arabia, United Arab Emirates); Ger, Germany; Ita, Italy; Jpn, Japan; Rus, Russia; Spa, Spain; Swe, Sweden; Tur, Turkey; UK, United Kingdom; US, United States; IQR, interquartile range.
Patient characteristics by PTH immediately prior to HD initiation
| PTH (pg/mL) immediately prior to HD start | |||||||
|---|---|---|---|---|---|---|---|
| Patient characteristics | <50 | 50–100 | 100–150 | 150–300 | 300–450 | 450–600 | >600 |
| Patients, n (%) | 298 (5) | 523 (9) | 538 (9) | 1709 (30) | 1065 (19) | 619 (11) | 931 (16) |
| Demographics | |||||||
| Age (years) | 66.9 ± 13.6 | 67.8 ± 13.8 | 67.8 ± 14.2 | 66.0 ± 14.2 | 64.2 ± 14.5 | 62.6 ± 14.5 | 60.3 ± 15.4 |
| Gender (% male) | 55 | 55 | 61 | 62 | 63 | 60 | 58 |
| Race (% black) | 13 | 9 | 10 | 11 | 15 | 17 | 29 |
| BMI (kg/m2) | 28.0 ± 7.2 | 27.0 ± 6.8 | 27.6 ± 7.0 | 27.7 ± 6.9 | 28.2 ± 6.6 | 28.3 ± 7.0 | 28.8 ± 7.1 |
| Pre-dialysis characteristics | |||||||
| PTH (pg/mL) | 29 (23–41) | 76 (65–88) | 126 (112–139) | 220 (183–256) | 366 (331–405) | 513 (477–551) | 848 (700–1137) |
| Serum phosphorus (mg/dL) | 4.9 ± 1.6 | 4.8 ± 1.7 | 4.9 ± 1.6 | 5.2 ± 1.7 | 5.5 ± 1.9 | 5.6 ± 1.9 | 6.0 ± 2.1 |
| Serum albumin (g/dL) | 3.4 ± 0.6 | 3.5 ± 0.6 | 3.4 ± 0.6 | 3.4 ± 0.6 | 3.4 ± 0.6 | 3.4 ± 0.6 | 3.5 ± 0.5 |
| Haemoglobin (g/dL) | 9.9 ± 1.6 | 9.9 ± 1.5 | 10.0 ± 1.5 | 9.8 ± 1.4 | 9.7 ± 1.5 | 9.7 ± 1.5 | 9.5 ± 1.5 |
| GFR (mL/min/1.73m2) | 9.4 ± 4.6 | 10.0 ± 4.3 | 9.9 ± 4.0 | 9.3 ± 4.0 | 8.7 ± 3.9 | 8.3 ± 3.5 | 8.6 ± 4.9 |
| >6 months pre-ESKD care (%) | 74 | 69 | 75 | 69 | 75 | 74 | 69 |
| Cause of ESRD | |||||||
| Diabetes | 38 | 38 | 41 | 44 | 45 | 47 | 40 |
| Hypertension | 28 | 22 | 27 | 25 | 24 | 22 | 26 |
| Glomerulonephritis, Vasculitis | 9 | 12 | 11 | 11 | 11 | 11 | 11 |
| Other | 25 | 28 | 21 | 21 | 20 | 21 | 23 |
| Dialysis characteristics | |||||||
| PTH (pg/mL) | 65 (29–152) | 89 (65–151) | 133 (105–177) | 216 (156–277) | 333 (223–422) | 456 (288–540) | 618 (366–872) |
| Serum phosphorus (mg/dL) | 4.6 ± 1.4 | 4.7 ± 1.5 | 4.7 ± 1.3 | 4.8 ± 1.4 | 5.0 ± 1.5 | 5.2 ± 1.5 | 5.3 ± 1.6 |
| Serum albumin (g/dL) | 3.5 ± 0.5 | 3.5 ± 0.6 | 3.5 ± 0.5 | 3.5 ± 0.5 | 3.5 ± 0.5 | 3.6 ± 0.5 | 3.6 ± 0.5 |
| Haemoglobin (g/dL) | 10.5 ± 1.5 | 10.5 ± 1.4 | 10.7 ± 1.4 | 10.6 ± 1.4 | 10.7 ± 1.5 | 10.6 ± 1.5 | 10.6 ± 1.5 |
| 25(OH)D (ng/mL) | 26.4 ± 12.4 | 24.5 ± 14.4 | 25.2 ± 13.2 | 23.6 ± 18.9 | 23.9 ± 12.4 | 21.3 ± 14.5 | 19.6 ± 11.7 |
| Alkaline phosphatase (U/L) | 78 (62–109) | 78 (62–115) | 81 (63–108) | 83 (66–116) | 84 (66–108) | 84 (68–113) | 91 (69–125) |
| Serum calcium (mg/dL) | 9.1 ± 0.8 | 9.0 ± 0.8 | 8.9 ± 0.7 | 8.7 ± 0.7 | 8.7 ± 0.7 | 8.7 ± 0.8 | 8.8 ± 0.8 |
| Dialysate calcium (mEq/L) | 2.6 ± 0.3 | 2.6 ± 0.3 | 2.6 ± 0.3 | 2.6 ± 0.3 | 2.6 ± 0.3 | 2.6 ± 0.3 | 2.6 ± 0.3 |
| Catheter use (%) | 57 | 50 | 49 | 52 | 53 | 54 | 61 |
| Comorbid conditions (%) | |||||||
| Coronary artery disease | 21 | 25 | 28 | 26 | 25 | 23 | 18 |
| Congestive heart failure | 19 | 23 | 23 | 24 | 21 | 23 | 19 |
| Cerebrovascular disease | 8 | 10 | 9 | 10 | 9 | 8 | 8 |
| Peripheral vascular disease | 12 | 15 | 18 | 18 | 15 | 17 | 12 |
| Other cardiovascular disease | 16 | 20 | 22 | 21 | 18 | 16 | 13 |
| Cancer | 14 | 15 | 11 | 12 | 10 | 8 | 8 |
| Diabetes | 52 | 54 | 56 | 57 | 59 | 61 | 54 |
| Gastrointestinal bleeding | 2 | 4 | 2 | 3 | 2 | 2 | 2 |
| Hypertension | 76 | 77 | 80 | 83 | 82 | 84 | 83 |
| Lung disease | 12 | 11 | 12 | 10 | 12 | 9 | 6 |
| Neurologic disease | 5 | 8 | 6 | 7 | 5 | 6 | 5 |
| Psychiatric disorder | 18 | 17 | 19 | 16 | 13 | 13 | 13 |
| Recurrent cellulitis, gangrene | 4 | 3 | 4 | 5 | 4 | 5 | 3 |
Values are shown as mean ± standard deviation, median (interquartile range) or %. Pre-dialysis characteristics: measured immediately prior to HD initiation; dialysis characteristics: measured at DOPPS enrolment, 0–4 months after HD initiation; cancer excludes non-melanoma skin cancers. BMI, body mass index.
Patient characteristics by PTH immediately prior to HD initiation are shown in Table 1. Compared with PTH 150–300 pg/mL, patients who initiated HD with PTH >600 pg/mL on average had higher serum phosphate and total alkaline phosphatase, lower serum 25-OH vitamin D [25(OH)D] levels [among 782 patients with 25(OH)D data], were younger, more likely to be black, more likely dialysing with a catheter at the time of HD initiation and had a lower prevalence of some cardiovascular comorbidities, including coronary artery disease, peripheral vascular disease and other cardiovascular diseases. Dialysate calcium at the time of dialysis initiation was comparable across the PTH strata. Of note, the underlying nephropathy did not differ through all the PTH strata.
In Table 2, we summarize CKD-MBD parameters and therapies at HD initiation and 9–12 months later. Nearly 1 year after HD initiation, levels of serum phosphorus, serum calcium and 25-OH vitamin D were slightly higher, and levels of PTH and alkaline phosphatase were mostly unchanged. The prescription of some therapies, including dialysate calcium, oral active vitamin D and oral nutritional vitamin D, did not change over the first year of HD; in contrast, the use of phosphate binders, calcimimetics and intravenous (IV) vitamin D increased.
MBD parameters and therapies: changes over the first year of dialysis
| Timing of measurement | |||
|---|---|---|---|
| Patient characteristics | Immediately prior to HD initiation | First month after HD initiation | 9–12 months after HD initiation |
| CKD-MBD parameters | |||
| PTH (pg/mL) | 275 (155–472) | 253 (143–435) | 253 (148–409) |
| Serum phosphorus (mg/dL) | 5.3 ± 1.8 | 4.9 ± 1.5 | 5.1 ± 1.5 |
| Serum calcium (mg/dL) | N/A | 8.8 ± 0.8 | 9.0 ± 0.7 |
| 25(OH)D (ng/mL) | N/A | 23.7 ± 16.4 | 27.2 ± 13.0 |
| Alkaline phosphatase (U/L) | N/A | 83 (65–115) | 85 (66–116) |
| CKD-MBD therapies | |||
| Dialysate calcium (mEq/L) | N/A | 2.6 ± 0.3 | 2.6 ± 0.3 |
| Phosphate binder, any (%) | N/A | 53 | 78 |
| Ca-based (%) | N/A | 35 | 45 |
| Non-Ca based (%) | N/A | 18 | 33 |
| Calcimimetic (%) | N/A | 3 | 8 |
| Active vitamin D, any (%) | N/A | 48 | 62 |
| IV (%) | N/A | 18 | 35 |
| Oral (%) | N/A | 33 | 30 |
| Oral nutritional vitamin D (%) | N/A | 20 | 23 |
Values are shown as mean ± standard deviation, median (interquartile range) or %; N/A: not available, as information on treatments (and most laboratory values) prior to HD initiation was not collected in DOPPS.
PTH-lowering medication use
Prescription of PTH-lowering medications over the first year of HD, by PTH immediately prior to HD start, is shown in Figure 3. Active vitamin D (IV or oral) prescription in the first month of HD was 31–42% among patients with PTH <300 pg/mL, and progressively higher with increasing PTH, to 67% among patients who initiated HD with PTH >600 pg/mL. These proportions generally increased throughout the first year of HD (Figure 3A). The prevalence of calcimimetic prescription in the first month of HD was <3% in all PTH groups except for PTH >600 pg/mL (7%) (Figure 3B). In contrast to active vitamin D, calcimimetic use showed large variation across PTH strata over the first year of HD. Calcimimetic use in the first year of HD increased considerably to 23% among patients who initiated HD with PTH >600 pg/mL and to 12% in the 450–600 pg/mL group. Calcimimetic use remained <10% in all other PTH groups. After 12 months on HD, active vitamin D use was highest in Sweden (81%), Japan (70%) and the USA (70%), while calcimimetic use was highest in the GCC (24%), Spain (14%) and the USA (11%).

Prescription of (A) active vitamin D (IV or oral) and (B) calcimimetics over the first year of HD, by PTH prior to HD start. Proportion of patients prescribed medication in each month, stratified by PTH at HD start (i.e. patients remain in same group throughout 12 months), is displayed.
Risk of high PTH after 9 months on dialysis
The correlation between PTH measured immediately prior to HD initiation and 9–12 months after HD initiation is illustrated in Figure 4. The risk of PTH >600 pg/mL 9–12 months after HD initiation was 29% among patients who initiated HD with PTH >600 pg/mL, compared with only 7% for patients who initiated HD with PTH 150–300 pg/mL. In adjusted models, we observed that this association remained strong after accounting for potential confounders (Table 3). The unadjusted risk difference [95% confidence interval (95% CI)] for PTH >600 versus 150–300 pg/mL shown in Table 3, Model 1 was 22% (19%, 25%), reflective of the 22-point difference between the 29% and 7% risk of PTH >600 pg/mL 9–12 months after initiating HD illustrated in Figure 4. After progressively adding many potential confounders to the model, the adjusted risk difference (95% CI) shown in Table 3, Model 6 was 19% (15%, 23%), demonstrating a robust association. PTH levels > 600 pg/mL prior to HD initiation thus independently predicted sustained high PTH levels 9–12 months later.
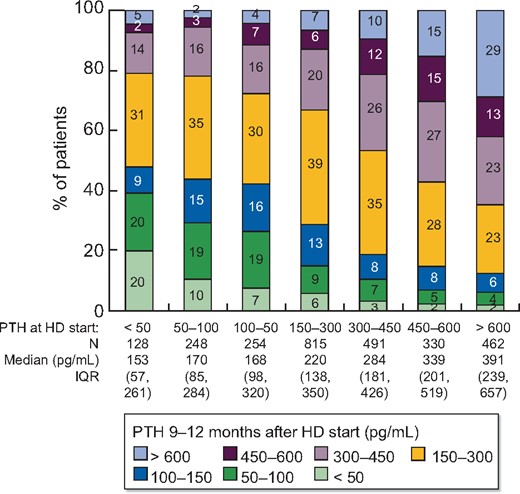
Distribution of PTH at 9–12 months after HD start, by PTH immediately prior to HD start. IQR, interquartile range.
Adjusted risk difference (95% CI) of PTH >600 pg/mL 9–12 months after HD initiation
| Model 1 | Model 2 | Model 3 | Model 4 | Model 5 | ||
|---|---|---|---|---|---|---|
| n (%) | Unadjusted | + Region, phase | + Age, sex, black race | + 13 summary comorbidities | + Albumin, Hgb, catheter, BMI | |
| PTH prior to HD start (pg/mL) | ||||||
| <50 | 128 (5) | −2.6 (−8.2, 3.1) | −3.5 (−9.1, 2.2) | −2.7 (−8.3, 2.9) | −2.8 (−8.4, 2.8) | −2.7 (−8.4, 2.9) |
| 50–100 | 248 (9) | −3.9 (−8.3, 0.4) | −3.9 (−8.2, 0.4) | −3.8 (−8.1, 0.4) | −3.9 (−8.1, 0.4) | −4.0 (−8.3, 0.3) |
| 100–150 | 254 (9) | −2.3 (−6.5, 2.0) | −2.5 (−6.7, 1.8) | −2.1 (−6.3, 2.2) | −2.3 (−6.6, 1.9) | −2.4 (−6.7, 1.8) |
| 150–300 | 815 (30) | 0 (Ref.) | 0 (Ref.) | 0 (Ref.) | 0 (Ref.) | 0 (Ref.) |
| 300–450 | 491 (18) | 2.8 (−0.5, 6.2) | 2.8 (−0.6, 6.2) | 2.1 (−1.3, 5.4) | 2.1 (−1.3, 5.5) | 2.2 (−1.2, 5.6) |
| 450–600 | 330 (12) | 8.6 (4.7, 12.4) | 8.2 (4.4, 12.1) | 7.1 (3.3, 11.0) | 7.2 (3.3, 11.0) | 7.2 (3.4, 11.1) |
| >600 | 462 (17) | 21.9 (18.5, 25.4) | 21.4 (17.9, 24.9) | 19.0 (15.4, 22.5) | 19.0 (15.4, 22.5) | 19.2 (15.6, 22.8) |
Linear probability models, using a random facility intercept to account for clustering. Adjusted difference in the probability (shown as percentage) of PTH >600 pg/mL at 9−12 months after HD initiation estimated across levels of PTH measured immediately prior to HD initiation (reference: PTH 150–300 pg/mL immediately prior to HD initiation). In other words, the absolute risk of a PTH >600 pg/mL at 9–12 months was 19 percentage points higher for patients with a baseline PTH >600 pg/mL versus the reference group of baseline PTH 150–300 pg/mL (absolute risk in reference group: 7%). Hgb, haemoglobin; BMI, body mass index.
Subgroup analysis: Initiating dialysis with PTH >600 pg/mL
Among the 931 patients who had PTH >600 pg/mL immediately prior to HD initiation, 469 (50%) did not have a PTH measurement 9–12 months after HD initiation, due to death, censoring or missing data. Of the remaining 462 patients with a PTH measurement, 134 (29%) had PTH that remained >600 pg/mL and 328 (71%) experienced a PTH decrease to <600 pg/mL. The patients who remained in the PTH >600 pg/mL group tended to be younger, were more likely to be black, had higher serum phosphorus, slightly higher total alkaline phosphatase levels, higher glomerular filtration rate (GFR) at HD initiation and had a lower prevalence of diabetes; full patient characteristics are shown in Supplementary data, Table S2. Results from an adjusted regression model are detailed in Supplementary data, Table S3 and identified black race as a predictor of sustained PTH >600 pg/mL; however, the sample size of this subgroup analysis limited our ability to detect other potential predictors.
DISCUSSION
Our study showed that PTH levels prior to HD initiation predicted PTH levels and therapeutic strategies during the first year of HD. High PTH during CKD prior to HD initiation was a major risk factor of having PTH levels above the KDIGO recommended target ranges during HD. These patients were more likely to be black, have higher serum phosphate levels and to receive active vitamin D and calcimimetic therapy in the first year of HD. PTH decreased towards recommended values following the start of HD in more than two-thirds of patients with prior-to-HD high PTH (>600 pg/mL), albeit at the expense of greater use of PTH-lowering medication (Figure 3).
During CKD, PTH levels tend to progressively increase and may reach very high levels in the late stages of CKD [13]. This is supported by our data showing that mean estimated GFR (eGFR) levels were lower in patients who initiated HD with higher PTH levels. Relative vitamin D deficiency, underproduction of 1,25 vitamin D due to insufficient 1-α-hydroxylation, mostly attributable to FGF23 increase and to nephron number reduction in late-stage CKD, as well as hyperphosphataemia, contribute to this increase in PTH [33]. Elevated PTH is a consequence of these pathophysiological processes. Part of the PTH response could be adaptive in an effort to increase serum calcium levels, lower serum phosphate levels or stimulate bone remodelling by overcoming the skeletal hyporesponsiveness to PTH, while excess levels are probably maladaptive [34, 35].
Indeed, studies have shown that higher PTH levels are associated with adverse outcomes such as skeletal fractures, cardiovascular events and mortality, among CKD and HD patients [18]. Interestingly, very low levels of PTH are also associated with higher risk of mortality, supporting the view of a U-shaped relationship and that an adaptive moderate rise in PTH level is necessary to cope with CKD-related changes [25].
Individualized patient management of PTH is recommended with a goal to prevent deviations outside the broad target range of two to nine times the upper limit of the normal for the assay in HD patients, in order to avoid adynamic bone disease, on one hand, and to avoid excessive bone remodelling, on the other [1]. In ND-CKD patients, no optimal target levels are available, even considering the deleterious association between high PTH levels and adverse outcomes. Moreover, in this population, active vitamin D treatment is no longer recommended in the 2017 updated KDIGO guidelines [36], in contrast to the 2009 guidelines [37]. The rationale for this new recommendation is that both the PRIMO and the OPERA trials, while showing an increased risk of hypercalcaemia, failed to demonstrate a benefit in left ventricular mass decrease, which was the primary endpoint [38, 39]. Nonetheless, it is interesting to observe that in both studies, enrolled patients had mild SHPT and that PTH was effectively lowered by the treatment.
Current practices might thus vary sharply according to the practitioner and the care centre. Further studies are needed to evaluate a threshold of PTH above which adverse outcomes appear. Furthermore, interventional studies are needed in order to determine a causal relationship between PTH lowering and outcomes improvement.
In this study, a substantial proportion of patients (16%) had PTH levels >600 pg/mL prior to HD initiation. These patients were younger, more frequently black and had higher serum phosphate. These observations were not related to late referral ESKD, as shown by the same proportion of patients receiving pre-ESKD care for >6 months. Hyperphosphataemia is also more frequent in these younger patients, possibly explaining this association. According to previous results, bone and mineral pathophysiology differ in black patients, possibly explaining higher levels of PTH [40]. Of note, PTH levels did not statistically differ between underlying nephropathies. Although previous studies have shown that patients with diabetes on HD had lower PTH levels along with lower serum calcium [41], these findings have not been confirmed in more recent studies [42]. This might be explained by improved HD methods and diabetes care.
Analysis of the treatment patterns during the first year of HD revealed that a high proportion of patients were treated with active vitamin D, especially in patients with elevated PTH levels. Of note, this proportion increased substantially during the first 2 months in the upper PTH strata, and then remained stable over the first year. Calcimimetic drugs were administered infrequently (≤2%) at the start of HD for patients with PTH <600 pg/mL, and slightly more often when PTH levels were >600 pg/mL (6%). The prescription of calcimimetics increased to 24% at 1 year among patients who initiated HD with PTH >600 pg/mL, and increased in other PTH strata as well, but to a far lesser extent.
Current guidelines recommend active vitamin D prescription and calcimimetics in order to maintain PTH levels in the recommended ranges in HD patients. In real life, observational studies showed that calcimimetic prescription is less than expected, and that treatment can be challenging to achieve and to maintain in the long term, partly due to gastrointestinal intolerance [43]. Moreover, reimbursement criteria do not necessarily match with guidelines, and local committees (such as in Sweden and Australia) may not recommend calcimimetic use except in patients at high risk, due to the inconclusive results of the EVOLVE (EValuation Of Cinacalcet Hydrochloride Therapy to Lower CardioVascular Events) trial [44]. Treatment adherence may potentially be improved in the future by newer intravenous calcimimetics [45] and by oral calcimimetics with fewer gastrointestinal adverse events [46] available in some countries.
Our study interestingly showed that among patients with PTH levels >600 pg/mL prior to HD initiation, treatment reduced PTH to <600 pg/mL in 71% of them, demonstrating the control of SHPT within the target ranges in most patients. This observation might be explained by the correction of numerous metabolic alterations by dialysis therapy, pharmacologic treatments and more careful monitoring on HD with better follow-up and control of biological parameters.
Despite the care provided at HD initiation, the proportion of patients whose PTH remained >600 pg/mL at 9–12 months post-HD initiation remained substantial. We studied this population in order to evaluate factors predicting a PTH level >600 pg/mL at 1 year. We found a higher serum phosphate level prior to HD initiation as well as at 9–12 months in this population compared with those who lowered their PTH level. Consistent with previous literature, we also found lower serum 25(OH)D levels in the population with PTH >600 pg/mL at HD start. However, treatment with oral nutritional vitamin D appeared to be unchanged over the first year of HD, in compliance with guidelines that do not recommend treatment of SHPT with native vitamin D in routine practice [36]. This result should be highlighted as increased circulating levels of 25(OH)D contribute to a better control of PTH levels [47–49].
In addition to black race being associated with PTH levels >600 pg/mL prior to HD initiation, black patients were also at a higher risk of having sustained high PTH levels. Previous literature has reported higher PTH values in black patients [40], possibly related to lower vitamin D levels in this population due to differential vitamin D metabolism and synthesis [50]. There was minimal difference in serum calcium level at 9–12 months for patients whose high PTH was sustained versus not sustained. Of note, eGFR at HD initiation was higher in patients with sustained PTH level > 600 pg/mL, with the same rate of late nephrologist referral. Finally, the rate of catheter use at 9–12 months was higher in patients who displayed a sustained PTH level > 600 pg/mL. One could hypothesize that catheter use at 9–12 months might be due to suboptimal pre-ESKD care (which could be due to the patient, the care provider or system factors) or more challenging vascular biology.
Our study has some limitations. First, only 29% of DOPPS incident HD patients had a PTH measurement prior to HD initiation. This observation reflects clinical practice even though KDIGO guidelines recommend regular PTH level monitoring starting in CKD Stage 3. Either way, we compared patients’ characteristics in the studied sample and in the general DOPPS cohort and found no significant difference between the two populations. Another limitation was that PTH assay was not standardized throughout the recruiting centres. Indeed, PTH values from different assays might vary. Also, repeat measurements might be performed by different assays [51]. The international recruitment accounts for variable PTH assays. A noteworthy point is that our study focuses on very high PTH levels, >600 pg/mL, rather than mild variations that could be biased by the variability of the assays [20]. Moreover, previous DOPPS analyses found similar results with normalization to the upper limit of normal for each site’s assay compared with absolute values, probably because average levels are evaluated across the population. Another limitation is that information on treatment with active vitamin D prior to HD initiation was not available, and so we cannot know the extent to which PTH levels measured at HD start were treated. Furthermore, 25(OH)D levels were reported in only 14% of patients, and so inferences based on these ancillary analyses are limited.
In conclusion, increased levels of PTH before HD start predicted a sustained increased PTH level at 1 year. There was also a correlation between increased PTH levels before HD start and greater medication prescriptions during the first year of dialysis. These findings can help inform improved clinical management in ND-CKD and provide insight into cost drivers for PTH management in HD.
Prospective clinical trials are needed to confirm that improved PTH control prior to the start of dialysis improves the control of SHPT during the first year of dialysis and reduces the need for PTH-lowering medication. In light of our observations, earlier control of PTH and bone and mineral parameters may influence outcomes during HD and potentially reduce the requirement for PTH-lowering medication during dialysis.
SUPPLEMENTARY DATA
Supplementary data are available at ndt online.
ACKNOWLEDGEMENTS
Jennifer McCready-Maynes, an employee of Arbor Research Collaborative for Health, provided editorial support for this paper.
FUNDING
Global support for the ongoing DOPPS Programs is provided without restriction on publications by a variety of funders. For details, see https://www.dopps.org/AboutUs/Support.aspx. This manuscript was directly supported by Vifor.
AUTHORS’ CONTRIBUTIONS
Conception or design, or analysis and interpretation of data, or both was performed by A.K., P.-A.U.-T., D.M.S., M.F., P.A.C., B.M.R., E.W.Y., N.T. and R.L.P. A.K., P.-A.U.-T., D.M.S., S.H.J., P.A.C., P.E., B.M.R., I.A.S., E.W.Y., N.T. and R.L.P. contributed to drafting the article or revising it. A.K., P.-A.U.-T., D.M.S., S.H.J., M.F., P.A.C., P.E., B.M.R., I.A.S., E.W.Y., N.T., X.L. and R.L.P. provided intellectual content of critical importance to the work described. A.K., P.-A.U.-T., D.M.S., S.H.J., M.F., P.A.C., P.E. B.M.R., I.A.S, E.W.Y., N.T., X.L. and R.L.P. approved the final manuscript version to be published.
CONFLICT OF INTEREST STATEMENT
N.T., I.A.S., X.L., S.H.J. and D.M.S. have nothing to disclose. P.A.C. reports other support from Vifor Pharma during the conduct of the study and other from Vifor Pharma outside the submitted work; P.E. reports grants and personal fees from Amgen, personal fees from Vifor-FMC and grants from Sanofi during the conduct of the study; P.-A.U.-T. reports personal fees from Amgen, other from Astellas, other from GSK, other from Hemotech, personal fees from Leo Pharma and personal fees from Genzyme Sanofi outside the submitted work; M.F. reports grants and personal fees from Kyowa Kirin, personal fees from Ono Pharmaceutical, personal fees from Bayer Japan, personal fees from Torii, personal fees from Fresenius Kabi and personal fees from Kissei outside the submitted work. A.K., R.L.P., E.W.Y. and B.M.R. are employees of Arbor Research Collaborative for Health which administers the DOPPS. For details, see https://www.dopps.org/AboutUs/Support.aspx. This manuscript was directly supported by Vifor. The results presented in this paper have not been published previously in whole or part, except in abstract form.
REFERENCES
NKF KDOQI Guidelines [Internet] [cited 2020 Feb 13]. http://kidneyfoundation.cachefly.net/professionals/KDOQI/guidelines_bone/index.htm
Multiple Imputation in Practice: With Examples Using IVEware [Internet]. CRC Press [cited 2019 Oct 8]. https://www.crcpress.com/Multiple-Imputation-in-Practice-With-Examples-Using-IVEware/Raghunathan-Solenberger-Berglund/p/book/9781498770163
Statistical Analysis with Missing Data, 2nd edn | Bayesian Analysis | General & Introductory Statistics | Subjects | Wiley [Internet]. Wiley.com [cited 2019 Oct 8]. https://www.wiley.com/en-us/Statistical+Analysis+with+Missing+Data%2C+2nd+Edition-p-9780471183860
Kidney Disease: Improving Global Outcomes (KDIGO) CKD-MBD Work Group.


Comments