


Abstract
Management of potassium disorders in patients on haemodialysis (HD) is complex. We studied prescription patterns of dialysate potassium and potassium binders, and their associations with patient survival.
This national registry-based study included 25 629 incident adult patients alive after 3 months of HD from 2010 through 2013 and followed-up through 31 December 2014. We used Cox proportional hazard models to estimate multiadjusted mortality hazard ratios (HRs) associated with time-dependent exposure to facility-level dialysate potassium concentrations and patient-level potassium binder exposure.
Almost all dialysis units used, and generally most often, dialysate potassium concentrations of 2 mmol/L. During this period, use of concentrations <2 mmol/L tended to decrease and those ≥3 mmol/L to increase. In 2014, 9% of units used a single dialysate formula, 41% used two and 50% three or more. The most frequent combinations were 2 and 3 mmol/L (40%), and <2, 2 and 3 mmol/L (37%). Compared with patients on HD in units using only one dialysate formula, those in units using two or three had adjusted mortality HRs of 0.91 [95% confidence interval (CI) 0.82–1.01] and 0.84 (0.75–0.93), respectively. Potassium binders were prescribed for 37% of all patients at baseline. Adjusted mortality HRs associated with doses <4, 4–8 and ≥8 g/day versus none were 1.22 (95% CI 1.04–1.51), 0.6 (0.54–0.66) and 0.25 (0.24–0.33), respectively.
Diversity in facility-level use of dialysate potassium concentrations and potassium binder use at an appropriate dose appear to be associated with better survival in HD patients.
What is already known about this subject?
• The gradient between dialysate and plasma induces cardiac arrhythmia and is in favour of the use of higher dialysate potassium concentrations that can, however, expose to hyperkalaemia. The objective in dialysed patients to maintain serum potassium into the normal range often requires the prescription of potassium binder.
What this study adds?
• We investigated the centres policy about potassium management studying both the dialysate potassium concentrations used per centre and the potassium binders prescriptions. The possibility to use several dialysate potassium concentrations, <2, 2 and 3 mmol/L, in a centre and the potassium binders were associated with a survival advantage.
What impact this may have on practice or policy?
• Adapting dialysate potassium concentrations to patients’ need requires more frequent serum potassium measurements. The opportunity to more often check serum potassium and adapt the dialysate potassium concentration could improve survival. The dialysate covariate could be a proxy of good medical care.
INTRODUCTION
Patients on haemodialysis (HD) are frequently exposed to hyperkalaemia and its related risks of arrhythmias and sudden cardiac death. Despite a sieving coefficient of 1 that allows it to cross the dialysis membrane freely, dialysis of potassium is hampered by its intracellular location. Intradialytic potassium removal is driven mainly by the dialysate–serum potassium gradient, but the removal also varies with other factors including Kt/V and patient acid–base status [1]. Holter monitoring of HD patients has demonstrated their high frequency of various cardiac rhythm disorders, which are promoted by cardiac hypertrophy, hypertension and anaemia [2]. Both hypo- and hyperkalaemia are associated with higher risks of death, which are higher still when hypokalaemia is accompanied by malnutrition [3].
The complex removal of potassium during dialysis frequently requires that patients take potassium binders during the interdialytic period, as well as observing dietary restrictions. The use of these binders varies widely by country [4]. Moreover, a regional study has shown that high hyperkalaemia prevalence persists despite the use of both low dialysate potassium and the prescription of potassium binders for >61% of patients [5]. Few guidelines exist about potassium management in HD [6].
We therefore studied prescription patterns of dialysate potassium concentrations and of potassium binders and their association with patient survival, based on record linkage between the Renal Epidemiology and Information Network (REIN) registry, the national health data system and facility-level data about the dialysate potassium concentrations used.
MATERIALS AND METHODS
Population
Data were extracted from the REIN registry of all patients on renal replacement therapy for end-stage kidney disease in France [7]. We included 25 629 incident adult patients who began dialysis during the 2010–13 period and were dialysed for >3 months and for whom accurate dialysate exposure estimates were available (Figure 1).
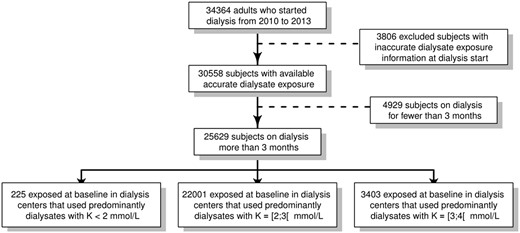
Flow chart of the study.
Assessment of patient exposure to dialysate potassium
Facility-level exposure to the different dialysate potassium concentrations were constructed from sales data. All manufacturers of dialysate sold in France (Soludia Bellco now Medtronic, Fresenius, Baxter-Gambro, Hemotech and Fresenius Medical Care) provided the number and potassium concentration of all dialysate bags sold each year to each centre from 2010 through 2014.
To verify the exposure assessment, we compared the number of HD patients estimated from the overall yearly dialysate volume sold to each unit with the numbers the units actually reported each year to the REIN registry. For each dialysis unit, we calculated the ratio of the number of dialysis patients provided by the registry to the number estimated from the volume of dialysate sold; this ratio defined the percentage of dialysate exposure by centre and by year. Dialysate exposure ratios <1.2 were considered accurate, reflecting that reported sales covered dialysis needs. Patients who started dialysis in a unit with a ratio ≥1.2 were excluded, and patients whose unit developed such a ratio were censored from that point onward. The median [interquartile range (IQR)] ratio of dialysate exposure after exclusions equalled 0.81 (0.71–0.94) and was stable over the study period. This median ratio is an indicator of the quality of the dialysate exposure data for each centre.
Facility-level dialysate potassium was then estimated for each concentration level supplied to the centre (<2, 2, 3 or ≥4 mml/L) and assigned to each patient by time period, with changes in patients’ dialysis units and annual changes in dialysate concentrations within each unit.
Assessment of potassium binder and potassium prescription
Individual data for potassium binders and oral potassium supplements were extracted from the national health data system, known as the Système National des Données de Santé (SNDS) database, which combines several sources of healthcare utilization data. The quantity of potassium binders, including sodium and calcium polystyrene, and of oral potassium chloride dispensed monthly to each patient was used to estimate their daily prescribed doses. Of the 25 629 patients included in the analysis, 21 497 (84%) were identified in the SNDS database. Given the absence of a unique identifier enabling linkage between the SNDS and the REIN registry databases, we performed stepwise indirect linkage by the following data: gender, age, postal code, national hospital identifier and date dialysis started [8].
Other information
Data at dialysis start included in the REIN registry included age, gender, nephropathy, emergency start, laboratory results [albumin, haemoglobin and estimated glomerular filtration rate (eGFR)] and comorbidities. We used the Chronic Kidney Disease Epidemiology Collaboration (CKD-EPI) equation to calculate eGFR. Baseline comorbidities included active malignancy, cirrhosis, mobility status, obesity (body mass index ≥30 kg/m2), arrhythmia, respiratory failure, heart failure and at least one arterial disease (among stroke, transient ischaemic attack, coronary insufficiency, abdominal aortic aneurysm and lower limb arteritis). Furthermore, treatment data, including frequency and duration of dialysis, haemodiafiltration (HDF) use, vascular access and centre type (centre, medicalized unit or self-assisted unit) were updated annually and when the patient moved to another dialysis centre. The events recorded included kidney transplantation, transfer to peritoneal dialysis, weaning from dialysis and death with its specific cause through 31 December 2014.
Statistical analysis
We first described trends in dialysate sales in France from 2010 through 2014 by potassium concentrations after excluding centres with inaccurate exposure estimates.
Patients' baseline characteristics and technical data were compared for three subgroups, defined by the principal dialysate potassium concentration used at the facility and at dialysis start: <2, 2 or ≥3 mmol/L. Potassium therapies were also described for all patients in these three subgroups at baseline and in the subgroup of 8179 patients on HD for at least 3 years. Categorical and continuous covariates at inclusion were compared between groups with Pearson’s Chi-squared test or one-way analysis of variance, as appropriate.
We used Cox proportional hazard risk models to estimate crude and adjusted hazard ratios (HRs) and their 95% confidence intervals (CIs) for all-cause mortality associated with time-varying exposure to dialysate potassium and therapies. Facility-level dialysate potassium concentrations were studied successively by the number of concentrations used per dialysis unit and by classes of percentage of each concentration. The Cox models were stratified by centre type and adjusted for age, gender, comorbidities, emergency dialysis start and laboratory data. HRs were also adjusted for type of vascular access, dialysis session length, HDF and number of dialysis sessions per week, each treated as a time-dependent covariate. Interactions between the number of dialysis sessions per week and dialysate potassium concentrations were tested. Because nephrology practices may vary by unit, robust variance estimates (by a sandwich estimator) were used to take the unit clustering effect into account. We tested the proportional hazards assumption by the Schoenfeld residual method. Survival times were censored at the time of event for kidney transplantation, weaning from dialysis, loss to follow-up, moving out of France, transfer to a dialysis unit with inaccurate dialysate exposure, peritoneal dialysis or home dialysis. In a sensitivity analysis, we repeated all Cox models to estimate HRs for 3-month mortality including all patients from the first day of dialysis.
Missing values for adjustment covariates were imputed with chained equations (the mice and mice adds packages of R), with 20 iterations and 20 imputed data sets. Each Cox model was run on the 20 imputed datasets, and these results were pooled according to Rubin’s rules.
All statistical analyses were performed with the SAS 9.4 and R statistical packages.
RESULTS
Trends in dialysate potassium use
Trends in dialysate sales in France from 2010 to 2014 showed that the absolute number of bags sold increased for all potassium concentrations except those <2 mmol/L. The distribution of concentrations, however, changed with a percentage decline for the <2 and 2 mmol/L concentrations, and an increase for 3 mmol/L (Figure 2A and B). Nearly, all the dialysis units (≥99%) used the 2 mmol/L concentration, but its use as the main formula declined slightly from 94% to 87% of the dialysis units between 2010 and 2014 (Table 1). Its median (IQR) percentage of use per dialysis unit was 84% (69–94%) in 2010 and fell slightly thereafter (Figure 3). The 3-mmol/L potassium concentration was used by 89–91% of the dialysis units over the same period, and its use as the main formula rose from 5% to 13% of units (Table 1). Its median (IQR) percentage of use per dialysis unit rose from 12% (6–21%) to 19% (5–33%) over this period. Dialysis units most often used several different potassium concentrations. The most common combination in 2010 was <2, 2 and 3 mmol/L, but it declined from 54% to 37% of the dialysis units over the period. The second most popular combination in 2010 was 2 and 3 mmol/L, the use of which rose from 32% to 40% of units (Table 1).
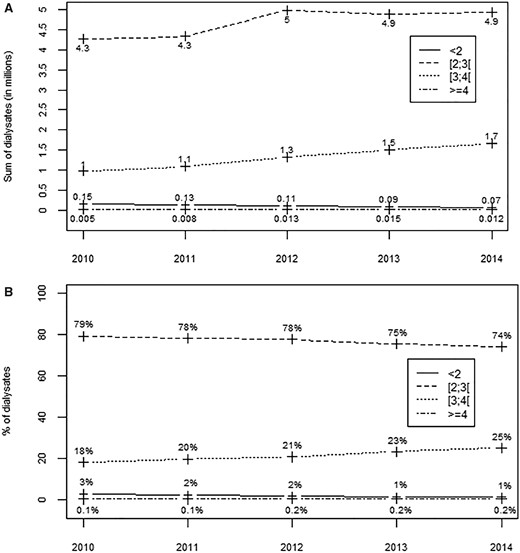
Trends in dialysate sales and percentage use according to the potassium concentrations (in mmol/L) in France from 2010 through 2014. (A) Bags in millions and (B) percentages of use.
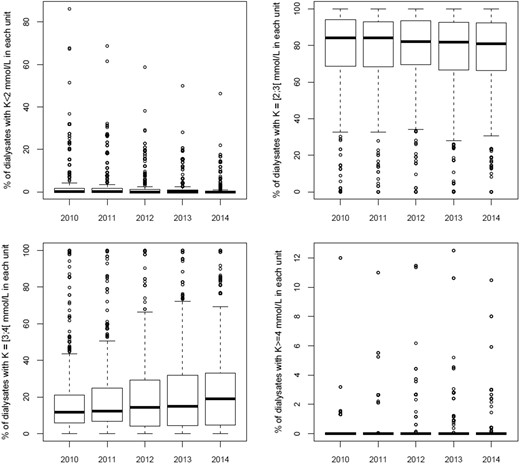
Boxplot of dialysis unit percentage use of dialysate potassium concentrations from 2010 through 2014.
Percentage use of dialysate potassium concentrations by dialysis units in France from 2010 through 2014
| Dialysate potassium concentration (in mmol/L) | 2010 (n = 1080), % (n) | 2011 (n = 1091), % (n) | 2012 (n = 1120), % (n) | 2013 (n = 1119), % (n) | 2014 (n = 1118), % (n) |
|---|---|---|---|---|---|
| Any use | |||||
| <2 | 57 (621) | 56 (612) | 50 (565) | 51 (570) | 49 (553) |
| 2 | 99.6 (1076) | 99 (1084) | 99.6 (1115) | 99.6 (1114) | 99.6 (1113) |
| 3 | 89 (961) | 89 (966) | 88 (989) | 87 (973) | 91 (1016) |
| ≥4 | 3 (28) | 3 (33) | 6 (71) | 7 (75) | 13 (141) |
| All used combinations | |||||
| 2 only | 10 (109) | 10 (105) | 11 (122) | 9 (97) | 9 (99) |
| 3 only | 0.4 (4) | 0.4 (4) | 0.4 (5) | 0.4 (5) | 0.4 (5) |
| <2/2 | 0.9 (10) | 2 (17) | 0.7 (8) | 2 (18) | 0.3 (3) |
| 2/3 | 32 (342) | 33 (359) | 37 (416) | 38 (430) | 40 (451) |
| <2/2/3 | 54 (587) | 52 (570) | 44 (498) | 44 (494) | 37 (419) |
| <2/2/≥4 | – | – | 0.1 (1) | 3 (31) | – |
| 2/3/≥4 | 0.4 (4) | 0.7 (8) | 1 (12) | 2 (17) | 0.9 (10) |
| <2/2/3/≥4 | 2 (24) | 2 (22) | 5 (58) | 2 (27) | 12 (131) |
| Main use | |||||
| <2 | 0.4 (4) | 0.2 (2) | 0.1 (1) | 0.1 (1) | 0.1 (1) |
| 2 | 94 (1019) | 94 (1022) | 94 (1052) | 91 (1021) | 87% (970) |
| 3 | 5 (57) | 6 (67) | 6 (67) | 9 (97) | 13 (147) |
| ≥4 | – | – | – | – | – |
Patients’ baseline characteristics
Patient characteristics are described according to facility-level dialysate potassium concentration subgroups at baseline (Table 2). Patients in units using 3 mmol/L as the main dialysate had arrhythmia and peripheral arterial disease more often, but heart failure less often than those in units using lower concentrations as the main dialysate. They also received HDF treatment less often. The subgroups did not differ significantly for age, diabetes, disability or emergency HD start.
Patient characteristics according to main facility-level dialysate potassium concentration at baseline
| Patients characteristics | Main facility-level dialysate potassium concentration | |||||
|---|---|---|---|---|---|---|
| All (n = 25 629) | <2 mmol/L (n = 225) | 2 mmol/L (n = 22 001) | 3 mmol/L (n = 3403) | P-value | Missing | |
| Age, years, median (IQR) | 70.4 (59.1–79.4) | 69.4 (58.9–78.8) | 70.3 (59–79.4) | 71.3 (60–79.8) | 0.093 | |
| Sex (% of male) | 63 (16 140) | 54 (122) | 63 (13 899) | 62 (2119) | 0.014 | |
| Diabetes | 42 (10 786) | 43 (97) | 42 (9229) | 43 (1460) | 0.56 | 129 |
| Respiratory failure | 14 (3662) | 9 (20) | 14 (3106) | 16 (535) | 0.004 | 824 |
| Cirrhosis | 2 (534) | 1 (3) | 2 (450) | 2 (81) | 0.319 | 694 |
| Cancer | 11 (2889) | 7 (15) | 11 (2466) | 12 (408) | 0.038 | 687 |
| Heart failure | 25 (6319) | 36 (81) | 25 (5448) | 23 (791) | <0.001 | 658 |
| Arrhythmia | 21 (5414) | 13 (30) | 21 (4576) | 24 (807) | <0.001 | 708 |
| Peripheral arterial disease | 39 (9962) | 33 (75) | 39 (8498) | 41 (1389) | 0.012 | |
| Body mass index, ≥30 kg/m² | 23 (5797) | 33 (74) | 22 (4887) | 25 (836) | <0.001 | 5730 |
| Mobility | 0.065 | 2545 | ||||
| Normal | 82 (21 096) | 77 (174) | 82 (18 088) | 83 (2834) | ||
| With help | 13 (3314) | 18 (41) | 13 (2871) | 12 (402) | ||
| Total failure | 5 (1219) | 4 (10) | 5 (1042) | 5 (166) | ||
| Nephropathy | <0.001 | |||||
| Vascular or hypertensive nephropathy | 27 (6896) | 25 (57) | 28 (6085) | 22 (754) | ||
| Diabetic nephropathy | 23 (5966) | 25 (56) | 24 (5194) | 21 (716) | ||
| Glomerulopathies | 10 (2633) | 12 (27) | 10 (2218) | 11 (388) | ||
| Polycystic kidney disease | 6 (1526) | 5 (11) | 6 (1347) | 5 (168) | ||
| Tubulointerstitial nephropathy | 4 (1082) | 5 (11) | 4 (907) | 5 (164) | ||
| Other or unknown | 29 (7526) | 28 (63) | 28 (6250) | 36 (1213) | ||
| Dialysis start in emergency | 32 (8119) | 31 (69) | 32 (6964) | 32 (1086) | 0.923 | 1377 |
| HDF | 12 (2986) | 59 (133) | 10 (2116) | 22 (737) | <0.001 | |
| Vascular access | <0.001 | 1436 | ||||
| Native fistula or Graft | 53 (13 466) | 62 (140) | 53 (11 726) | 47 (1601) | ||
| Tunneled catheter | 41 (10 527) | 37 (83) | 41 (8930) | 44 (1514) | ||
| Other | 6 (1635) | 0.9 (2) | 6 (1345) | 8 (288) | ||
| Unit types | <0.001 | |||||
| Centre | 91 (23 335) | 100 (225) | 91 (19923) | 94 (3187) | ||
| Medicalized unit | 3 (800) | – | 3 (737) | 2 (63) | ||
| Self-dialysis unit | 2 (420) | – | 2 (406) | 0.4 (14) | ||
| Training | 4 (1074) | – | 4 (935) | 4 (139) | ||
| Sessions per week | 0.02 | 176 | ||||
| 2 | 6 (1608) | 2 (4) | 6 (1408) | 6 (196) | ||
| 3 | 92 (23 685) | 98 (220) | 92 (20 307) | 93 (3159) | ||
| Other | 1 (336) | 0.4 (1) | 1 (286) | 1 (48) | ||
| Dialysis time >4 h | 3 (717) | 5 (11) | 3 (563) | 4 (143) | <0.001 | 161 |
| Albuminaemia, g/L | 0.581 | 10152 | ||||
| <25 | 11 (2781) | 10 (22) | 11 (2367) | 12 (392) | ||
| 25–30 | 18 (4675) | 17 (39) | 18 (3989) | 19 (647) | ||
| 30–35 | 30 (7638) | 31 (69) | 30 (6540) | 30 (1029) | ||
| ≥35 | 41 (10 535) | 42 (95) | 41 (9105) | 39 (1335) | ||
| Haemoglobin level, g/dL, median (IQR) | 10.1 (9–11.1) | 10.2 (9.1–11.4) | 10.1 (9–11.2) | 10 (8.9–11.1) | 0.121 | 4837 |
| CKD-EPI eGFR, >10 mL/min/1.73 m2 | 26 (6766) | 25 (56) | 26 (5612) | 32 (1098) | <0.001 | 3863 |
| CKD-EPI eGFR, median (IQR) | 7.7 (5.7–10.2) | 7.6 (5–10) | 7.6 (5.6–10.1) | 8.1 (6–11) | <0.001 | 3863 |
Prescription of potassium binders and potassium
Potassium binders were prescribed for 37% of the patients, at a median (IQR) dose of 6 g/day (3–10). Patients in units using the 2 mmol/L concentration as the main formula received potassium binder less often (Table 3). Oral potassium supplements were used in 6% of the patients, at a median (IQR) dose of 238 mg/day (132–625) and at a higher frequency in dialysis units using <2 mmol/L as their main formula. In the subset of patients followed-up for at least 3 years, the frequencies of use and the median doses of potassium binders and supplements decreased over the period (Table 4). Potassium binder prescriptions were more stable in the dialysis units that used 3 mmol/L as the main concentration.
First-year medication prescription according to main facility-level dialysate potassium concentration among 21 497 patients identified in the SNDS database
| Main facility-level dialysate potassium concentration at baseline | ||||
|---|---|---|---|---|
| All (n = 21 497) | <2 mmol/L (n = 206) | 2 mmol/L (n = 18 297) | 3 mmol/L (n = 2994) | |
| Potassium binders, patients exposed, % | 37 | 42 | 37 | 40 |
| Dose, g/day | 6 (3–10) | 5 (3–8) | 6 (3–10) | 7 (3–11) |
| Potassium, patients exposed, % | 6 | 10 | 5 | 8 |
| Dose, mg/day | 238 (132–625) | 199 (84–427) | 228 (132–625) | 263 (133–628) |
Data are presented as percentage of patients who received the drug—median (IQR) of the daily average dose (among patients who received the drug). n, number of patients.
Medication prescription according to main facility-level dialysate potassium among 8179 patients identified in the SNDS database and with at least 3 years of follow-up
| Dialysate potassium concentrations | Year of follow-up | ||
|---|---|---|---|
| 1 | 2 | 3 | |
| Main facility-level dialysate potassium concentration, mmol/L | |||
| <2 | n = 96 | n = 21 | n = 13 |
| 2 | n = 7171 | n = 7288 | n = 7229 |
| 3 | n = 912 | n = 870 | n = 937 |
| Potassium binders (g/day) | |||
| % | % | % | |
| Median (IQR) | Median (IQR) | Median (IQR) | Median (IQR) |
| % exposed | 41 | 39 | 35 |
| Dose | 7 (4–11) | 6 (3–9) | 5 (2–9) |
| Main facility-level dialysate potassium concentration | |||
| <2 mmol/L | 47.9 | 38.1 | 23.1 |
| 5 (2–9) | 7 (6–9) | 4 (4–7) | |
| 2 mmol/L | 40.1 | 38.6 | 34.5 |
| 7 (4–11) | 6 (3–9) | 5 (2–9) | |
| 3 mmol/L | 45.6 | 44.3 | 40.7 |
| 7 (4–12) | 6 (4–10) | 5 (3–9) | |
| Potassium (mg/day) | |||
| % | % | % | |
| Median (IQR) | Median (IQR) | Median (IQR) | Median (IQR) |
| % exposed | 4.6 | 1.7 | 1.1 |
| Dose | 247 (132–723) | 575 (197–1249) | 561 (197–1032) |
| Main facility-level dialysate potassium concentration | |||
| <2 mmol/L | 7.3 | – | – |
| 85 (82–256) | |||
| 2 mmol/L | 4.2 | 1.6 | 1.1 |
| 247 (132–697) | 575 (197–1381) | 568 (197–1095) | |
| 3 mmol/L | 7.2 | 2.5 | 1.6 |
| 329 (151–937) | 559 (197–986) | 395 (121–822) | |
Data are presented as percentage of patients who received the drug and median (IQR) of the daily average dose (among patients who received the drug).
Mortality HRs according to dialysate potassium and potassium binder prescription
Compared with patients on HD in units using a single dialysate formula, those in units using more than two or three had adjusted mortality HRs of 0.91 (95% CI 0.82–1.01) for two formulas and 0.84 (0.75–0.93) for three. Using classes of use per centre for each dialysate potassium concentration, adjusted mortality HRs were significantly lower in patients dialysed in units that used dialysate potassium <2 mmol/L for 0–2% of their patients, compared with none, and in those using 3 mmol/L in 10–30% of their patients compared with none (Table 5). There was no effect modification from the number of dialysis sessions per week on HR estimates (interaction P > 0.10).
Adjusted HR for all-cause mortality according to percentage use of dialysate potassium other than 2 mmol/L and medication prescriptionsa
| Dialysate potassium | Person-years | HR (95% CI) | P-value |
|---|---|---|---|
| Percentage of <2 mmol/L use per centreb (ref 0%) | 26 661 | ||
| 0–2% | 10 735 | 0.89 (0.81–0.98) | 0.01 |
| >2% | 9034 | 1 (0.92–1.1) | 0.9 |
| Percentage of 3 mmol/L use per centreb (ref 0–10%) | 16 443 | ||
| 10–30% | 17 237 | 0.87 (0.8–0.95) | 0.002 |
| >30% | 12 750 | 0.97 (0.89–1.05) | 0.4 |
| Percentage of 4 mmol/L use per centreb (ref 0%) | 43 228 | ||
| 0–2% | 1279 | 1 (0.82–1.21) | 0.9 |
| >2% | 1923 | 0.91 (0.77–1.08) | 0.2 |
| Potassium binders, g/dayb (ref 0) | 26 247 | ||
| <4 | 4615 | 1.22 (1.14–1.32) | <0.001 |
| 4–8 | 3859 | 0.6 (0.54–0.66) | <0.001 |
| ≥8 | 4117 | 0.25 (0.22–0.29) | <0.001 |
| Potassium, mg/dayb (ref 0) | 45 321 | ||
| <200 | 537 | 1.25 (1.03–1.51) | 0.02 |
| 200–400 | 194 | 1.17 (0.88–1.55) | 0.2 |
| ≥400 | 378 | 0.9 (0.71–1.13) | 0.3 |
| Missing medications | 7590 | 0.97 (0.91–1.05) | 0.4 |
HRs were adjusted for HDF, number of sessions per week, vascular access, dialysis time >4 h, as time-dependent variables, as well as for age, sex, respiratory failure, heart failure, cirrhosis, cancer, arrhythmia, arterial disease (stroke, transient ischaemic attack, coronary insufficiency, aneurysm abdominal aorta or arteritis of the lower limbs), obesity, mobility, initial nephropathy, emergency dialysis start, CKD-EPI >10 mL/min/1.73 m2, haemoglobin level, classes of albuminaemia. Cox models were stratified by dialysis unit type.
Time-dependent variable.
Potassium binder dispensing was significantly associated with increased mortality in patients prescribed doses <4 g/day and with decreased mortality in those prescribed higher doses, both compared with no use (Table 5). Potassium supplements were not associated with any survival benefit.
The mortality at 3 months was not associated with any dialysate potassium concentration covariates and was decreased in patients receiving potassium binders [potassium binders 4–8 g/day, HR = 0.04, 95% CI 0.01–0.15; ≥8 g/day, HR = 0.04, 95% CI 0.01–0.14].
DISCUSSION
This national registry-based study shows that French dialysis units vary considerably in the percentage of patients who receive the different dialysate potassium concentrations, with a general trend towards declining use of the concentrations <2 and 2 mmol/L and increasing use of the 3 mmol/L level. These results reveal the strategy of most dialysis units: the use of two, three or even more dialysate formulas rather than only one enables them to manage a broad spectrum of potassium disorders. Our most original finding confirms the benefit of that strategy: increased diversity in the concentrations of dialysate potassium used by dialysis units is associated with better survival. The declining prescription of potassium binders over time in patients on HD for ≥3 years is also worth noting.
The use of a dialysate potassium concentration <2 mmol/L remains a matter of debate. Its use has decreased worldwide to <5% in North America and 6% in several European countries, as reported by the Dialysis Outcome and Practice Pattern Study (DOPPS) over the 2012–15 period [9]. It nonetheless remains high in a number of countries, including Spain (62%), Australia/New Zealand (18%), Canada (17%), the UK (13%) and Belgium (10%). We confirmed that this concentration is used at a very low level nationwide in France, declining from 3% to 1% over the study period. Reports about its association with survival in patients on HD have been inconsistent. The authors of a nested case–control study found that its use was associated with a higher rate of sudden cardiac deaths; they also observed no evidence that such a low concentration of dialysate potassium was beneficial, even among patients with high serum potassium [10]. The large prospective cohort study collected in the DaVita data warehouse, however, reported no association between low dialysate potassium concentrations and mortality after adjusting for nutritional status. Higher concentrations (≥3 mmol/L), on the other hand, were significantly associated with higher mortality in patients with pre-dialysis hyperkalaemia (≥5 mmol/L); this association reflected a failure to adapt the dialysate to patients’ serum potassium levels [3]. The authors emphasized the regrettable routine use of a single dialysate potassium concentration, which presents a dilemma in managing patients with hyperkalaemia [3]. The finding that survival was best in patients with normal kalaemia and dialysed with a 3 mmol/L potassium concentration confirmed the important role of the serum–dialysate potassium gradient [11]. Subjects with low serum potassium had the worst survival, associated especially with their nutritional status and influenced only weakly by the dialysate potassium concentration. Finally, a small retrospective cohort study in Taiwan found that the use of a potassium concentration <2 mmol/L in patients with serum potassium exceeding 5.5 mmol/L was associated with a 3-fold reduction of mortality risk [12]. Our finding that slightly but significantly lower mortality was associated with the use of dialysate potassium <2 mmol/L in a small percentage of patients may reflect dialysis unit practices aimed at frequent adjustment of dialysate concentration to the patient’s needs, evaluated by more frequent potassium assays. Its use may be a marker of attention to potassium disorders and to adjustment of dialysate concentrations. The strategy of the medical staff in its use probably determines whether any benefit can be expected. This practice may influence the association between the use of <2 mmol/L concentration with mortality.
We also observed better survival for patients on HD in units that used 3 mmol/L dialysate potassium concentrations for 10–30% of their patients. More frequent use of this concentration may expose some patients to inadequate potassium dialysis. However, DOPPS observed no difference in clinical outcomes for patients treated with concentrations of 3 versus 2 mmol/L [9]. Diet and the use of potassium binders may, however, affect this choice. In the subgroup of patients on HD for at least 3 years, potassium binders were used more frequently in units that mainly used the 3 mmol/L concentration. This strategy was not associated with an increased risk of death in the overall population, but special care is necessary for younger and non-adherent subjects.
Potassium binder prescription was high at the national level—37% in the overall dialysis population. We note that the daily doses of potassium binder estimated from this database were close to the most frequent dosage prescribed: one 15-g tablespoon on non-dialysis days. The mean weekly intake was 42 g, equivalent to 10.5 g four times a week. Intake decreased over the 3 years of follow-up, perhaps expressing poorer adherence and tolerance [13] or better understanding of dietary needs and adherence to relevant recommendations. The association of their use with survival varied with the dose. The lowest dose was associated with a higher risk of death than no use at all. In this observational study, the ‘control’ group included both patients with no indication for potassium binder and patients for whom it was indicated, but who either had no prescription or did not adhere to treatment. The percentage of each control subgroup is unknown, but their expected mortality risks differ and may bias HR estimates of the exposed subgroups. The other two dose classes were positively associated with survival compared with the absence of use. Several factors other than treatment-related kalaemia control and lower potassium gradient during dialysis may explain this association, including better nutritional status among patients requiring potassium binders, overall better adherence to treatment and better medical care.
Major strengths of this study include its large sample size and the use of the REIN registry data linked to national health data, which enable the findings to be generalized to the overall dialysis population. Another strength is our evaluation of dialysate potassium concentration use based on dialysate sales, which provided an accurate description of prescription patterns at the facility level and ruled out indication bias in the observed association with patient survival. We were also able to account for several potential confounders, including HDF, which significantly differed according to potassium dialysate concentrates but was adjusted for as a time-dependent variable in Cox models.
This study also has limitations. Its observational nature precludes any causal inference. Notably, the association of dialysate potassium prescription patterns with survival may be confounded by other dialysis unit practices and it is possible that changing prescription patterns are a proxy for good medical care. This was partly taken into account by adding a random effect for centre in statistical analyses. Another limitation is the lack of data about the frequency and results of laboratory measurements, which prevented us from demonstrating whether dialysis strategies associated with better outcomes might also be associated with more frequent monitoring and better control of serum potassium. This type of data has been published over the same period in France and underlines how difficult it is to maintain serum potassium within a safe ‘normal’ range, despite proactive mitigation strategies [5]. The benefits of the three-formula strategies may also be linked to better kalaemia monitoring. Finally, although using dialysate sales to assess dialysate potassium concentrations exposure can prevent indications bias, this approach may be less precise to evaluate the impact of the adequacy of use on clinical data at the individual level.
In conclusion, this study reveals potential benefit from strategies aimed at using several potassium dialysate formulas to accommodate various patient needs. Care must be taken in the use of the <2 mmol/L formula [6], but in a small subset of patients, it may provide survival benefits that also may depend on regular potassium assays. We confirmed the benefit of the 3 mmol/L formula as long as it is not used as the only formula in a centre. All these practices may vary with local and seasonal diet. Only a randomized clinical trial can assess the true benefit of either strategy of dialysate potassium use according to patient profile. Potassium binders appear to be life-sparing, but the need and tolerance for them may each decline over time.
ACKNOWLEDGEMENTS
We gratefully acknowledge all REIN registry participants. The centres participating in the registry are listed in the REIN annual report: http://www.agence-biomedecine.fr/Le-programme-REIN.
FUNDING
The study received funding from the Agence de la Biomédecine in 2016 and from the Société Francophone Néphrologie Dialyse Transplantation in 2017 (Baxter fund).
CONFLICT OF INTEREST STATEMENT
None declared.
(See related article by Wouda et al. Personalizing potassium management in patients on haemodialysis. Nephrol Dial Transplant 2021; 36: 13--18)


Comments