


Abstract
Low serum bicarbonate level is associated with increased mortality, but its role as a predictor of cardiovascular disease (CVD) is unclear. This study evaluates the association between serum bicarbonate concentration and CVD and whether the effect of intensive blood pressure (BP) lowering on CVD outcomes is modified by serum bicarbonate level.
The Systolic Blood Pressure Intervention Trial (SPRINT) randomized participants to a systolic BP target <120 mmHg (intensive treatment) or <140 mmHg (standard treatment). The primary CVD outcome was a composite of nonfatal myocardial infarction (MI), acute coronary syndrome not resulting in MI, stroke, acute decompensated heart failure and CVD death. Cox proportional hazards models adjusted for demographic, clinical and laboratory characteristics were used to evaluate the association of interest in 9334 SPRINT participants (ClinicalTrials.gov: NCT01206062).
Over a median follow-up of 3.33 years (interquartile range 2.87–3.87 years), 618 (6.6%) participants experienced a primary CVD outcome. Participants with serum bicarbonate <22 mEq/L had a significantly higher risk of the primary CVD outcome (hazard ratio 1.54; 95% confidence interval 1.11–2.14, P = 0.01), compared with participants with bicarbonate 22–26 mEq/L. The magnitude of the CVD risk reduction with intensive BP lowering was similar across bicarbonate strata (P-value for interaction = 0.97).
In hypertensive individuals, serum bicarbonate level <22 mEq/L was associated with an increased CVD risk. The effect of intensive BP lowering on CVD outcomes was not modified by the serum bicarbonate level.
INTRODUCTION
Cardiovascular disease (CVD) affects nearly 40% of the US population [1], and the burden of CVD is particularly high in individuals with chronic kidney disease (CKD) [2].
Metabolic acidosis, typically defined as a serum bicarbonate <22 mEq/L, is common in CKD and, like CVD, its prevalence increases as kidney function declines [3, 4]. Several studies in CKD cohorts have identified an association between metabolic acidosis and mortality [5–7]. Similar findings have been observed in individuals without CKD [8–10]. Together these results suggest that low bicarbonate concentration is a risk factor for mortality in diverse populations. However, the pathologic link between serum bicarbonate concentration and mortality remains uncertain.
Given the high burden of CVD in the general population, a plausible rationale for this association is a detrimental effect of metabolic acidosis on cardiovascular structure and function, subsequently leading to CVD and death. Few studies have evaluated the association between serum bicarbonate concentration and CVD, with conflicting results. In a cohort of patients with Type 2 diabetes, low serum bicarbonate concentration was independently and inversely associated with incident coronary disease [11]. In a CKD cohort, high serum bicarbonate concentration was associated with increased risk of heart failure events, but no association with atherosclerotic events, including coronary artery disease, was found [12, 13]. In contrast, no significant association between bicarbonate and CVD was observed in patients with diabetic kidney disease [14] or in healthy older individuals [8]. Thus, a relationship between serum bicarbonate concentration and CVD has not been clearly established.
The objective of this study was to determine the association between serum bicarbonate concentration and CVD events in a large cohort of hypertensive adults enrolled in the Systolic Blood Pressure Intervention Trial (SPRINT). SPRINT demonstrated that intensive systolic blood pressure (BP) control reduces the risk of cardiovascular morbidity and mortality in nondiabetic individuals with hypertension, with and without CKD [15]. Given this effect, we also assessed whether intensive BP control was more beneficial in individuals with low serum bicarbonate compared with those with normal serum bicarbonate concentration at study baseline.
MATERIALS AND METHODS
Study design
SPRINT was a multicenter randomized clinical trial (ClinicalTrials.gov: NCT01206062) that evaluated whether targeting intensive systolic BP control <120 mmHg reduces cardiovascular morbidity and mortality as compared with standard systolic BP control (<140 mmHg). The study design and methods have been previously published [16]. Briefly, between November 2010 and March 2013, SPRINT recruited 9361 participants aged ≥50 years with hypertension at 102 clinics in the USA. Eligible participants had a systolic BP 130–180 mmHg, and at least one of four cardiovascular risk factors: clinical or subclinical CVD, estimated glomerular filtration rate (eGFR) 20–60 mL/min/1.73 m2, Framingham 10-year risk score ≥15% or age ≥75 years. Major exclusion criteria included diabetes mellitus, history of stroke, cardiovascular event or procedure in the prior 3 months, symptomatic heart failure in the past 6 months, left ventricular ejection fraction <35%, proteinuria >1 g/day or the equivalent based on spot urine measurement, polycystic kidney disease, recent immunosuppression, coexisting disease likely to affect survival and organ transplant. Institutional review boards at all clinical sites approved the study protocol.
Data collection
Demographic data were collected at baseline. Clinical and laboratory data were obtained at baseline and every 3–6 months in the first 2 years and yearly thereafter. BP was measured at each study visit [17]. A structured interview was used in both groups every 3 months to obtain self-reported CVD outcomes. A committee whose members were unaware of the study-group assignment adjudicated clinical outcomes.
Main predictor
Serum bicarbonate was measured at baseline using an enzymatic method with phosphoenolpyruvate carboxylase on Roche CO2-L reagent or Roche Cobas 6000 Chemistry Analyzers (Roche Diagnostics Corporation) at the University of Minnesota Core Laboratory. Blood was collected at the clinical sites, centrifuged and shipped overnight at refrigerated temperature the day of collection. Serum bicarbonate was analyzed categorically using the following clinically relevant strata: <22 mEq/L (low), 22–26 mEq/L (reference group) and >26 mEq/L (high), and also as a continuous variable. The cutoff for the low group was chosen based on the evidence that levels <22 mEq/L are associated with increased risk of death [2].
Outcomes
The SPRINT primary outcome was a composite of adjudicated myocardial infarction (MI), acute coronary syndrome not resulting in MI, stroke, acute decompensated heart failure or death from cardiovascular causes. SPRINT secondary outcomes included death from any cause, acute decompensated heart failure and two kidney outcomes. The primary kidney outcome, for participants with CKD at baseline (eGFR <60 mL/min/1.73 m2), was the time to first occurrence of a reduction in eGFR ≥50% (measured twice at least 90 days apart), long-term dialysis or kidney transplantation. The secondary kidney outcome, for participants with eGFR ≥60 mL/min/1.73 m2 at baseline, was time to the first occurrence of a reduction in eGFR ≥30% (measured twice at least 90 days apart) to an eGFR <60 mL/min/1.73 m2. Incident microalbuminuria was defined as an increase in urine albumin to creatinine ratio (UACR) to ≥30 mg/g for participants with UACR <30 mg/g at baseline. Incident macroalbuminuria was defined as an increase in UACR to ≥300 mg/g for participants with UACR <300 mg/g at baseline.
Covariates
Demographic and clinical information were obtained by questionnaires, interviews and physical examination at study baseline. History of CVD was defined by self-report or through clinical evidence of coronary artery disease or peripheral arterial disease [16]. Serum creatinine was measured by an enzymatic procedure traceable to isotope dilution mass spectroscopy on a Roche analyzer. eGFR was calculated using the CKD Epidemiology Collaboration equation [18]. Urine albumin was measured by an immunoturbidometric method on a Roche analyzer, and UACR was calculated from a spot urine sample collected at study baseline and analyzed as a continuous variable after log transformation.
Statistical analysis
Follow-up time was censored as of 20 August 2015, the date when the process to end the BP intervention was initiated. Kaplan–Meier curves were used to depict the incidence of clinical outcomes by serum bicarbonate strata. Cox proportional hazards regression models were used to evaluate the association between baseline serum bicarbonate and clinical outcomes. We estimated the effect of serum bicarbonate as a categorical (using the following strata: <22, 22–26 or >26 mEq/L) and as a continuous predictor (estimated using B-splines relative to the mean serum bicarbonate level of 26.3 mEq/L) to allow for nonlinear effects.
The following covariates were included in all regression models: treatment assignment, age, sex, race/ethnicity, smoking status, history of CVD, systolic BP and baseline use of diuretics, angiotensin receptor blockers (ARB) or angiotensin-converting enzyme inhibitors (ACEi). Baseline eGFR, log of UACR and serum potassium were added for the CVD outcome, heart failure and mortality analyses. We used multiple imputations (10 imputed datasets) to account for a small degree of missing data with baseline eGFR (n = 28, 0.3%) and UACR (n = 427, 4.6%). In the imputation models, eGFR was predicted as a function of serum bicarbonate, all the adjustment covariates described earlier, as well as body mass index, high density lipoprotein (HDL) cholesterol and total cholesterol, whereas log of UACR was modeled using the same set of predictors plus eGFR.
Cox proportional hazard models were used to compare the incidence of outcomes between treatment groups, stratified by baseline serum bicarbonate. We tested for interactions between the effect of intensive BP control and subgroups based on serum bicarbonate using likelihood-ratio tests. All analyses were performed using SAS statistical software, version 9.4 (SAS Institute Inc., Cary, NC, USA) and the R Statistical Computing Environment (R Foundation for Statistical Computing, Vienna, Austria).
RESULTS
A total of 9334 (99.7%) SPRINT participants with baseline measurements of serum bicarbonate were included in the analysis. The mean age ± SD was 67.9 ± 9.4 years, 3312 (35.5%) were women, 2791 (29.9%) were black and 1873 (20.1%) had history of CVD. The mean serum bicarbonate level was 26.3 ± 2.6 mEq/L [median 26 mEq/L; interquartile range (IQR) 25–28 mEq/L] and 321 (3.4%) participants had bicarbonate <22 mEq/L. At baseline, mean eGFR was 72 ± 20 (median 73; IQR 58–87) mL/min/1.73 m2, and 2539 (27.3%) participants had eGFR <60 mL/min/1.73 m2. Characteristics of study participants stratified by baseline serum bicarbonate levels are presented in Table 1. Participants with serum bicarbonate <22 mEq/L were more likely to be younger, current smokers, have a history of CVD, lower eGFR and higher albuminuria, and to be taking ACEi/ARB, and less likely to be taking diuretics (Table 1).
Baseline characteristics of SPRINT participants by categories of serum bicarbonate
| Serum bicarbonate | |||||
|---|---|---|---|---|---|
| Total | <22 mEq/L | 22–26 mEq/L | >26 mEq/L | ||
| n = 9334 | n = 321 | n = 4616 | n = 4397 | P | |
| Randomized to intensive treatment, n (%) | 4662 (49.9) | 171 (53.3) | 2319 (50.2) | 2172 (49.4) | 0.35 |
| Age (years), mean ± SD | 67.9 ± 9.4 | 67.1 ± 9.8 | 67.7 ± 9.3 | 68.3 ± 9.5 | 0.002 |
| Female sex, n (%) | 3312 (35.5) | 107 (33.3) | 1537 (33.3) | 1668 (37.9) | <0.001 |
| Race/ethnicity, n (%) | 0.32 | ||||
| White | 5391 (57.8) | 178 (55.5) | 2714 (58.8) | 2499 (56.8) | |
| Black | 2791 (29.9) | 106 (33.0) | 1329 (28.8) | 1356 (30.8) | |
| Hispanic | 978 (10.5) | 32 (10.0) | 491 (10.6) | 455 (10.3) | |
| Other | 174 (1.9) | 5 (1.6) | 82 (1.8) | 87 (2.0) | |
| Smoking status, n (%) | <0.001 | ||||
| Never smoker | 4117 (44.2) | 126 (39.3) | 1919 (41.6) | 2072 (47.2) | |
| Former smoker | 3967 (42.5) | 127 (39.6) | 2014 (43.6) | 1826 (41.6) | |
| Current smoker | 1240 (13.3) | 68 (21.2) | 681 (14.8) | 491 (11.2) | |
| History of CVD, n (%) | 1873 (20.1) | 79 (24.6) | 950 (20.6) | 844 (19.2) | 0.03 |
| Systolic BP (mmHg), mean ± SD | 139.7 ± 15.6 | 138.7 ± 15.9 | 139.1 ± 15.3 | 140.4 ± 15.9 | <0.001 |
| Diastolic BP (mmHg), mean ± SD | 78.1 ± 12.0 | 78.1 ± 12.5 | 78.2 ± 11.9 | 78.1 ± 12.0 | 0.86 |
| Framingham 10-year CVD risk (%), median (IQR) | 22.2 (15.3–31.9) | 23.5 (15.8–34.1) | 22.4 (15.8–31.8) | 22.0 (14.9–31.9) | 0.03 |
| Body mass index (kg/m2), mean ± SD | 29.9 ± 5.8 | 30.0 ± 5.2 | 30.1 ± 5.8 | 29.6 ± 5.8 | <0.001 |
| HDL cholesterol (mg/dL), mean ± SD | 52.9 ± 14.5 | 49.1 ± 14.7 | 51.9 ± 14.3 | 54.1 ± 14.5 | <0.001 |
| LDL cholesterol (mg/dL), mean ± SD | 112.4 ± 35.1 | 104.7 ± 35.7 | 111.9 ± 35.5 | 113.4 ± 34.5 | <0.001 |
| Serum creatinine (mg/dL), median (IQR) | 1.0 (0.9–1.2) | 1.3 (1.0–1.7) | 1.0 (0.9–1.2) | 1.0 (0.9–1.2) | <0.001 |
| eGFR (mL/min/1.73 m2), mean ± SD | 72.4 ± 20.1 | 59.1 ± 25.1 | 71.9 ± 21.0 | 73.9 ± 18.2 | <0.001 |
| eGFR <60 mL/min/1.73 m2, n (%) | 2539 (27.3) | 182 (56.7) | 1373 (29.8) | 984 (22.4) | <0.001 |
| UACR (mg/g), median (IQR) | 9.5 (5.6–21.4) | 13.8 (6.7–72.0) | 9.8 (5.7–22.6) | 9.1 (5.5–19.4) | <0.001 |
| Medications | |||||
| Diuretics, n (%) | 4082 (43.7) | 79 (24.6) | 1702 (36.9) | 2301 (52.3) | <0.001 |
| ACEi, n (%) | 3448 (36.9) | 147 (45.8) | 1782 (38.6) | 1519 (34.5) | <0.001 |
| Angiotensin II antagonists, n (%) | 1978 (21.2) | 65 (20.2) | 944 (20.5) | 969 (22.0) | 0.17 |
| β-blockers, n (%) | 2881 (30.9) | 110 (34.3) | 1419 (30.7) | 1352 (30.7) | 0.41 |
| Calcium channel blockers, n (%) | 3255 (34.9) | 122 (38.0) | 1632 (35.4) | 1501 (34.1) | 0.23 |
| Aspirin, n (%) | 4753 (51.0) | 163 (50.9) | 2347 (50.9) | 2243 (51.1) | 0.98 |
| Statin, n (%) | 4053 (43.7) | 142 (44.8) | 2057 (44.9) | 1854 (42.4) | 0.05 |
LDL, low density lipoprotein.
Association of serum bicarbonate with the primary CVD outcome
Over a median follow-up of 3.33 years (IQR 2.87–3.87 years), 618 participants (6.6%) experienced a primary CVD event (Figure 1). In multivariable adjusted models, which included eGFR and albuminuria, participants with a baseline serum bicarbonate level <22 mEq/L had 54% higher risk of the primary CVD outcome [hazard ratio (HR) 1.54; 95% confidence interval (CI) 1.11–2.14] compared with participants in the reference group (Table 2).
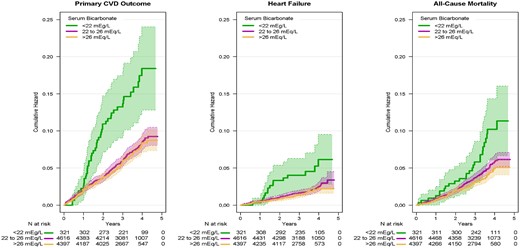
Incidence of the primary CVD outcome, heart failure and all-cause mortality by baseline serum bicarbonate. The primary CVD outcome includes nonfatal MI, acute coronary syndrome not resulting in an MI, nonfatal stroke, nonfatal acute decompensated heart failure and death from cardiovascular causes. Heart failure includes nonfatal and fatal acute decompensated heart failure. Shaded areas denote 95% point-wise CIs.
Association of serum bicarbonate with the primary CVD outcome, heart failure and all-cause mortality
| Serum bicarbonate <22 mEq/L | Serum bicarbonate >26 mEq/L | |||
|---|---|---|---|---|
| Outcome | HR (95% CI) | P | HR (95% CI) | P |
| Primary CVD outcome | ||||
| Model 1 | 2.02 (1.47–2.79) | <0.001 | 0.97 (0.82–1.15) | 0.73 |
| Model 2 | 2.00 (1.45–2.76) | <0.001 | 0.95 (0.80–1.12) | 0.53 |
| Model 3 | 1.54 (1.11–2.14) | 0.01 | 1.04 (0.88–1.24) | 0.65 |
| Heart failure | ||||
| Model 1 | 1.86 (1.04–3.34) | 0.04 | 0.86 (0.62–1.19) | 0.35 |
| Model 2 | 1.70 (0.93–3.09) | 0.08 | 0.83 (0.60–1.16) | 0.27 |
| Model 3 | 0.98 (0.52–1.86) | 0.95 | 0.97 (0.69–1.36) | 0.86 |
| All-cause mortality | ||||
| Model 1 | 1.57 (1.03–2.38) | 0.04 | 0.83 (0.67–1.03) | 0.10 |
| Model 2 | 1.51 (0.99–2.31) | 0.06 | 0.80 (0.64–1.00) | 0.05 |
| Model 3 | 0.98 (0.63–1.54) | 0.94 | 0.91 (0.73–1.14) | 0.40 |
HRs are based on Cox regression and are relative to the reference group of a serum bicarbonate between 22 and 26 mEq/L. The primary CVD outcome includes nonfatal MI, acute coronary syndrome not resulting in an MI, nonfatal stroke, nonfatal acute decompensated heart failure and death from cardiovascular causes. Heart failure includes nonfatal and fatal acute decompensated heart failure.
Model 1: adjusted for treatment group.
Model 2: Model 1 + adjustment for age, sex and race/ethnicity.
Model 3: Model 2 + adjustment for smoking status, history of CVD, systolic BP, use of diuretics, ACEi or angiotensin II receptor blockers, eGFR, log of UACR and serum potassium.
There were a total of 618 primary CVD events, 173 heart failure events and 378 deaths included in the analyses.
Findings from nonlinear analyses using B-splines were generally congruent with the categorical results, indicating a higher risk of CVD events for participants with low serum bicarbonate (Figure 2). There was no indication of heterogeneity in the effect of intensive BP control among bicarbonate strata (P-value for interaction = 0.97) (Figure 3).
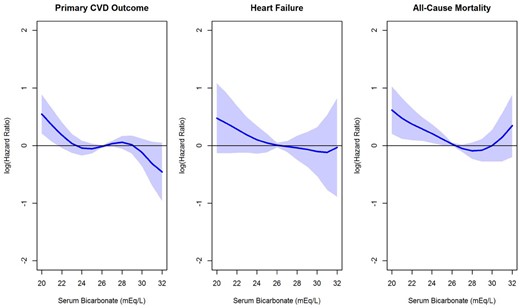
HR estimates for the association of serum bicarbonate with the primary CVD outcome, heart failure and all-cause mortality. HRs were estimated (relative to the mean serum bicarbonate level in SPRINT of 26.3 mEq/L) using B-splines within a Cox regression model, adjusting for the treatment group, age, sex, race/ethnicity, smoking status, history of CVD, systolic BP and use of ACEi, angiotensin II receptor blockers or diuretics, eGFR, log of UACR and serum potassium. The primary CVD outcome includes nonfatal MI, acute coronary syndrome not resulting in an MI, nonfatal stroke, nonfatal acute decompensated heart failure and death from cardiovascular causes. Heart failure includes nonfatal and fatal acute decompensated heart failure.
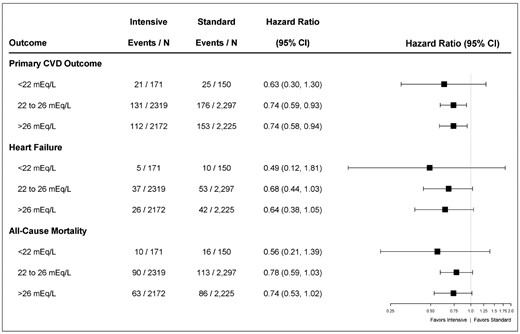
Forest plot comparing intensive-treatment to standard-treatment for the primary CVD outcome, heart failure and all-cause mortality by subgroups of serum bicarbonate. HRs compare intensive-treatment group to standard-treatment group. The primary CVD outcome includes nonfatal MI, acute coronary syndrome not resulting in an MI, nonfatal stroke, nonfatal acute decompensated heart failure and death from cardiovascular causes. Heart failure includes nonfatal and fatal acute decompensated heart failure.
In subgroup analyses by CKD status, the association between serum bicarbonate and CVD outcome was similar between those with and without baseline CKD (HR per 1 mEq/L lower serum bicarbonate 1.03, 95% CI 0.98–1.08 and 1.04, 95% CI 0.99–1.08, respectively; P-value for interaction by CKD status = 0.76).
Association of serum bicarbonate with all-cause mortality
A total of 378 (4.1%) deaths occurred over a median follow-up of 3.36 (IQR 2.90–3.89) years. Participants with low serum bicarbonate level experienced a higher incidence of all-cause mortality (2.3% per year) compared with those with serum bicarbonate 22–26 mEq/L (1.3% per year) or >26 mEq/L (1.1% per year) (Figure 1).
In multivariable-adjusted Cox proportional hazard models, participants with low serum bicarbonate did not have a higher risk of all-cause mortality compared with the reference group (HR 0.98, 95% CI 0.63–1.54, Table 2). However, a U-shaped association was observed in nonlinear analysis, with the lowest mortality risk for serum bicarbonate near 28 mEq/L (Figure 2).
Participants randomized to the intensive treatment had a lower relative risk of all-cause mortality, irrespective of the baseline serum bicarbonate level (P-value for interaction = 0.65) (Figure 3).
The incidence of all-cause mortality by baseline serum bicarbonate, stratified by CKD status is presented in Supplementary data, Figure S1. Significant interaction was observed in CKD versus non-CKD group (HR per 1 mEq/L lower serum bicarbonate 1.09, 95% CI 1.03–1.16 for CKD versus 0.99, 95% CI 0.94–1.05 for non-CKD, P-value for interaction = 0.016).
Association of serum bicarbonate with acute decompensated heart failure events
A total of 173 (1.9%) heart failure events occurred over a median follow-up of 3.33 (IQR 2.87–3.87) years. In unadjusted analyses, low serum bicarbonate was associated with increased risk of acute decompensated heart failure (Figure 1). A similar pattern was observed in B-spline analyses, though the association was not statistically significant (Figure 2). Likewise, when serum bicarbonate was analyzed as a categorical variable, the association with heart failure events was not statistically significant (Table 2).
Participants randomized to the intensive systolic BP treatment had a lower relative risk of heart failure, irrespective of the baseline serum bicarbonate level (P-value for interaction = 0.64) (Figure 3).
In subgroup analyses by CKD status, the association between serum bicarbonate and heart failure events was similar between those with and without baseline CKD (HR per 1 mEq/L lower serum bicarbonate 1.01, 95% CI 0.94–1.09 and 1.05, 95% CI 0.95–1.15, respectively, P-value for interaction by CKD status = 0.53).
Association of serum bicarbonate with primary and secondary kidney outcomes
For participants with CKD (eGFR <60 mL/min/1.73 m2), the primary kidney outcome occurred in 24 (0.9%) participants. In participants without CKD (eGFR ≥60 mL/min/1.73 m2), the secondary kidney outcome occurred in 189 (2.8%) participants (Supplementary data, Figures S2 and S3). For both outcomes, participants with serum bicarbonate <22 mEq/L had an insufficient number of events to make statistically reliable statements about bicarbonate association with kidney disease progression. No significant heterogeneity in the treatment effect across bicarbonate strata was observed (Supplementary data, Figure S3).
DISCUSSION
In a large cohort of hypertensive adults at risk for CVD, participants with serum bicarbonate concentration <22 mEq/L had an increased risk of fatal and nonfatal cardiovascular events. Serum bicarbonate concentration <22 mEq/L was not independently associated with all-cause mortality or heart failure events. However, each 1 mEq/L lower bicarbonate concentration was associated with a 9% higher risk of heart failure events, and a U-shaped association between serum bicarbonate concentration and mortality was observed. Baseline serum bicarbonate level did not modify the association of intensive BP control with improved outcomes among SPRINT participants. There was also no indication that the associations between bicarbonate concentration and clinical outcomes were different by CKD status. Participants with high bicarbonate concentration (>26 mEq/L) did not have a higher risk of the evaluated outcomes.
These findings suggest that low serum bicarbonate concentration is a risk factor for CVD in nondiabetic, hypertensive individuals at increased cardiovascular risk. Of critical importance is understanding whether this association is due to underlying metabolic acidosis or respiratory alkalosis, since hypobicarbonatemia is present in both circumstances.
In persons with reduced GFR, low bicarbonate concentration usually reflects underlying metabolic acidosis, due to the kidneys reduced ability to eliminate nonvolatile acids [3]. At the level of eGFR seen in SPRINT (mean eGFR 72.4 ± 20.1 mL/min/1.73 m2), metabolic acidosis would likely be a reflection of a high dietary acid load, with low intake of fruits and vegetables, a potential distal renal tubular acidosis or bicarbonate wasting [3]. Therefore, an important distinction should be made between two hypothetical cases. In the situation of high acid intake, low serum bicarbonate is a potential mediator in the link between unhealthy dietary habits and poor CVD outcomes. Correction of bicarbonate level through increasing dietary fruits and vegetables or reducing dietary acid intake could lead to improved clinical outcomes. However, if serum bicarbonate is a confounder, and the cause of poor CVD outcomes is reduced GFR with accumulation of CVD toxic uremic solutes, correction of metabolic acidosis might not have an impact on clinical outcomes.
Acidosis stimulates the expression of a wide range of inflammatory genes in endothelial cells and regulates endothelial cell adhesion [19, 20]. This, in turn, leads to leukocyte infiltration and plasma leakage with subsequent tissue damage. Consequently, the link between metabolic acidosis and adverse CVD outcomes could be mediated through endothelial inflammatory processes. Additionally, a rise in extracellular potassium induced by metabolic acidosis could influence cardiac contractility as well as heart rhythm, leading to adverse CVD outcomes.
On the contrary, respiratory alkalosis has been associated with higher mortality risk, but whether it induces CVD is uncertain. Pain is a common cause of respiratory alkalosis, which could promote autonomic dysfunction and subsequent CVD [21, 22]. Anxiety is also a cause of respiratory alkalosis and has been associated with higher CVD mortality in women [23]. Additional studies to elucidate potential mechanisms by which hypobicarbonatemia contributes to CVD are necessary and important given the significant burden of CVD and the central role of acid–base homeostasis on cellular function.
In CKD, low bicarbonate is a risk factor for mortality and accelerated GFR decline [5–7]. In SPRINT, we found that those with lower bicarbonate concentration had higher risk of the composite CVD outcome, despite not having significant decline in kidney function during the follow-up period [24]. This constellation of findings suggests that low bicarbonate concentration is a signal of potentially imminent CVD events and mortality, even in the absence of significant changes in kidney function. Thus, bicarbonate concentration may be a nontraditional risk factor for CVD, and may exert detrimental effects on the cardiovascular system independent of potential effects on the kidney function.
We also assessed whether serum bicarbonate level modifies the effect of intensive BP control on CVD. While we did not identify a significantly different magnitude of risk reduction with intensive BP control, perhaps due to the short follow-up time, there was a suggestion that intensive BP lowering reduces the risk of CVD (37% versus 26%), all-cause mortality (44% versus 22%) and heart failure events (51% versus 32%) in those with low compared with normal bicarbonate groups, respectively. The mechanisms by which the deleterious effects of acid base abnormalities on the cardiovascular system might be mitigated by tight control of BP remain unclear. However, it is reasonable to assume that a heart already subjected to an acidotic milieu, that is prone to have impaired contractility and reduced arrhythmia threshold [4, 25], can benefit from afterload reduction through tight BP control.
This study suggests an inverse association between serum bicarbonate concentration and acute decompensated heart failure, but the mechanistic link is unclear. Data from animal models show that acidemia leads to impaired myocardial contractility [25–27]. However, this has not been tested in humans, and epidemiologic studies to date linking serum bicarbonate with cardiac function have been unrevealing [28]. In contrast with this study, high serum bicarbonate was an independent predictor of heart failure outcomes in the Chronic Renal Insufficiency Cohort (CRIC) study [12, 13]. This apparent discrepancy might be explained by differences in cohort phenotypes. CRIC participants had much lower GFR, at a level where complications of metabolic bone disease, including vascular calcification, occur [29]. Vascular calcification, and in particular coronary calcification, was shown to be associated with worsening heart failure [30].
This study has several strengths. First, SPRINT was a large randomized controlled trial of nondiabetic individuals at risk for CVD, which allowed a thorough analysis of the link between bicarbonate concentration and CVD endpoints in this population. SPRINT also recruited individuals throughout the USA, had a large proportion of participants with CKD, and collected comprehensive clinical and laboratory data. However, several limitations need to be considered. First, it is an observational study, and therefore a certain degree of residual confounding cannot be excluded, and causality cannot be inferred. Second, full ascertainment of acid–base status by blood gas analyses was not performed. Some participants might have had a low bicarbonate level as a compensatory response for respiratory alkalosis or a high bicarbonate level as a compensatory mechanism for respiratory acidosis. The follow-up period was relatively short, which may have prevented identifying associations between serum bicarbonate concentration and all-cause mortality and kidney events. The total number of events in patients with low bicarbonate is relatively small, particularly for mortality, heart failure and kidney events; therefore, the lack of statistically significant associations should be interpreted with caution. The results cannot be extrapolated to diabetics, since diabetes mellitus was an exclusion criterion from SPRINT enrollment. Finally, these analyses are based on a single measurement of serum bicarbonate; whether changes in bicarbonate levels over time add incremental predictive value will need further study. Nevertheless, follow-up bicarbonate values were consistent with the baseline values used to define the groups, and it is likely that the risk of misclassification bias was low (Supplementary data, Figure S4).
In summary, serum bicarbonate concentration <22 mEq/L was independently associated with a high risk of CVD events in hypertensive individuals. The effect of intensive BP lowering on CVD outcomes was not modified by the serum bicarbonate level. Future studies should determine the underlying mechanisms linking hypobicarbonatemia with these adverse outcomes, with particular attention to the underlying acid–base abnormality, and should assess if the treatments to correct such abnormality lead to improved CVD outcomes.
SUPPLEMENTARY DATA
Supplementary data are available at ndt online.
ACKNOWLEDGEMENTS
The SPRINT investigators acknowledge the contribution of study medications (azilsartan and azilsartan combined with chlorthalidone) from Takeda Pharmaceuticals International, Inc. All components of the SPRINT study protocol were designed and implemented by the investigators. The investigative team collected, analyzed and interpreted the data. All aspects of manuscript writing and revision were carried out by the coauthors. The content is solely the responsibility of the authors and does not necessarily represent the official views of the National Institutes of Health (NIH), the US Department of Veterans Affairs or the United States Government. For a full list of contributors to SPRINT, please see the supplementary acknowledgement list: SPRINT Acknowledgment
We also acknowledge the support from the following CTSAs funded by NCATS:
CWRU: UL1TR000439, OSU: UL1RR025755, U Penn: UL1RR024134 and UL1TR000003, Boston: UL1RR025771, Stanford: UL1TR000093, Tufts: UL1RR025752, UL1TR000073 and UL1TR001064, University of Illinois: UL1TR000050, University of Pittsburgh: UL1TR000005, UT Southwestern: 9U54TR000017-06, University of Utah: UL1TR000105-05, Vanderbilt University: UL1 TR000445, George Washington University: UL1TR000075, University of CA, Davis: UL1 TR000002, University of Florida: UL1 TR000064, University of Michigan: UL1TR000433, Tulane University: P30GM103337 COBRE Award NIGMS. M.D. is supported by R01 HL141846-02.
FUNDING
The Systolic Blood Pressure Intervention Trial is funded with Federal funds from the National Institutes of Health (NIH), including the National Heart, Lung, and Blood Institute (NHLBI), the National Institute of Diabetes and Digestive and Kidney Diseases (NIDDK), the National Institute on Aging (NIA), and the National Institute of Neurological Disorders and Stroke (NINDS), under Contract Numbers HHSN268200900040C, HHSN268200900046C, HHSN268200900047C, HHSN268200900048C and HHSN268200900049C, and Inter-Agency Agreement Number A-HL-13-002-001. It was also supported in part with resources and use of facilities through the Department of Veterans Affairs.
AUTHORS’ CONTRIBUTIONS
All authors participated in data acquisition and critical revision of this manuscript. N.M.P. had full access to all the data in the study and takes responsibility for the integrity of the data and the accuracy of the data analysis. M.D. and K.L.R. had primary responsibility for the analytic plan.
CONFLICT OF INTEREST STATEMENT
None declared. The results presented in this paper have not been published previously in whole or part, except in abstract form.
(See related article by Wesson. Serum bicarbonate as a cardiovascular risk factor: evolving from ‘non-traditional’? Nephrol Dial Transplant 2020; 35: 1282--1285)


Comments