


Abstract
Arteriovenous fistulas (AVFs) are the preferred vascular access type in most hemodialysis patients. However, the optimal vascular access type in octogenarians and older (≥80 years) hemodialysis patients remains widely debated given their limited life expectancy and lower AVF maturation rates.
Among incident hemodialysis patients receiving care in a large national dialysis organization during 2007–2011, we examined patterns of vascular access type conversion in 1 year following dialysis initiation in patients <80 versus ≥80 years of age. Among a subcohort of patients ≥80 years of age, we examined the association between vascular access type conversion and mortality using multivariable survival models.
In the overall cohort of 100 804 patients, the prevalence of AVF/arteriovenous graft (AVG) as the primary vascular access type increased during the first year of hemodialysis, but plateaued thereafter. Among 8356 patients ≥80 years of age and treated for >1 year, those with initial AVF/AVG use and placement of AVF from a central venous catheter (CVC) had lower mortality compared with patients with persistent CVC use. When the reference group was changed to patients who had AVF placement from a CVC in the first year of dialysis, those with initial AVF use had similar mortality. A longer duration of CVC use was associated with incrementally worse survival.
Among incident hemodialysis patients ≥80 years of age, placement of an AVF from a CVC within the first year of dialysis had similar mortality compared with initial AVF use. Our data suggest that initial CVC use with later placement of an AVF may be an acceptable option among elderly hemodialysis patients.
INTRODUCTION
In the USA, there has been a rapid rise in the number of elderly patients with end-stage renal disease, who may require different management approaches compared with their nonelderly counterparts [1–3]. Among elderly hemodialysis patients ≥80 years of age, there remain substantial knowledge gaps with respect to the optimal vascular access type in these patients [4, 5]. While associated with better clinical outcomes in the general hemodialysis population [6–9], use of arteriovenous fistulas (AVFs) in elderly hemodialysis patients poses unique challenges given their higher rates of inadequate maturation of vascular access and limited life expectancy [10–12]. Moreover, there remains wide debate as to whether the Fistula First Breakthrough Initiative should be applied to the elderly hemodialysis population [12–15], given operational risks, longer maturation times and emerging data indicating the lack of a survival benefit compared with tunneled dialysis catheter [central venous catheter (CVC)] and/or arteriovenous graft (AVG) use in elderly patients [16–18].
As the vast majority of incident hemodialysis patients initiate dialysis with CVCs as their primary vascular access (70–80%) [19], which may be more common in the elderly, it remains unknown as to whether particular patterns of vascular access use in the early phases of dialysis, including placement of AVFs/AVGs from a CVC, are associated with differential mortality risk in patients ≥80 years of age. Thus we sought to examine patterns of vascular access use within the first year of dialysis among a large, contemporary cohort of incident hemodialysis patients stratified by age from a large national dialysis organization (<80 versus ≥80 years). We additionally investigated whether specific patterns of vascular access use within the first year of dialysis were associated with differential survival among hemodialysis population ≥80 years of age.
MATERIALS AND METHODS
Source population
We conducted a historical cohort study of incident hemodialysis patients receiving care from a large dialysis organization in the USA with comprehensive capture of longitudinal data on patients’ sociodemographics, comorbidities, laboratory tests and clinical characteristics. The original source population was a cohort of 208 820 incident dialysis patients receiving care in one of the large dialysis organization outpatient facilities over a 5-year period (from January 2007 to December 2011). Patients included were those ≥18 years old, received hemodialysis for at least 60 days and had available vascular access type data for at least 1 year after dialysis initiation. Patients excluded were those who were receiving a dialysis modality other than in-center hemodialysis or had missing vascular access data. The study was approved by the Institutional Review Committees of the Los Angeles Biomedical Research Institute at Harbor-UCLA and the University of California Irvine Medical Center.
Exposure ascertainment
In primary analyses, we sought to examine the association between patterns of vascular access use within the first year of hemodialysis and all-cause mortality risk. Longitudinal vascular access type data updated quarterly were obtained from the large dialysis organization database. Patients were categorized according to their patterns of vascular access use: CVC only, CVC to AVF, CVC to AVG, initial AVF use and initial AVG use. Patients with initial AVF or initial AVG use included those who may have transitioned to an alternative vascular access type during the first year of hemodialysis. In sensitivity analyses we also examined the association of the duration of CVC use with all-cause mortality risk. The duration of CVC use was categorized as follows: <3 months, 3–6 months, 6–9 months and >9–12 months.
Sociodemographic, dialysis treatment and laboratory characteristics
Information regarding sociodemographics as well as comorbidities defined by International Classification of Diseases, Revision 9 codes were also obtained from the large dialysis organization database. The Deyo-modified Charlson Comorbidity Index that excluded the presence or absence of kidney disease was estimated from these data [20, 21].
Laboratory tests were measured from blood samples collected predialysis except for postdialysis serum urea nitrogen, and samples were transported to a central laboratory (Deland, FL, USA), typically within 24 h, where they were measured using automated and standardized methods. Most laboratory tests were measured monthly, including serum creatinine, albumin, white blood cell (WBC) count, total iron binding capacity (TIBC), calcium, phosphorus and bicarbonate. Serum intact parathyroid hormone (iPTH) was usually measured at least once per quarter. Hemoglobin was measured weekly to biweekly. Delivered dialysis dose was calculated by single-pool Kt/V using estimating equations. To minimize measurement variability, all repeated measures for each 91-day interval from the date of dialysis initiation were averaged and quarterly mean values in each quarter were used in all analyses.
Outcome ascertainment
The primary outcome of interest was all-cause death. Patients were censored for kidney transplantation, transfer to a nonaffiliated dialysis unit, transfer to an alternative dialysis modality other than in-center thrice-weekly hemodialysis, discontinuation of dialysis, recovery from dialysis treatment or at the end of the study period (31 December 2011).
Statistical analysis
We first examined patterns of vascular access type over time in the overall cohort and stratified by age (<80 versus ≥80 years). Among incident hemodialysis patients ≥80 years old who survived the first year of dialysis, we then examined the association between the various patterns of vascular access use within the first year of treatment and all-cause mortality risk using Cox regression models with four levels of adjustment:
Unadjusted model: included pattern of vascular access use.
Case mix–adjusted model: included age, sex, race/ethnicity, primary insurance type, comorbidities (diabetes mellitus, hypertension, atherosclerotic heart disease, congestive heart failure, other cardiovascular disease, cerebrovascular disease, dyslipidemia, chronic obstructive pulmonary disease, liver disease and history of malignancy) and dialysis dose as measured by single-pool Kt/V.
Case mix + malnutrition inflammation cachexia syndrome (MICS) model: included the case mix–adjusted model covariates, as well as body mass index (BMI) and clinically relevant laboratory variables [WBC count, hemoglobin, serum albumin, creatinine, bicarbonate, calcium, phosphorus, iPTH, total iron binding capacity and normalized protein catabolic rate (nPCR)].
Case mix + albumin model: included the case mix–adjusted model covariates and serum albumin.
We a priori defined the case mix + albumin model as our preferred model to avoid overadjustment even in the group with the smallest number of patients while including core confounders for the association between patterns of vascular access and outcomes. The case mix + MICS model was designated as an exploratory model, which included confounders as well as potential causal pathway intermediates of the vascular access type–mortality association. We also examined the vascular access type–mortality association across clinically relevant subgroups.
There was <1% missing data for all covariates, except BMI (2%), hemoglobin (3%), calcium (5%), phosphorus (5%), WBC (6%), serum albumin (6%), bicarbonate (6%), single-pool Kt/V (6%), nPCR (6%), TIBC (8%), iPTH (8%) and serum creatinine (10%). Missing data were addressed using multiple imputation. Proportional hazards assumptions were checked by graphical testing. All analyses and figures were carried out with Stata MP, version 13.1 (StataCorp, College Station, TX, USA) and SigmaPlot, version 12.5 (Systat Software, San Jose, CA, USA).
RESULTS
Overall cohort: patterns of access type within the first year of dialysis
Among 100 804 patients who met eligibility criteria there were 52 113, 86 698 and 14 106 patients <65, 65–80 and ≥80 years of age, respectively (Supplementary data, Figure S1). In the overall cohort, 80%, 16% and 4% of patients initiated hemodialysis with a CVC, AVF and AVG, respectively. When patients were separately examined as those <65, 65–80 and ≥80 years of age, we observed a similar prevalence of CVC use (81, 78 and 79%, respectively), AVF use (15, 17 and 16%, respectively) and AVG use (3, 5 and 5%, respectively).
When we compared patterns of vascular access use within the first year of hemodialysis, we observed a similar pattern of placement of AVFs/AVGs from CVCs among patients <65, 65–80 and ≥80 years of age (Figure 1). A significant proportion of patients persisted in using a CVC even after 1 year in patients <65, 65–80 and ≥80 years of age (23, 24 and 27%, respectively), and a lower proportion of patients ≥80 years of age underwent placement of an AVF from a CVC after 1 year (patients <65, 65–80 and ≥80 years of age: 45, 40 and 36%, respectively) and over the entire study period.
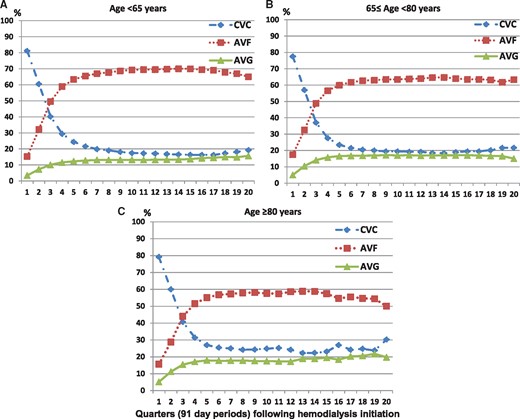
Patterns of vascular access use over time among incident hemodialysis patients (A) <65 years (n = 52 113), (B) 65–80 years (n = 34 585) and (C) ≥80 years of age (n = 14 106).
Elderly subcohort: baseline characteristics according to patterns of access type
We then examined patterns of access type among a subcohort of 8326 patients ≥80 years of age who survived at least 1 year of dialysis. Over the first year of dialysis treatment we observed that 27% of patients persisted in CVC use only, 36% underwent placement of an AVF from a CVC, 13% underwent placement of an AVG from a CVC, 18% used an AVF initially and 6% used an AVG initially (Table 1). Compared with other patients, particularly those who used an AVF initially, those who persisted in having a CVC only tended to be female; were less likely to be Caucasian and more likely to be African American; were more likely to have Medicare/Medicaid as their primary insurance; were more likely to have diabetes, atherosclerotic heart disease, congestive heart failure or other cardiovascular diseases and had lower BMI levels.
Baseline characteristics among incident hemodialysis patients ≥80 years of age stratified by patterns of vascular access type during the first year of dialysis
| Overall cohort | CVC only | CVC to AVF | CVC to AVG | Initial AVF | Initial AVG | |
|---|---|---|---|---|---|---|
| Patients, n (%) | 8326 (100) | 2245 (27) | 3018 (36) | 1063 (13) | 1511 (18) | 489 (6) |
| Age (years), mean ± SD | 84.9 ± 3.3 | 85.3 ± 3.5 | 84.7 ± 3.1* | 85.2 ± 3.2 | 84.6 ± 3.1* | 84.7 ± 3.2* |
| Female, % | 46 | 55 | 39* | 57 | 33* | 58 |
| Race/ethnicity, % | ||||||
| Non-Hispanic Caucasian | 66 | 65 | 70* | 58* | 73* | 52* |
| African American | 18 | 20 | 14* | 25* | 13* | 32* |
| Hispanic | 9 | 9 | 9 | 9 | 8 | 7 |
| Asian | 4 | 3 | 4 | 4 | 4 | 5 |
| Cause for ESRD, % | ||||||
| Diabetes mellitus | 33 | 33 | 33 | 35 | 30 | 34 |
| Hypertension | 44 | 45 | 43 | 42 | 47 | 48 |
| Chronic glomerulonephritis | 7 | 6 | 8 | 8 | 7 | 4 |
| Primary insurance, % | ||||||
| Medicare/ Medicaid | 74 | 75 | 74 | 79* | 69* | 73 |
| Comorbidities, % | ||||||
| Diabetes mellitus | 53 | 53 | 52 | 56 | 49* | 58 |
| Hypertension | 59 | 60 | 59 | 58 | 60 | 61 |
| Atherosclerotic heart disease | 18 | 20 | 17* | 16* | 17* | 16* |
| Congestive heart failure | 38 | 39 | 38 | 42 | 34* | 37 |
| Cerebrovascular disease | 2 | 2 | 2 | 3 | 2 | 1 |
| Other cardiovascular disease | 19 | 21 | 18* | 21 | 16* | 14* |
| Dyslipidemia | 29 | 28 | 29 | 28 | 29 | 30 |
| Cancer | 3 | 3 | 3 | 3 | 4 | 3 |
| COPD | 6 | 6 | 6 | 6 | 4* | 4 |
| Liver disease | 1 | 1 | 1 | 2* | 1 | 0 |
| Charlson comorbidity index | 7 (6–8) | 7 (6–8) | 7 (6–8) | 7 (6–8) | 7 (6–8) | 7 (6–8) |
| Total CVC use for 1 year after HD, days, median (IQR) | 204 (84–338) | 358 (337–364) | 197 (139–264)* | 161 (106–236)* | 0 (0–0)* | 0 (0–29)* |
| Body mass index, median (IQR) | 24.1 (21.4– 27.2) | 23.5 (20.6– 26.8) | 24.3 (21.6–27.4)* | 24.3 (21.4–27.8)* | 24.2 (21.9–27.3)* | 24.4 (21.8–27.3)* |
| Hgb (g/dL), mean ± SD | 11.5 ± 0.9 | 11.6 ± 1.0 | 11.5 ± 0.9 | 11.5 ± 0.9 | 11.5 ± 0.8 | 11.5 ± 0.9* |
| WBC count (×103/µL), mean ± SD | 7.3 ± 2.9 | 7.7 ± 3.4 | 7.3 ± 3.1* | 7.3 ± 2.4* | 6.9 ± 2.1* | 7.0 ± 2.2* |
| Albumin (g/dL), mean ± SD | 3.7 ± 0.4 | 3.6 ± 0.4 | 3.7 ± 0.4* | 3.6 ± 0.4* | 3.8 ± 0.4* | 3.7 ± 0.4* |
| Creatininie (mg/dL), mean ± SD | 5.7 ± 1.9 | 5.4 ± 1.9 | 5.8 ± 1.9* | 5.6 ± 1.8 | 6.0 ± 1.8* | 5.9 ± 1.8* |
| Bicarbonate (mmol/dL), mean ± SD | 23.8 ± 2.8 | 24.0 ± 2.9 | 23.7 ± 2.8* | 23.9 ± 3.0 | 23.8 ± 2.8 | 23.9 ± 2.7 |
| Calcium (mg/dL), mean ± SD | 8.8 ± 0.5 | 8.8 ± 0.6 | 8.8 ± 0.5 | 8.8 ± 0.5 | 8.9 ± 0.5* | 8.9 ± 0.5 |
| Phosphorus (mg/dL), mean ± SD | 4.6 ± 1.0 | 4.7 ± 1.1 | 4.6 ± 1.0 | 4.5 ± 1.0* | 4.6 ± 0.9 | 4.6 ± 1.0 |
| iPTH (ng/mL), median (IQR) | 230 (162–313) | 232 (156–324) | 220 (155–299)* | 227 (161–305)* | 244 (178–327) | 247 (174–326) |
| TIBC (mg/dL), mean ± SD | 212 ± 42 | 203 ± 44 | 214 ± 40* | 211 ± 43* | 219 ± 39* | 212 ± 43* |
| nPNA (g/kg/day), mean ± SD | 0.97 ± 0.26 | 0.94 ± 0.26 | 0.99 ± 0.26* | 0.97 ± 0.27* | 0.99 ± 0.25* | 0.96 ± 0.25 |
| Single-pool Kt/V, mean ± SD | 1.68 ± 0.31 | 1.64 ± 0.31 | 1.68 ± 0.31* | 1.73 ± 0.33* | 1.70 ± 0.29* | 1.73 ± 0.27* |
P < 0.05 compared with CVC only.
ESRD, end-stage renal disease; Hgb, hemoglobin; IQR, interquartile range.
Elderly subcohort: patterns of access type and mortality risk
We then sought to examine the association between patterns of access type and mortality risk among the aforementioned subcohort of patients ≥80 years of age who survived at least 1 year of dialysis. Among these patients, there were 3410 deaths over a follow-up period of 9808 person-years. The median follow-up was 23 (interquartile range 17–34) months. In case mix + albumin–adjusted analyses (‘primary analyses’), compared to patients with persistent CVC use, those with initial AVF use, placement of an AVF from a CVC and initial AVG use had lower mortality risk, whereas those with placement of an AVG from a CVC had similar mortality risk (Figure 2 and Supplementary data, Table S2). When the reference group was changed to patients with placement of an AVF from a CVC, those with initial AVF use had similar mortality risk {hazard ratio [HR] 0.92 [95% confidence interval (CI) 0.82–1.02]}, whereas those with placement of an AVG from a CVC had worse survival [HR 1.14 (95% CI 1.01–1.27)]. Patients <65 and 65–80 years of age showed a similar association of mortality risk with access conversion within 1 year of dialysis. Those with initial AVF or AVG use and placement of an AVF from a CVC had lower mortality risk compared with patients exclusively using a CVC within 1 year of dialysis in case mix + albumin–adjusted analyses. However, it was different from patients ≥80 years of age, in that patients with placement of an AVF from a CVC had worse survival compared with initial AVF use in both age groups [HR 1.13 (95% CI 1.04–1.24) and 1.27 (1.17–1.37), respectively; Supplementary data, Figure S2]. Among 5780 patients who were followed up <1 year, there were 2784 of deaths within 1 year of dialysis. Sixty-five percent of those patients exclusively used a CVC, and they had a lower survival compared with patients having an initial AVF or AVG (Supplementary data, Figure S3).
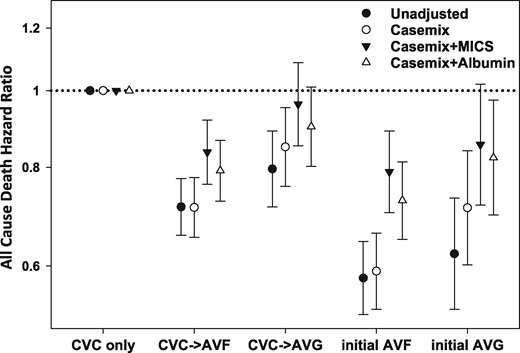
Unadjusted and adjusted HRs and 95% CIs for all-cause mortality associated with the pattern of vascular access type within the first year of hemodialysis (reference: CVC use only group). Unadjusted model included the pattern of vascular access use; case mix–adjusted model included the unadjusted model covariates, as well as age, sex, race/ethnicity, primary insurance type, comorbid conditions (diabetes mellitus, hypertension, atherosclerotic heart disease, congestive heart failure, other cardiovascular disease, cerebrovascular disease, dyslipidemia, chronic obstructive pulmonary disease, liver disease and history of malignancy) and dialysis dose as measured by single-pool Kt/V; case mix + MICS model included the case mix–adjusted model covariates, as well as BMI and clinically relevant laboratory variables (WBC count, hemoglobin, serum albumin, creatinine, bicarbonate, uncorrected calcium, phosphorus, iPTH, total iron binding capacity and nPCR); case mix + albumin model included the case mix–adjusted model covariates, as well as serum albumin.
We then conducted subgroup analyses in which we compared each pattern of vascular access type during the first year of dialysis in models adjusted for case mix + albumin. Compared with persistent CVC use, placement of an AVF from a CVC was associated with a lower mortality risk in all subgroups (Figure 3A and Supplementary data, Table S3). In contrast, compared with persistent CVC use, placement of an AVG from a CVC was associated with a similar mortality risk in all subgroups, except those who were >85 years of age and female patients, in whom placement of an AVG from a CVC was associated with lower mortality (Figure 3B). Compared with persistent CVC use, initial AVF use was associated with a lower mortality risk in all subgroups, except those who had serum albumin levels ≤3.5g/dL, in whom initial AVF use was associated with a similar mortality risk (Figure 3C). Compared with persistent CVC use, initial AVG use was associated with lower mortality risk in all subgroups except those who were 80–85 years of age, males, Whites, nondiabetics, patients without congestive heart failure, those with Charlson Comorbidity Index scores >7 and those with serum albumin ≤3.5 g/dL (Figure 3D).
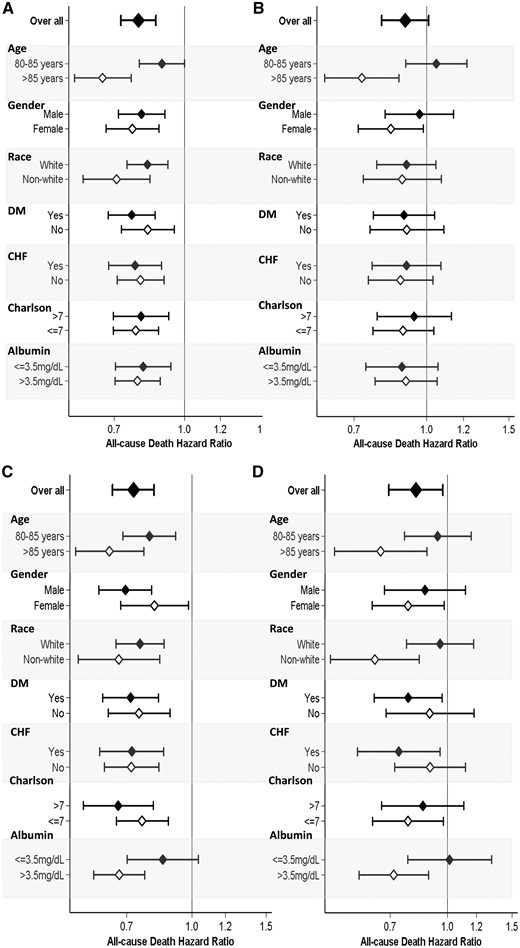
Forest plot of all-cause mortality associated with vascular access type pattern, categorized as placement of (A) an AVF from a CVC, (B) a CVC to an AVG, (C) initial AVF use and (D) initial AVG use during the first year after hemodialysis initiation (reference: CVC use only group) across clinically relevant subgroups. Adjusted for case mix + albumin covariates, including age, sex, race/ethnicity, primary insurance type, comorbid conditions (diabetes mellitus, hypertension, atherosclerotic heart disease, congestive heart failure, other cardiovascular disease, cerebrovascular disease, dyslipidemia, chronic obstructive pulmonary disease, liver disease and history of malignancy), single-pool Kt/V and serum albumin.
Duration of CVC use and mortality risk among elderly incident hemodialysis patients
We then sought to examine the association of the duration of CVC use within the first year of dialysis with all-cause mortality risk among patients ≥80 years of age. We observed that 26, 20, 17 and 37% of patients had CVC use persisting ≤3 months, <3 to ≤6 months, <6 to ≤9 months and <9 to ≤12 months, respectively. In unadjusted, case mix, case mix + MICS and case mix + albumin–adjusted models, longer durations of CVC use within the first year of dialysis were associated with incrementally higher mortality risk (Figure 4 and Supplementary data, Table S4).
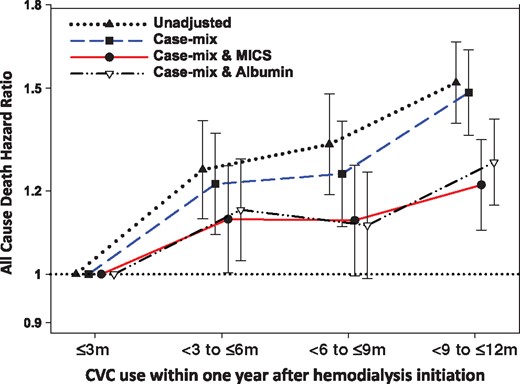
Unadjusted and adjusted HRs and 95% CIs for all-cause mortality associated with the duration of CVC use for hemodialysis within 1 year after dialysis initiation (reference: CVC use ≤3 months). Unadjusted model included the pattern of vascular access use; case mix–adjusted model included the unadjusted model covariates, as well as age, sex, race/ethnicity, primary insurance type, comorbid conditions (diabetes mellitus, hypertension, atherosclerotic heart disease, congestive heart failure, other cardiovascular disease, cerebrovascular disease, dyslipidemia, chronic obstructive pulmonary disease, liver disease and history of malignancy) and dialysis dose as measured by single-pool Kt/V; case mix + MICS model included the case mix–adjusted model covariates, as well as BMI and clinically relevant laboratory variables (WBC count, hemoglobin, serum albumin, creatinine, bicarbonate, uncorrected calcium, phosphorus, iPTH, total iron binding capacity and nPCR); case mix + albumin model: included the case mix–adjusted model covariates, as well as serum albumin.
DISCUSSION
Among a nationally representative cohort of elderly (≥80 years of age) incident hemodialysis patients who survived the first year of dialysis, compared with patients with persistent CVC use, those with initial AVF or AVG use and placement of an AVF from a CVC had a lower risk of death, whereas those with placement of an AVG from a CVC demonstrated similar mortality. When the reference group was changed to patients with placement of an AVF from a CVC, those with initial AVF use had a similar mortality risk, whereas those with placement of an AVG from a CVC had worse survival. Within the same cohort, we also observed that an incrementally longer duration of CVC use within the first year of dialysis was associated with increasingly higher mortality risk.
Successful creation of a functioning vascular access is of the utmost importance to hemodialysis patients, given that it is their ‘lifeline’ for survival. However, vascular access procedures and ensuing complications represent a major source of morbidity in this population [22–25]. While it is widely established that an AVF is a preferred vascular access type given its lower tendency for infection and thrombosis [6, 26–28] and greater longevity [8, 9, 29], the use of CVCs among hemodialysis patients remains high [30, 31]. According to US Renal Data System data, >80% of incident hemodialysis patients initiate treatment with a CVC as their primary vascular access [19, 32]. Moreover, a large proportion of hemodialysis patients who initiate treatment with a CVC do not transition to a permanent vascular access within 90 days (59%), particularly in older (>75 years of age) patients [33].
In our study we observed a similar prevalence of placement of an AVF/AVG from a CVC within 90 days of initiating dialysis among patients <80 versus ≥80 years of age. While placement of an AVF/AVG gradually increased over time, there was a higher proportion of patients ≥80 years of age who persisted in CVC dependency 1 year after dialysis treatment compared with those <80 years of age. While our study did not specifically investigate reasons for delayed placement of an AVF from a CVC, it has been suggested that a greater burden of peripheral vascular disease as well as suboptimal or absent forearm veins are risk factors for delayed maturation of AVFs in this population [34, 35]. In addition, several aspects of CVCs, including immediate readiness of use, relative ease of placement and the absence of pain with cannulation may make this an appealing vascular access option among elderly hemodialysis patients with limited life expectancy [5, 36, 37]. Indeed, a recent study reported that two-thirds of deceased elderly hemodialysis patients who underwent AVF placement died before use of the vascular access [35]. Given the unique challenges of immediate AVF use among elderly hemodialysis patients, we aimed to determine whether initial CVC use with subsequent placement of an AVF or AVG within 1 year of dialysis initiation was associated with better survival versus persistent CVC use in this population.
To our knowledge, this is the first study to demonstrate that elderly patients who initiated hemodialysis with CVCs yet underwent placement of an AVF within 1 year had similar survival compared with those who initiated dialysis using AVFs as their primary vascular access. In addition, we report for the first time that a longer duration of CVC use is incrementally associated with a higher death risk in the elderly hemodialysis population. While multiple studies have demonstrated the superiority of AVFs/AVGs versus CVCs upon survival in elderly hemodialysis patients [13, 38–41], they typically have focused on vascular access at the time of dialysis initiation and have not been able to account for confounding on the basis of predialysis care (i.e. patients who initiated hemodialysis with a functioning AVF/AVG may have had better access to or compliance with pre-dialysis nephrology care). It has been suggested that patients’ underlying conditions during the predialysis period have a greater impact on outcomes than the effect of access itself [18, 42, 43], and the survival benefits of AVFs/AVGs over CVCs may be minimal among patients who are at higher risk of AVF/AVG failure (i.e. older age, female, diabetic) [44]. However, we observed that, compared with persistent CVC use, placement of an AVF from a CVC within the first year of dialysis was associated with better survival across all subgroups among elderly hemodialysis patients.
Debate continues regarding the superiority of AVFs versus AVGs among elderly hemodialysis patients. Given that AVGs have comparatively shorter maturation times and lower rates of primary failure, it has been suggested that they may be a more suitable vascular access option among elderly patients with a higher likelihood of vascular insufficiency and limited life expectancy [34, 37]. Recent data also suggest that AVGs are associated with similar microorganism detection rates and survival as compared with AVFs in elderly hemodialysis patients [5]. However, we observed that placement of an AVG from a CVC was associated with similar mortality risk as with persistent CVC use and higher mortality risk compared with placement of an AVF from a CVC among the oldest hemodialysis patients. These observations may potentially be explained by the poorer long-term patency and higher risk of complications of AVGs versus AVFs, including thrombosis and infection, leading to a greater number of secondary interventions that may carry potential risk in elderly hemodialysis patients [45, 46]. Given that age has not been found to be a potent determinant of AVF patency across multiple studies [47–50], it may be inferred from our data that AVF should remain as the preferred vascular access type in this population. However, among patients in whom there may be a delay in placement of an AVF from a CVC due to poor maturation or primary access failure, given the high mortality risk observed with a longer duration of CVC use, AVGs may need to be considered as a viable option.
The strengths of our study include its examination of a large, nationally representative cohort of dialysis patients, examination of incident hemodialysis patients whose characteristics are not confounded by survivor bias and the comprehensive availability of detailed, longitudinal patient-level comorbidity, laboratory and dialysis-treatment data, including vascular access type. However, several limitations bear mentioning. First, we lacked information on the status of access such as blood flow rate and secondary vascular access complications, including vascular access thrombosis, infection, and nonmaturation, as well as interventions. Second, we were unable to account for the access creation process, such as who was responsible for access creation and confounding on the basis of surgeon experience and training. Third, due to data limitations, we could not examine cause-specific mortality (e.g. infection-related mortality) to better elucidate underlying mechanisms of the vascular access type–mortality association. Fourth, the analysis was restricted to patients who survived at least 1 year following dialysis initiation in order to ascertain vascular access patterns over this period. Lastly, as with all observational studies, our study does not confirm a causal association between patterns of vascular access and mortality.
In conclusion, among incident hemodialysis patients ≥80 years of age, compared with patients with persistent CVC use, placement of an AVF from a CVC was associated with lower mortality risk, whereas those who had placement of an AVG from a CVC had a similar mortality risk. We also observed that with placement of an AVF from a CVC was associated with similar mortality as compared with initial AVF use in this population. Moreover, we found that an incrementally longer duration of CVC use within the first year of dialysis was associated with increasingly higher mortality risk among patients ≥80 years of age. Future studies are needed to determine the underlying mechanisms and to develop individualized vascular access management strategies among specific patient populations.
ACKNOWLEDGEMENTS
We thank DaVita Clinical Research for providing clinical data for this study.
FUNDING
This work is supported by National Institute of Diabetes and Digestive and Kidney Diseases (NIDDK) grant K24-DK091419 (to K.K.-Z.) and philanthropic grants from Harold Simmons, Louis Chang and Dr. Joseph Lee. C.P.K. and K.K.-Z. are supported by NIDDK grants R01-DK096920 and U01-DK102163. C.M.R. is supported by the NIDDK grants K23-DK102903 and R03-DK114642. E.S. is supported by a career development award from the Office of Research and Development of the Department of Veterans Affairs (IK2-CX001266-01). Y.O. is supported by the Uehara Memorial Foundation Research Fellowship.
AUTHORS’ CONTRIBUTIONS
G.J.K. collected and analyzed data and wrote the manuscript. C.M.R. and Y.O. analyzed data and edited the manuscript. T.I.C., M.S., E.S. and T.W.K. analyzed data. C.P.K. edited the manuscript. K.K.-Z. interpreted and organized results and edited the manuscript.
CONFLICT OF INTEREST STATEMENT
K.K.-Z. received honoraria from Genzyme/Sanofi and Shire and was the medical director of DaVita Harbor-UCLA/MFI in Long Beach, CA, USA during 2007–2012. Other authors have not declared any conflict of interest.


Comments