


Abstract
Cardiovascular morbidity and mortality is high in patients starting dialysis and could be related to modifications of calcification inducers and inhibitors by dialysis, promoting cardiovascular events. The impact of dialysis initiation on serum calcification propensity evolution and arterial stiffness is unknown. We therefore prospectively determined the evolution of the one-half maximal transition time (T50) value and its main determinants as well as pulse wave velocity over the first 3 months of dialysis initiation.
We analysed the evolution of T50, fetuin-A and mineral metabolism parameters before dialysis initiation (M0) and monthly until Month 3 (M3) in incident patients starting haemodialysis (HD) or peritoneal dialysis (PD) in two tertiary Swiss university hospitals. Arterial stiffness was assessed by pulse tonometry at M0 and M3 and biological parameters were compared between M0 and M3 and before/after HD. Linear mixed models were used to assess parameter evolution over time, taking into account repeated measures and other influencing variables.
Forty-six patients on HD and 12 on PD were followed. Among them, 45 were male (78%) with a median age of 67 years (25th–75th quartile range 54–77). T50 significantly increased between M0 and M3 from 183 (120–266) to 246 min (175–330) (P < 0.001). Fetuin-A, calcium and magnesium also increased while phosphate decreased. Factors associated with T50 changes over time were fetuin-A, phosphate and magnesium (P < 0.001). Fetuin-A changes were associated with inflammation-related factors (albumin, C-reactive protein) but not calcium and phosphate levels. Arterial stiffness was not significantly modified over 3 months. PD and HD initiation showed similar trends.
Dialysis initiation significantly improves calcification propensity and fetuin-A levels. These modifications do not explain the high mortality related to dialysis initiation. The clinical relevance of using T50 values to initiate dialysis awaits further studies.
INTRODUCTION
Chronic kidney disease (CKD) engenders major cardiovascular (CV) mortality [1]. Haemodialysis (HD) and peritoneal dialysis (PD) are initiated at CKD Stage 5 mostly in symptomatic uraemic patients to mitigate complications. However, an excessively high mortality rate is observed during the first 3 months after dialysis initiation as compared with the period thereafter, mainly due to CV events [2]. For this reason, the issue of timing of dialysis initiation is still debated and has not been settled [3, 4]. Why dialysis initiation is associated with a high rate of CV events is incompletely understood. Several hypotheses have been proposed, such as vascular access problems or dialysis-induced myocardial dysfunction or stunning [5]. Others have suggested that cardiovascular events are triggered by acute alterations in mineral metabolism that favour vascular stiffness and calcifications, but prospective studies that have focused on these properties in the early dialysis period are largely lacking. Also, until recently, no clinical tests have been available to assess the propensity of blood to promote or inhibit vascular calcifications [6, 7].
The one-half maximal transition time (T50) test [8] was developed for the assessment of serum calcification propensity. T50 measures the capacity of serum to inhibit the formation of calciprotein particles (crystalline phosphate particles or CPP) in vitro: a higher T50 value reflects delayed particle formation and is clinically associated with lower arterial stiffness and lower cardiovascular mortality in pre-dialysis, dialysis and kidney allograft patients [9]. Among CKD Stages 2–4, a lower T50 value has recently been associated with coronary artery calcification progression [10].
The effect of dialysis initiation on calcification propensity is currently unknown. In theory, dialysis may improve (increase) the T50 value by decreasing plasma phosphate. A cross-sectional study showed that dialysis sessions improve T50 mainly driven by phosphate changes [11]. However, dialysis initiation may also have effects on magnesium and other calcifications inhibitors that are less well described. Indeed, magnesium, which is a major calcification inhibitor [12, 13], is retained during CKD and potentially lost by dialysis initiation depending on the dialysate concentration. Magnesium levels are inversely associated with mortality during dialysis [14, 15]. T50 is lower in the HD compared with the pre-dialysis population, which may be interpreted as a deleterious effect of dialysis on T50 [9, 16]. Therefore the net effect of dialysis initiation on serum calcification propensity remains unknown.
Pulse wave velocity (PWV) is a non-invasive measurement of arterial stiffness: the higher the PWV, the stiffer the arteries. In CKD, transplant or dialysis patients, PWV is positively correlated to CV mortality and changes in PWV also predict changes in CV mortality [17–20]. The central augmentation index (AI) and augmented pressure (AP) are other parameters derived from central pulse wave analysis giving additional information on the vasculature quality [21]. The identification of changes in these parameters and T50 could potentially provide insights into the mechanism of increased cardiovascular risk during dialysis initiation.
In this study we hypothesized that dialysis initiation could modify T50 and PWV over the first 3 months by changing the concentration of calcification inhibitors, such as magnesium and fetuin, and arterial properties, which could contribute to the increased mortality observed at dialysis initiation.
MATERIALS AND METHODS
Design and study population
From January 2016 to February 2018, we conducted a prospective observational study on incident dialysis patients. Patient recruitment took place in the university hospitals of Geneva and Lausanne, Switzerland.
All adult patients (>18 years) on CKD Stage 5 initiating chronic dialysis, i.e. either HD or PD, and agreeing to have the follow-up were included. Patients with acute kidney injury, on high cut-off dialysis or changing dialysis modality were excluded. All study participants provided written consent. The study was approved by the ethics committee (GE 15-223) and was performed according to the Declaration of Helsinki and good clinical practice guidelines.
The first aim was to observe the changes in T50 from baseline to 3 months into dialysis and to correlate changes in calcium, phosphate, albumin, magnesium, bicarbonate and fetuin-A to changes in T50. Secondary aims were to observe the effect of 3 months of dialysis on PWV in parallel with T50 changes.
Clinical and laboratory measures
Baseline demographic and cardiovascular risk factors were recorded. Medication and clinical parameters were collected at each time point. Cardiovascular events, death, transplant and other events were reported.
The first blood sample was taken before dialysis initiation on the day of the first dialysis session and then at 1, 2 and 3 months. In patients on HD, blood was drawn before and directly after the dialysis sessions. Serum and plasma samples were taken for routine blood tests and stored at −80°C after centrifugation. Routine workup included monthly measurement of blood cell count, sodium, potassium, bicarbonate (CO2tot), urea, creatinine, total and corrected calcium (Catot and Cacorr), phosphate (PO4), magnesium (Mg), albumin, C-reactive protein (CRP), parathyroid hormone (PTH) and vitamin D. For HD patients, urea, calcium, phosphate, magnesium and albumin were also measured after dialysis sessions.
Dialysis was initiated according to local practice by the treating nephrologist independent of this study. HD initiation was performed with short (2–3 h) HD dialysis sessions during the first 3 days on a low-flux, small membrane, usually without ultrafiltration. Later, patients were dialysed 3 times per week for 4 h using a high-flux, large filter membrane and by haemodiafiltration (HDF) and aiming for a reinjection volume of >20 L. PD prescription was individualized for each patient. HD dialysate was standardized in all participating centres: calcium 1.5 mmol/L, magnesium 0.75 mmol/L, bicarbonate 31 mmol/L, potassium 3 mmol/L and isonatraemic sodium concentration.
Baseline characteristics at dialysis initiation
| Variables | All (n = 58) | HD (n = 46) | PD (n = 12) |
|---|---|---|---|
| Age | 67.0 (54.0–77.0) | 67.0 (54.0–77.0) | 66.5 (54.5–84.5) |
| Weight (kg) | 75 (62.0–87) | 75.3 (66.1–87.7) | 68.5 (52.0–85) |
| Men, n (%) | 45 (78) | 36 (78.) | 9 (75) |
| Caucasian, n (%) | 40 (70) | 31 (67) | 9 (75) |
| Diabetes, n (%) | 28 (48) | 24 (52) | 4 (33) |
| IHD, n (%) | 17 (29) | 14 (30) | 3 (25) |
| HT, n (%) | 51 (88) | 41 (89.1) | 10 (83) |
| Smoking, n (%) | 9 (16) | 9 (20) | 0 (0) |
| Statins, n (%) | 26 (45) | 25 (54) | 7 (58) |
| Aspirin,a n (%) | 27 (47) | 20 (44) | 7 (58) |
| Active vitamin D, n (%) | 12 (21) | 9 (20) | 3 (25) |
| Native vitamin D, n (%) | 34 (59) | 27 (59) | 7 (58) |
| Non-calcium phosphate binders, n (%) | 26 (45) | 23 (51) | 3 (25) |
| SBP (mmHg) | 138 (123–150) | 139 (126–151) | 136 (120–143) |
| DBP (mmHg) | 73 (65–85) | 73 (67–81) | 69.5 (61–89) |
| eGFR (mL/min/ 1.73 m2) | 9 (7–11) | 8 (7–10) | 10.5 (6–12) |
Values are presented as median (25th–75th quartile range) unless stated otherwise.
One was taking clopidogrel.
IHD, ischaemic heart disease; HT, hypertension; SBP, systolic blood pressure; DBP, diastolic blood pressure; eGFR, estimated glomerular filtration rate.
T50 and fetuin
T50 and fetuin-A were measured in serum as described previously [8]. In short, for the T50 test, serum was mixed with concentrated calcium and phosphate solutions and the transformation from CPP1 to CPP2 was monitored nephelometrically. For the determination of fetuin-A concentrations, a polyclonal rabbit–anti-human fetuin-A antibody was mixed with serum and the cross-linking-induced precipitation of fetuin-A was quantified nephelometrically [22]. The intra-laboratory precision of the two methods is <5.5% and <6.5% for T50 and fetuin-A, respectively.
PWV measurement
For logistical reasons, PWV measurements could only be performed in Geneva at baseline and after 3 months. The arterial waveform was assessed in the supine position after 15 min of rest by applying a tonometer at the carotid, radial and femoral arteries. SphygmoCor version 8.2 (AtCor Medical, West Ryde, New South Wales, Australia) was used according to the previously described methodology [23]. Carotid–femoral and carotid–radial PWV were directly measured and a validated transfer function was used to obtain the central AI adjusted for heart frequency and central AP as central haemodynamic parameters [24]. AP is the difference between the second and the first systolic peaks; AI is the ratio of AP to aortic pulse pressure calculated as the difference between respective systolic and diastolic pressure. The same examiner (Belen Ponte) performed all exams.
Statistical methods
Continuous variables are described as mean ± standard deviation (SD) or median and interquartile range (IQR; 25th–75th quartile range) and categorical ones as number (%). For descriptive analyses, we used non-parametric Wilcoxon and chi-square or Fisher’s exact tests as appropriate to compare baseline characteristics between dialysis modalities. Only CRP was log-transformed for the analysis. For comparisons of continuous laboratory variables between baseline and 3 months, a non-parametric paired test was used displayed as a boxplot showing median values. The effect of dialysis was also analysed by a non-parametric paired test comparing values before and after the dialysis session. Comparisons are shown only at 3 months during a 4 h dialysis in a stable situation. Parameters obtained from the SphygmoCor measure were compared before and 3 months after dialysis initiation by non-parametric paired tests.
Longitudinal data were analysed using linear mixed models for repeated measures. Time was entered as a categorical fixed-effects variable and the participant identity as a random effect. We first analysed the effect of time on each biological parameter separately. Then we constructed a model to look at the effect of each biological parameter on T50, taking time into account. Finally, multivariate models were constructed with all potential biological factors. For multivariate analysis looking at the effect of changes in biological parameters on T50 and fetuin-A, covariates were entered as fixed effects. The normality of the residuals was tested and the standardized residuals were plotted against the predicted values to confirm normal distribution.
Stata 14 (StataCorp, College Station, TX, USA) was used for the analyses. A P-value <0.05 was considered statistically significant.
Sample size calculation
For the power calculation, we estimated that a change in 0.5 SD of T50 would be clinically relevant and assumed a mean T50 in HD patients of 215 min and an SD of 84 min [25]. The maximal number of patients needed was 40 for a power of 0.9 (30 for a power of 0.8) and α = 0.05. To account for mortality or loss of follow-up at 3 months, we chose to include at least 50 patients.
RESULTS
General characteristics
From January 2016 to February 2018, we included 58 incident patients initiating either HD or PD in Geneva (n = 47) and Lausanne (n = 11). There were 46 HD and 12 PD patients. All patients on PD had a planned dialysis start. As for HD, a total of 12 (28.6%) patients needed an acute start: 4 in Lausanne and 8 in Geneva. Regarding the indication, six of them had uraemic symptoms, four fluid overload, one hyperkalaemia and one both uraemic symptoms and fluid overload.
Table 1 describes their general characteristics: there were no differences between the dialysis modalities (all P > 0.1). Most patients were male (78%), Caucasian (70%), with a median age of 67 (25th–75th quartile range 54–77) years. Concerning cardiovascular risk factors: 48% were diabetic, 88% suffered from hypertension, 16% were active smokers and 29% had known ischaemic coronary heart disease. Regarding the medication at study entry, 45% were treated with non-calcium phosphate binders; only HD patients were taking calcium-containing phosphate binders [n = 15 (26%)]. Most patients (59%) were on native vitamin D, while 21% were taking active vitamin D.
During the 3-month follow-up, 2 patients died, 2 stopped dialysis, 1 was transplanted and 3 moved away, leaving 50 patients with full sets of follow-up data (38 in HD and 12 in PD). Five patients developed an acute cardiovascular event. There was no dialysis modality change.
Evolution between baseline and 3 months
When analysing all patients independent of dialysis modality, T50, fetuin-A, calcium and magnesium increased significantly between dialysis initiation (M0) and 3 months (M3) (Figure 1). Phosphate and CRP were the only parameters that decreased significantly, whereas bicarbonate and albumin levels remained unchanged. T50 was strongly inversely correlated with phosphate levels (Supplementary data, Figure S1). The median difference in weight between baseline and 3 months for those having both measures was −0.4 (IQR −5.9–1.0) kg, so there was no significant change (P = 0.10). There was no correlation between magnesium levels and weight changes (Pearson coefficient −0.07; P = 0.97), excluding an effect of haemoconcentration of magnesium.
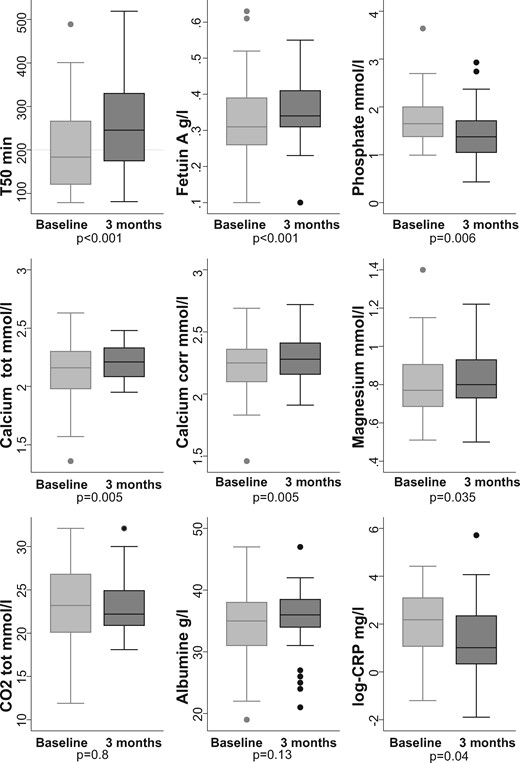
Evolution of mineral metabolism from baseline to 3 months after dialysis initiation in all patients (n = 50).
When analysing by dialysis modality, T50 increased between M0 and M3 (Figure 2). Most significant changes observed in the whole population were also observed when data were analysed according to treatment modality. Although changes were not significant in the small group of PD patients except for fetuin-A (P = 0.045). There was a significant difference in T50 and calcium at baseline between HD and PD (¥ in Figure 2).
Arterial stiffness and central haemodynamic parameters were measured in 32 participants at M0 and M3. PWV and AI were not significantly modified by dialysis initiation, but the central AP decreased significantly (Figure 3).

Arterial stiffness evolution from baseline to 3 months after dialysis initiation (n = 32). cfPWV, carotid-femoral PWV (m/s); Aix(75), heart-rate adjusted central AI (%); AP, central AP (mmHg).
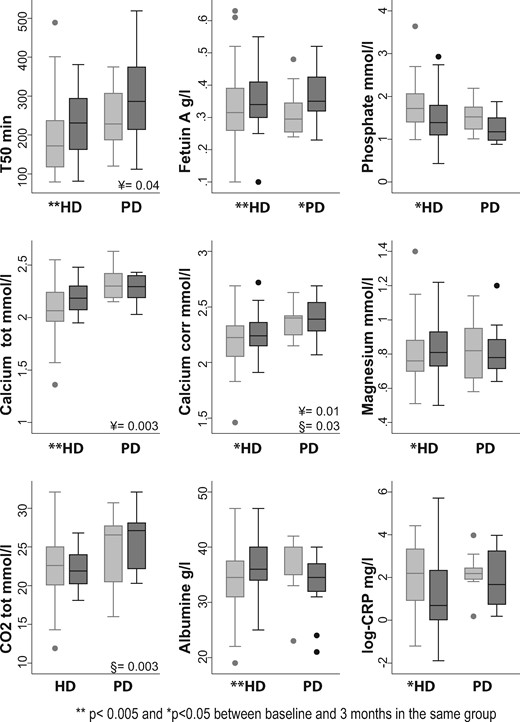
Evolution of mineral metabolism from baseline to 3 months after dialysis initiation by dialysis modality: HD (n = 38) and PD (n = 18). Light grey boxes are baseline values, dark grey boxes are 3-month values. ¥, P-value rank-sum test comparing baseline HD and PD values. §, P-value rank-sum test comparing 3-month HD and PD values. **P < 0.005; *P < 0.05 between baseline and 3 months in the same group.
Evolution of laboratory values taking into account all time points
We conducted mixed linear analysis to account for each time point. The main laboratory results are presented in Table 2, taking into account each time point during the follow-up period: baseline, 1, 2 and 3 months. The P-value describes the whole effect of time on the biological data. We observed an increase in T50, fetuin-A, calcium and 25-hydroxyvitamin D over time as well as a decrease in phosphate and CRP, and a trend in PTH levels. Albumin, magnesium and bicarbonate (CO2tot) did not change over time in this analysis.
Evolution of all biological values (mean ± SD) over 3 monthsa: univariate mixed analysis taking into account repeated values and time
| Measures | Baseline | First month | Second month | Third month | P-value |
|---|---|---|---|---|---|
| (n = 58) | (n = 54) | (n = 44) | (n = 50) | ||
| T50 (min) | 200 ± 91 | 270 ± 79 | 260 ± 90 | 250 ± 101 | <0.001 |
| Fetuin-A (g/L) | 0.3 ± 0.1 | 0.4 ± 0.1 | 0.4 ± 0.1 | 0.35 ± 0.08 | <0.001 |
| Catot (mmol/L) | 2.1 ± 0.2 | 2.2 ± 0.2 | 2.2 ± 0.2 | 2.2 ± 0.2 | 0.002 |
| Cacorr (mmol/L) | 2.2 ± 0.2 | 2.3 ± 0.2 | 2.3 ± 0.2 | 2.3 ± 0.2 | 0.01 |
| Alb (g/L) | 34.6 ± 5.8 | 34.9 ± 5.4 | 35.4 ± 5.2 | 35.6 ± 5.0 | 0.39 |
| PO4 (mmol/L) | 1.7 ± 0.5 | 1.4 ± 0.5 | 1.5 ± 0.5 | 1.4 ± 0.5 | <0.001 |
| Mg (mmol/L) | 0.8 ± 0.2 | 0.8 ± 0.1 | 0.8 ± 0.2 | 0.8 ± 0.1 | 0.22 |
| CO2tot (mmol/L) | 22.9 ± 4.7 | 24.2 ± 3.17 | 22.7 ± 3.4 | 23.0 ± 3.3 | 0.08 |
| CRP (mg/L) | 18.1 ± 21.5 | 13.3 ± 31.9 | 13.7 ± 23.6 | 16.2 ± 47.3 | – |
| Log-CRP (mg/L)b | 2.1 ± 1.5 | 1.6 ± 1.4 | 1.5 ± 1.5 | 1.4 ± 1.6 | 0.02 |
| PTH (pmol/L) | 44.2 ± 30.7 | 35.9 ± 28.4 | 34.9 ± 29.6 | 37.1 ± 37.6 | 0.04 |
| 25(OH)D (nmol/L) | 49.0 ± 22.0 | 55.6 ± 25.9 | 60.6 ± 25.0 | 60.9 ± 25.7 | 0.02 |
Significant P-values <0.05 are in bold.
For HD patients, all the values are before the HD session.
CRP log-transformed: better for linear assumptions.
Alb, albumin; 25(OH)D, 25-hydroxyvitamin D.
Factors associated with changes in T50 over time—multivariate analysis
The effect of each covariate on T50, taking time into account, is shown in Table 3. In univariate analyses, all laboratory variables were associated with T50 changes except vitamin D and PTH (Table 3). In multivariate analysis, taking into account the time, factors associated with a change in T50 were changes in fetuin-A, phosphate, magnesium (all P < 0.001) and CO2tot, but not calcium, albumin, CRP, PTH or vitamin D.
Multivariate analysis for factors associated with T50 taking into account all patients and the repeated measures
| Outcome | Univariate | Multivariate – final | ||||
|---|---|---|---|---|---|---|
| Coefficient | 95% CI | P-value | Coefficient | 95% CI | P-value | |
| Fetuin-A (g/L) | 474.2 | 332.3–616.0 | <0.001 | 587.8 | 471.5–704.2 | <0.001 |
| Catot (mmol/L) | 143.0 | 76.1–209.8 | <0.001 | – | – | – |
| Alb (g/L) | 3.0 | 0.4–5.6 | 0.023 | – | – | – |
| PO4 (mmol/L) | −80.9 | −100.5 to −61.2 | <0.001 | −101.2 | −117.2 to −85.3 | <0.001 |
| Mg (mmol/L) | 132.9 | 43.4–222.4 | 0.004 | 125.3 | 60.2–190.3 | <0.001 |
| CO2tot (mmol/L) | 4.9 | 1.8–8.1 | 0.002 | 3.0 | 0.8–5.2 | 0.008 |
| Log-CRP (mg/L) | −9.3 | −18.8–0.2 | 0.056 | – | – | – |
| PTH (pmol/L) | −0.1 | −0.6–0.4 | 0.74 | – | – | – |
| 25(OH)D (nmol/L) | 0.3 | −0.2–0.9 | 0.19 | – | – | – |
All models were adjusted for time to take into account repeated measures. Significant P-values <0.05 are in bold.
Alb, albumin; Log-CRP, log-transformed CRP; 25(OH)D, 25-hydroxyvitamin D.
Factors associated with changes in fetuin-A over time—multivariate analysis
In univariate analyses, the factors most strongly associated with fetuin-A were albumin {coefficient per 10 g/L 0.07 [95% confidence interval (CI): 0.04–0.08]} and CRP [coefficient per 1 log −0.02 (95% CI −0.03 to −0.01)] then calcium [coefficient −0.08 (95% CI 0.03–0.12)] and magnesium [coefficient 0.07 (95% CI 0.005–0.14)].
In multivariate analyses, only inflammatory markers (albumin and CRP) were associated with changes in fetuin-A over time and not with mineral metabolism parameters. Each increase in 10 units of albumin was associated with an increase in fetuin-A of 0.05 on average (95% CI 0.03–0.07) and each increase in 1 log of CRP was associated with a decrease in fetuin-A of 0.015 (95% CI −0.02 to −0.01) (both P < 0.001).
Effect of dialysis at 3 months
In HD, we additionally assessed the effect of a single dialysis session at 3 months (Table 4). T50, fetuin-A, calcium and albumin all increased (P < 0.01), while phosphate and magnesium decreased (P < 0.001) during a single dialysis session. There were no correlations between fetuin-A or albumin changes and ultrafiltration or weight loss during dialysis (data not shown).
Biological parameters before and after the HD session at 3 months (n = 38)
| Measure | Before HD | After HD | P-value |
|---|---|---|---|
| T50 (min) | 231 | 330 | <0.001 |
| (163–294) | (301–377) | ||
| Fetuin-A (g/L) | 0.3 | 0.4 | 0.005 |
| (0.3–0.4) | (0.3–0.4) | ||
| Catot (mmol/L) | 2.2 | 2.4 | <0.001 |
| (2.1–2.3) | (2.3–2.5) | ||
| Cacorr (mmol/L) | 2.2 | 2.4 | <0.001 |
| (2.2–2.4) | (2.4–2.5) | ||
| Alb (g/L) | 36 | 39 | <0.001 |
| (34–40) | (36–42) | ||
| PO4 (mmol/L) | 1.4 | 0.6 | <0.001 |
| (1.1–1.8) | (0.5–0.7) | ||
| Mg (mmol/L) | 0.81 | 0.74 | <0.001 |
| (0.7–0.9) | (0.7–0.8) |
Values are presented as median (25th–75th quartile range). Significant P-values <0.05 are in bold.
Alb, albumin.
DISCUSSION
In this prospective study on patients starting dialysis, we observed an increase in the T50 value, corresponding to a decrease in the calcification propensity, over the first 3 months on dialysis. This change was independently and positively associated with fetuin-A, magnesium and CO2tot and inversely associated with phosphate. At 3 months, fetuin-A and magnesium increased compared with baseline, whereas CO2tot remained stable. Although there was an increase of calcium and 25-hydroxyvitamin D and a decrease of CRP and PTH over time, these changes were not independently associated with T50. Regarding arterial stiffness, there was no modification of the PWV or AI, whereas central AP had decreased after 3 months.
A single 4-h dialysis session had differential effects since it decreased phosphate and magnesium and increased calcium and albumin, but also resulted in increased T50, consistent with recent data [11].
We observed that dialysis initiation decreased calcification propensity, since T50 increased. An increase in T50 corresponds to a decreased rate of particle formation in vitro and a lower cardiovascular risk in clinical studies. Therefore, according to our results, dialysis initiation should merely decrease cardiovascular risk. The change in T50 is most likely explained through its association with fetuin-A, magnesium, bicarbonate and phosphate levels, despite an increase in calcium at 3 months after dialysis initiation. Fetuin-A, bicarbonate and magnesium are known calcification inhibitors which delay the formation of crystalline phosphate particles and thus likely counteract phosphate toxicity. In contrast, phopshate accelerates the formation of crystalline phosphate particles and thus aggravates phosphate toxicity. The association of the determinants with T50 is plausible and consistent with previous studies.
Few studies have examined longitudinal changes in T50 during dialysis. In the Evaluation of Cinacalcet Hydrochloride Therapy to Lower Cardiovascular Events trial, baseline T50 improved the prediction of cardiovascular events and survival [25]. In a German cohort of 188 chronic HD patients, evolution of T50 was an independent predictor of mortality while baseline T50 taken alone was not [16]. In this study, T50 decreased in 74% of patients when repeated at 24 months. Phosphate was the strongest predictor of T50 changes. We demonstrate here that dialysis initiation and each dialysis session has a rather favourable effect on T50 levels. Thus the decrease in T50 observed in dialysis patients is likely more related to the loss of residual renal function than the technique itself, explaining why T50 worsens over time on dialysis while dialysis initiation improves it.
The course of fetuin-A levels during dialysis initiation had not been described so far. Fetuin-A is produced in the liver and decreases in the acute inflammatory phase [26]. In our study, fetuin-A levels increased over 3 months and this corresponded to the decline of inflammatory parameters. This result was unexpected since dialysis has been related to inflammation. In our opinion, this shows that dialysis itself improves the inflammatory state in the initial phase. Longitudinal changes in fetuin-A have not been studied in dialysis, and the impact of such an increase on mortality is unknown. Each dialysis session improved fetuin-A levels. Such an acute change may be related to a concentrating effect by volume depletion or to a potential dissolution of circulating calciprotein particles.
The effect of magnesium on T50 during dialysis needs clarification. In our study, magnesium levels decreased in a single dialysis session but increased when comparing the baseline value to values obtained after 3 months. The difference mainly appeared when comparing the baseline and 3-month values, with a trend towards an increase, although there was no magnesium substitution. This can contribute to an improvement of T50 as shown by our multivariate linear association and a recent prospective randomized controlled trial [27]. In our study, the increase in magnesium level at 3 months was not entirely expected, given the effect of each dialysis session, and is most likely mediated by phosphate levels reduction, as none received oral magnesium supplementation. Haemoconcentration is unlikely to cause the increased magnesium level at 3 months since we observed no correlation between magnesium levels and weight changes over 3 months nor between magnesium levels and ultrafiltration volume.
Regarding the association of T50 with arterial stiffness or central haemodynamic parameters, Smith et al. [9] used repeated PWV measures every 6 months over 2.5 years in CKD patients and found that lower baseline T50 levels were associated with a >20% increase in PWV. In our much shorter study, there was no change in PWV after dialysis initiation despite modification of T50. We additionally looked at AI and AP and only AP decreased. AI and AP are both obtained by the pulse wave analysis and give information on central haemodynamics in addition to arterial stiffness [28]. An increase in AI or AP reflects an increase arterial stiffness. AP has also been associated with major adverse cardiovascular events [29], although there are few studies looking at the prognostic value of AP. As AI represents the ratio of AP to pulse pressure, it can be low in patients with higher pulse pressure, such as the elderly. Therefore AI may underestimate the changes in vascular properties in some populations compared with AP. AP can therefore reflect an improvement of arterial properties after dialysis initiation, but it may also be a reflection of better blood pressure control over the first 3 months of dialysis initiation.
Our study is the first to examine the impact of dialysis initiation on changes in T50 and PWV over time. Previous studies have investigated prevalent dialysis patients only.
Our study has some limitations. The sample size was small. However, the repeated measures over time and the use of mixed models allowed us to analyse many values using each participant as his own control. Both strategies increased the power of the study. Therefore we were not expecting false-positive results. However, we were unable to fully study the differences between PD and HD due to the small sample size of the PD group, although the trends were similar in both groups. T50 was higher in the PD patients at baseline, which might explain why changes were not significant when looking at the effect of PD alone. The sample size was likely too small and follow-up period too short to evaluate the effect on hard CV outcomes and probably to see a difference in PWV and AI. The effect of dialysis might also be different in the short- and long-term period.
In conclusion, 3 months after dialysis initiation the T50, magnesium and fetuin-A levels all increased. We were able to confirm the association of T50 with several mineral metabolism variables and of fetuin-A with inflammatory markers. Changes due to a single dialysis session in biological parameters did not reflect longitudinal changes.
According to our data, the high rate of cardiovascular events after dialysis initiation cannot be attributed to pro-inflammatory effects or accelerated vascular calcification and/or stiffness induced by dialysis. Other mechanisms, such as carry-over effects of previous comorbidities or acute haemodynamic changes, may play a role, but this was not investigated in this study. Therefore further studies should probably focus on dynamic changes during a longitudinal follow-up. More studies are also required to assess whether low T50 levels can be used as an argument to initiate dialysis in selected patients.
ACKNOWLEDGEMENTS
We thank Chantal Martinez for her help in collecting samples and the follow-up. We also thank the members of the Central Serotheque of the University Hospital for all the biobanking management.
FUNDING
Funding was provided by the Swiss National Center of Competence in Research Kidney Control of Homeostasis (NCCR.Kidney.ch) as a human clinical project (HCP) to Sophie de Seigneux. Belen Ponte is partly funded by Swiss National Foundation (PMPDP3 171352).
CONFLICT OF INTEREST STATEMENT
A.P. is an inventor of the T50 test and a founder, employee, stockholder and current chief executive officer of Calciscon AG, which commercializes the T50 test.(Color online)


Comments