


Abstract
Intravenous (IV) iron can modulate fibroblast growth factor 23 (FGF23) concentrations and cause transient but significant hypophosphataemia. However, it is unknown what other markers might be involved, especially in different patient groups. This study aimed to determine changes in bone and haematinic biomarkers following IV ferric carboxymaltose (FCM) and to identify risk factors for hypophosphataemia in pregnant subjects and those with chronic kidney disease (CKD).
Changes in bone [serum FGF23, fractional excretion of phosphate urinary fractional excretion of phosphate (FEPi), serum phosphate and serum vitamin D derivatives] and haematinic [plasma hepcidin, serum ferritin and transferrin saturation (TSAT)] biomarkers after 1 g of IV FCM were followed in iron-deficient pregnant and CKD patients and compared with controls (estimated glomerular filtration rate > 60 mL/min/1.73 m2). Data were collected at baseline and up to 42 days after infusion. Risk factors for post-FCM hypophosphataemia were also assessed.
Sixty-five subjects completed the study (control, n = 20; pregnant, n = 20; CKD, n = 25). A uniform but variable increase across groups was seen in intact FGF23 (peak Day 2), whereas c-terminal FGF23 varied markedly. Trough serum phosphate timed with the peak FEPi at Day 7, recovering by Day 21 in the pregnant group and Day 42 in other groups. Independent predictors of a low phosphate nadir included baseline phosphate, FEPi and weight-adjusted FCM dose. All groups showed an early and marked increase in plasma hepcidin (peak Day 2), serum ferritin and TSAT (peak Day 7 for both).
Changes in bone and haematinic biomarkers differ between patient groups following IV FCM. For patients with lower serum phosphate concentrations, limiting the dose and measuring levels 7 days after administration may mitigate clinically significant hypophosphataemia.
INTRODUCTION
Ferric carboxymaltose (FCM) is a form of intravenous (IV) iron that can be given over 15 min, which is convenient for patients, allows greater throughput within the hospital system and has been shown to be more cost effective compared with oral and other IV iron preparations that require a slower infusion rate [1, 2]. However, the administration of IV iron has recently been associated with the development of transient hypophosphataemia in some patients [3–6]. The precise mechanism for this effect remains unclear, but it is likely related to a variable effect of IV iron formulations on the intracellular metabolism of fibroblast growth factor 23 (FGF23), increasing the fractional excretion of phosphate and reducing production of active vitamin D [5, 7]. The phosphate-lowering effect of iron and FGF23 has been demonstrated in women with significant uterine bleeding [5], however, this has not been consistently observed in other cohorts who require regular IV iron, e.g. inflammatory bowel disease [8] and chronic kidney disease (CKD) [9–11].
The aims of this study were to describe the pattern of change of FGF23, serum phosphate and markers of bone and iron metabolism and identify clinical and biochemical predictors of low serum phosphate after a single (1 g) IV FCM infusion in three iron-deficient patient cohorts.
MATERIALS AND METHODS
This study was a prospective, single-centre, observational cohort study to assess the change in markers of iron, bone and mineral metabolism after 1 g of IV FCM. The study was approved by the Eastern Health Human Research Ethics Committee (HREC E13/1314) and was conducted within the guidelines of the Declaration of Helsinki.
Study population and study design
The study population comprised three groups who required an iron infusion as part of routine medical care: a control group with menorrhagia or gastrointestinal sources of iron loss and normal renal function [estimated glomerular filtration rate (eGFR) >60 mL/min/m2], a pregnant group in the second or third trimester with no renal abnormalities and a CKD group with Stage 3b–4 CKD, all with either absolute or functional iron deficiency. Other eligibility criteria included age >18 years and the capacity to provide informed consent. Exclusion criteria included a known allergy to iron preparations, active bacterial infection, active malignancy, blood transfusions within the preceding 4 weeks and any iron infusion within the preceding 6 weeks. During the study period, oral phosphorus, phosphate binders and vitamin D supplements were not initiated unless clinically required (one patient required oral phosphorus supplementation); however, 16 subjects were taking 25-hydroxyvitamin D [25(OH)D], which was maintained during the study period.
Participants who provided consent were administered a single dose of 1 g IV FCM (Ferinject, Vifor Pharma Australia, Melbourne, VIC, Australia) in the day-infusion centres at Box Hill Hospital or Angliss Hospital, Eastern Health. FCM was diluted in 100 mL 0.9% saline and administered over 15 min. Blood and urine samples were collected at Day 0 (pre-FCM) and 2, 7, 21 and 42 days post-FCM. Blood samples were centrifuged within 3 h and stored as serum or plasma in 1 mL aliquots at −80°C. Urine samples were morning, spot collections.
Data collection
Both the biologically active intact FGF23 (iFGF23; Kainos, Shizuoka, Japan) and the C-terminal assay (cFGF23; Immutopics, San Clemente, CA, USA), which determines total FGF23, were measured by enzyme-linked immunosorbent assays (ELISAs) using duplicate samples. The intraplate and interplate coefficients of variation (CVs) for the iFGF23 and cFGF23 ELISA were 5.6% and 8.7% and 3.2% and 4.3%, respectively. The iFGF23:cFGF23 ratio provides insight into the proportion of the biologically active hormone as well as a surrogate marker for the activity of intracellular proteolysis of iFGF23. Plasma hepcidin was determined by tandem mass spectrometry using an ACQUITY Ultra-Performance Liquid Chromatography system (Waters, Milford, MA, USA) with a Xevo TQ-S mass spectrometer, as previously described [12]. Chemiluminescence binding assays were used to detect total plasma 25(OH)D levels using the Cobas e602 Elecsys system (Roche Diagnostics International, Rotkreuz, Switzerland) and plasma 1,25-dihydroxyvitamin D using LIAISON XL Analyser (DiaSorin, Stillwater, MN, USA) at the Austin Health Biochemistry Laboratory. All other laboratory analyses were performed by the Eastern Health laboratory, a nationally accredited service. Estimated glomerular filtration rate (eGFR) was calculated based on the Chronic Kidney Disease Epidemiology Collaboration equation [13]. Urinary fractional excretion of phosphate (FEPi) was calculated from paired serum and urine samples, using the formula FEPi = (urinary phosphate × serum creatinine)/(serum phosphate × urine creatinine).
Statistical analysis
Categorical variables were expressed as frequency and percentage, while continuous variables were expressed as mean ± standard deviation (SD) or median and interquartile range (IQR), when appropriate. Differences between groups were determined by the chi-squared test for categorical variables, while continuous variables were assessed by paired or non-paired t-test and analysis of variance with Tukey’s multiple comparison correction for normally distributed parameters. Non-parametric data were either natural log transformed (Ln) before statistical analyses or were compared using the Wilcoxon matched-pairs signed rank test, Mann–Whitney test or Kruskal–Wallis test with Dunn’s multiple comparisons correction, as appropriate. Predictors of low phosphate post-FCM were determined by univariate analyses using Pearson correlation. The most significant variables were then assessed for their relative standing in a mixed linear model multivariate analysis. An alpha P-value <0.05 was considered statistically significant. All analyses were computed using SPSS Statistics version 24.0 (IBM, Armonk, NY, USA). Graphs were created using GraphPad PRISM 6 (GraphPad Software, La Jolla, CA, USA).
RESULTS
Baseline characteristics
Sixty-five subjects (controls, n = 20; pregnant, n = 20; CKD, n = 25) completed the study. The CKD group comprised 60% males, were older (mean age 72.7 ± 11.3 years), had more comorbid diabetes mellitus (56%) and had a median eGFR of 32 (IQR 25–37) mL/min/1.73 m2 (Table 1). Baseline ferritin in the control, pregnant and CKD groups was 22 (IQR 15–31), 12 (IQR 8–19) and 39 (IQR 19–89) µg/L, respectively. Mean serum phosphate was similar between groups at baseline; however, there were significant differences in FEPi, parathyroid hormone (PTH), iFGF23 and hepcidin levels between groups, with all parameters being more elevated in the CKD group (Table 1). There were no differences in bone-related or haematinic biomarkers between male and female subjects within the CKD group (Supplementary data, Table S1).
Baseline characteristics and laboratory results
| Control (n = 20) | Pregnant (n = 20) | CKD (n = 25) | P-value | |
|---|---|---|---|---|
| Age (years) | 42.7 ± 17.3 | 31.8 ± 4.9a | 72.7 ± 11.3b,c | <0.0001 |
| Female (%) | 95 | 100 | 40 | <0.0001 |
| BMI (kg/m2) | 24.5 ± 4.4 | 28.1 ± 4.6 | 31.7 ± 5.2 | <0.001 |
| Systolic BP (mmHg) | 117.8 ± 14.5 | 113.7 ± 12.5 | 130.4 ± 18.9d,e | <0.01 |
| Diastolic BP (mmHg) | 69.7 ± 6.7 | 67.5 ± 9.6 | 69.9 ± 15.6 | ns |
| Diabetes (%) | 5 | 5 | 56 | <0.0001 |
| eGFR (mL/min/1.73 m2) | 106 (88–114) | 126 (120–133)b | 32 (25–37)b,c | <0.0001 |
| Haemoglobin (g/L) | 131 (116–135) | 114 (106–124)a | 108 (98–117)f | <0.01 |
| Ferritin (µg/L) | 22 (15–31) | 12 (8–19)d | 39 (19–89)d,c | <0.0001 |
| TSAT (%) | 16 (10–22) | 11 (9–16) | 15 (10–22) | ns |
| Hepcidin (ng/mL) | 1.7 (0.6–7.1) | 0.4 (0.3–1.3) | 9.4 (6.2–26.4)d,g | <0.001 |
| CRP (mg/L) | 0 (0–4) | 5 (4–7)a | 2 (0–4) | <0.05 |
| Phosphate (mmol/L) | 1.2 ± 0.2 | 1.2 ± 0.1 | 1.3 ± 0.3 | ns |
| FEPi (%) | 10.4 ± 4.6 | 8.5 ± 4.9 | 26.9 ± 10.9b,c | <0.0001 |
| PTH (pmol/L) | 4.2 (3.4–5.7) | 3.3 (2.5–3.6)a | 8.0 (6.6–12.1)b,c | <0.0001 |
| 25(OH)D (nmol/L) | 58.7 ± 30.5 | 68.2 ± 20.0 | 74.3 ± 26.2 | ns |
| 1,25-diOH-Vit D (pmol/L) | 113.6 ± 32.7 | 269.4 ± 61.6b | 72.4 ± 19.8b,c | <0.0001 |
| iFGF23 (pg/mL) | 63.8 (41.0–74.7) | 41.0 (31.2–52.0)d | 130.4 (96.3–161.9)b,c | <0.0001 |
| cFGF23 (RU/mL) | 33.6 (20.4–51.1) | 68.8 (41.6–96.0)a | 79.9 (44.1–193.0)f | <0.001 |
Data expressed as mean ± SD or median (IQR).
P < 0.01 versus control group.
P < 0.0001 versus control group.
P < 0.0001 versus pregnant group.
P < 0.05 versus control group.
P < 0.01 versus pregnant group.
P < 0.001 versus control group.
P < 0.001 versus pregnant group.
BMI, body mass index; CRP, C-reactive protein; 1,25-diOH-Vit D, 1,25-dihydroxyvitamin D; ns, not significant.
Effects of IV FCM on haematinic biomarkers
After FCM infusion, all groups exhibited similar peaks of transferrin saturation (TSAT) on Day 2 and ferritin on Day 7. Both these parameters remained significantly elevated compared with their respective baselines at Day 42, across the groups (Figure 1A and B). There was a significant increase in haemoglobin by Day 21 in both the pregnant and CKD groups, while this occurred by Day 42 in the control group after FCM treatment (Figure 1C).
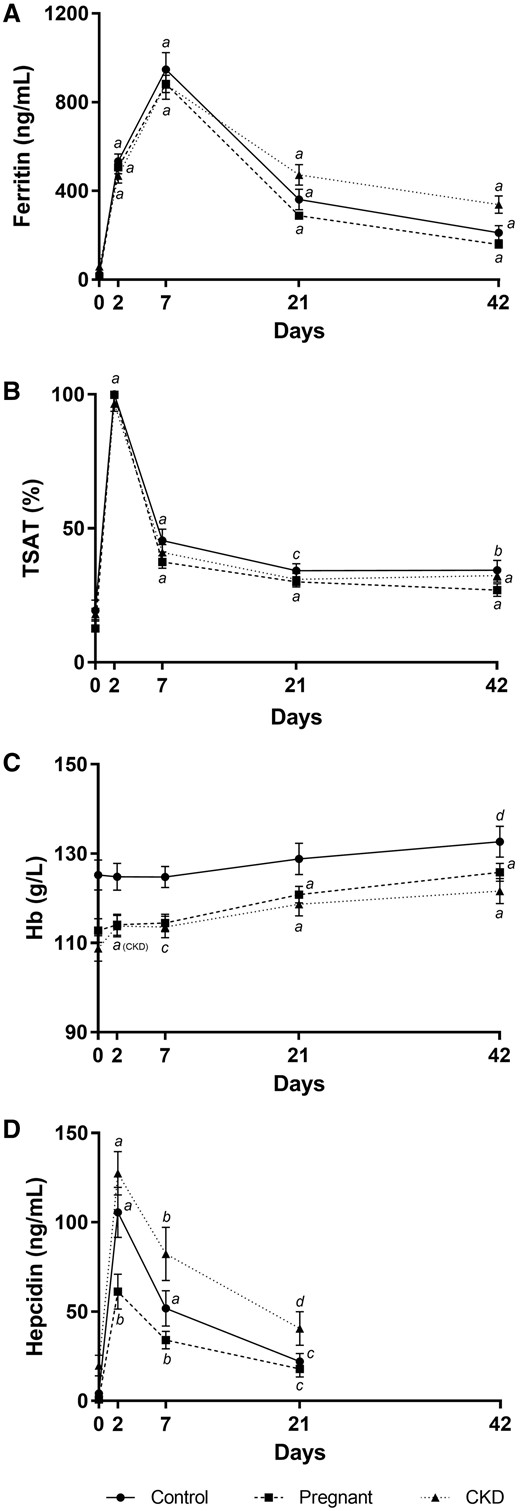
Changes to haematinic biomarkers after IV ferric carboxymaltose. Changes in (A) serum ferritin, (B) transferrin saturation, (C) haemoglobin and (D) plasma hepcidin after IV ferric carboxymaltose infusion. Error bars denote standard error of the mean. aP < 0.0001 versus Day 0, bP < 0.001 versus Day 0, cP < 0.01 versus Day 0, dP < 0.05 versus Day 0, within respective groups.
Hepcidin levels peaked on Day 2, with levels of 98.1 (IQR 61.5–145.1), 55.6 (IQR 32.1–79.9) and 111.7 (IQR 87.6–160.2) ng/mL in the control, pregnant and CKD groups, respectively (P < 0.001). Levels remained significantly elevated until Day 21 in all groups (Figure 1D). Despite having the same dose of IV FCM, with equivalent ferritin and TSAT responses, there were significant between-group differences in the hepcidin at all time points (P < 0.01 and P < 0.05 on Day 7 and Day 21, respectively).
Effects of IV FCM on bone biomarkers
Intact FGF23 was significantly elevated after the FCM infusions, with increases of 5.4-, 2.8- and 3.7-fold in the control, pregnant and CKD groups, respectively, at Day 2 (Figure 2A). Corresponding iFGF23 levels were 305 (IQR 235–415), 110 (IQR 85–175) and 453 (IQR 350–811) pg/mL, respectively (P < 0.0001 across groups, with the pregnant group driving the difference: P < 0.001 versus control group and P < 0.0001 versus CKD group, after post hoc analysis). In the pregnant and CKD groups, iFGF23 returned to baseline by Day 21, whereas the control group normalized at Day 42.
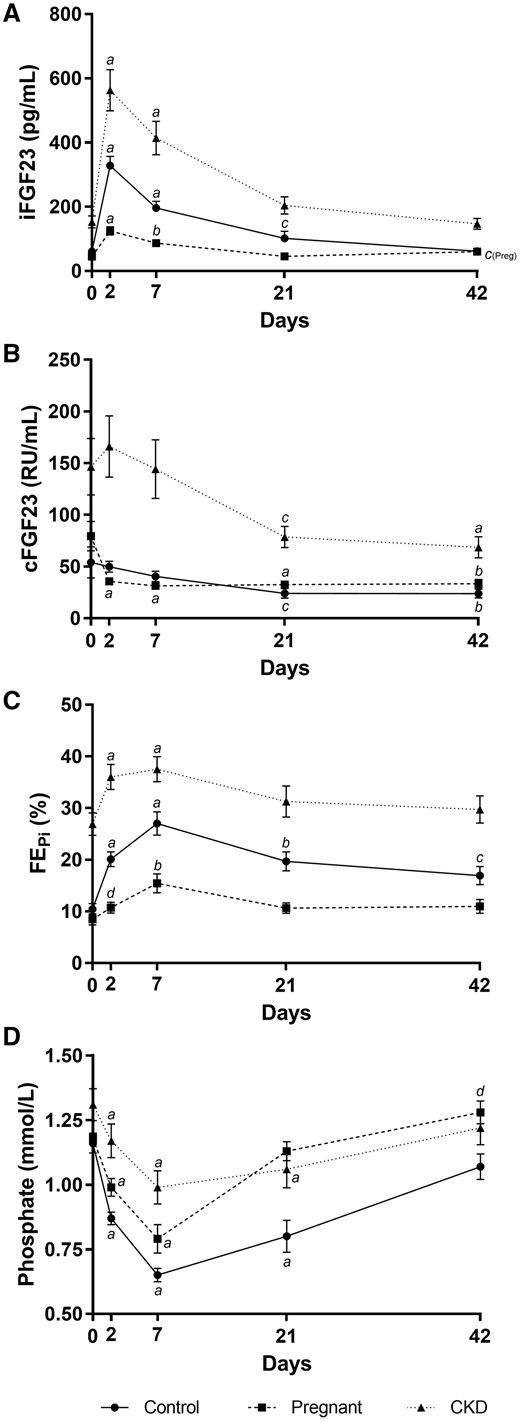
Changes to bone biomarkers after IV ferric carboxymaltose. Changes in (A) serum iFGF23, (B) cFGF23, (C) fractional excretion of phosphate and (D) serum phosphate after IV ferric carboxymaltose. Error bars denote standard error of the mean. aP < 0.0001 versus Day 0, bP < 0.001 versus Day 0, cP < 0.01 versus Day 0, dP < 0.05 versus Day 0, within respective groups.
The changes in cFGF23 post-FCM varied. In the control and CKD groups, cFGF23 reduced significantly by Day 21 and remained suppressed at Day 42. cFGF23 reduction occurred earlier in the pregnant group, at Day 2, and remained suppressed until Day 42 (Figure 2B). To further understand the changes in FGF23 metabolism, iFGF23:cFGF23 ratios were assessed. This ratio increased significantly at Day 2 in all groups (predominantly driven by the increase in iFGF23) and persisted until Day 21 in the control group and Day 42 in the pregnant and CKD groups (Table 2).
Change in markers of bone mineral metabolism after IV FCM
| Group | Day 0 | Day 2 | Day 7 | Day 21 | Day 42 | |
|---|---|---|---|---|---|---|
| iFGF23 (pg/mL) | Control | 64 (41–75) | 305 (235–415)a | 182 (120–239)a | 83 (57–101)b | 53 (39–70) |
| Pregnant | 41 (31–52) | 110 (85–175)a | 77 (53–114)c | 46 (40–54) | 55 (46–72) | |
| CKD | 130 (96–162) | 453 (350–811)a | 304 (235–544)a | 165 (122–263) | 124 (92–175) | |
| cFGF23 (RU/mL) | Control | 34 (20–51) | 46 (35–66) | 39 (30–48) | 26 (9–29)b | 23 (11–31)c |
| Pregnant | 69 (42–96) | 33 (27–43)a | 32 (27–34)a | 28 (25–38)a | 28 (23–40)c | |
| CKD | 80 (44–193) | 116 (71–178) | 90 (59–192) | 74 (39–96)b | 58 (28–96)a | |
| iFGF23:cFGF23 (pg/RU) | Control | 2.4 ± 2.5 | 7.1 ± 4.3a | 6.3 ± 4.5b | 8.2 ± 11.9d | 3.7 ± 2.7 |
| Pregnant | 0.8 ± 0.6 | 3.5 ± 2.1a | 3.0 ± 1.9a | 1.6 ± 0.6c | 2.3 ± 1.4a | |
| CKD | 1.9 ± 1.3 | 4.2 ± 2.2a | 3.9 ± 2.2c | 3.2 ± 1.9b | 3.0 ± 1.8d | |
| 25(OH)D (nmol/L) | Control | 59 ± 31 | 60 ± 31 | 58 ± 29 | 57 ± 31 | – |
| Pregnant | 68.2 ± 20 | 70 ± 19 | 75 ± 20 | 70 ± 22 | – | |
| CKD | 74.3 ± 26 | 70 ± 27 | 71 ± 26 | 70 ± 24 | – | |
| 1,25-diOH-Vit D (pmol/L) | Control | 114 ± 33 | 37 ± 16a | 24 ± 14a | 86 ± 41d | – |
| Pregnant | 269 ± 62 | 125 ± 39a | 140 ± 61a | 254 ± 57 | – | |
| CKD | 72 ± 20 | 48 ± 13a | 31 ± 12a | 58 ± 22d | – | |
| PTH (pmol/L) | Control | 4.2 (3.4–5.7) | 3.6 (2.8–4.7) | 4.1 (3.6–5.2) | 6.3 (4.2–7.1)b | 5.1 (3.5–6.9) |
| Pregnant | 3.3 (2.5–3.6) | 3.1 (2.5–4.1) | 3.1 (2.5–4.0) | 2.8 (2.5–3.3) | 3.5 (2.8–4.1) | |
| CKD | 8.0 (6.6–12.1) | 8.3 (5.4–10.2)d | 7.5 (4.9–13.0)d | 9.0 (6.3–11.9) | 9.1 (6.1–11.4) |
Data expressed as mean ± SD or median (IQR). 1,25-diOH-Vit D, 1,25-dihydroxyvitamin D.
P < 0.0001 versus Day 0.
P < 0.01 versus Day 0.
P < 0.001 versus Day 0.
P < 0.05 versus Day 0.
There was also a distinct pattern of change in FEPi across the groups. Peak FEPi was observed on Day 7, increasing to 27 ± 10%, 16 ± 8% and 38 ± 12% in the control, pregnant and CKD groups, respectively (P < 0.0001 across groups, with all groups being significantly different from each other on post hoc comparisons). This returned to baseline by Day 21 in the pregnant and CKD groups but remained significantly elevated in the control group at Day 42 (Figure 2C).
Trough levels of serum phosphate were also observed on Day 7 in all groups. In the control, pregnant and CKD groups, respectively, the reduction of baseline serum phosphate was 56%, 67% and 76%, while serum phosphate levels were 0.65 ± 0.12, 0.79 ± 0.25 and 0.99 ± 0.32 mmol/L (P < 0.0001 across groups, but driven by the CKD group: P < 0.0001 versus control group and P < 0.05 versus pregnant group) (Figure 2D). Normalization of serum phosphate occurred earliest in the pregnant group at Day 21, compared with Day 42 in the control and CKD groups (Figure 2D).
Changes in 25(OH)D and 1,25-dihydroxyvitamin D and PTH are summarized in Table 2.
Predictors of trough serum phosphate
The determinants of trough serum phosphate on Day 7 were assessed by univariate analysis. When the groups were combined as a single cohort, the strongest correlations were observed with baseline serum phosphate (r = 0.701, P < 0.0001), FEPi (r = 0.536, P < 0.0001), iFGF23 (r = 0.506, P < 0.0001) and weight-adjusted iron dose (FCM/kg) (r = –0.374, P < 0.01) (Figure 3 and Table 3). A multivariate analysis was then performed on all groups combined to assess the relative effects of these variables on serum phosphate at Day 7. Only baseline phosphate, FEPi and FCM/kg remained significant predictors (Table 3).
Predictors of trough serum phosphate by univariate and multivariate analysis
| Variable | Pearson’s r | P-value | |||
|---|---|---|---|---|---|
| All groups (N = 65) | Baseline phosphate | 0.701 | <0.0001 | ||
| FEPi | 0.536 | <0.0001 | |||
| iFGF23 | 0.506 | <0.0001 | |||
| FCM/kg | −0.374 | <0.01 | |||
| CKD (n = 25) | Baseline phosphate | 0.850 | <0.0001 | ||
| iFGF23 | 0.741 | <0.0001 | |||
| FEPi | 0.418 | 0.038 | |||
| FCM/kg | −0.019 | ns | |||
| Non-CKD (n = 40) | Baseline phosphate | 0.363 | 0.023 | ||
| FCM/kg | −0.315 | 0.047 | |||
| FEPi | 0.136 | ns | |||
| iFGF23 | −0.132 | ns | |||
| Unstandardized coefficients | Standardized coefficients | P-value | |||
| β | 95% CI | β | |||
| All groups (N = 65) | Baseline phosphate | 0.792 | 0.559–1.026 | 0.623 | <0.0001 |
| FEPi | 0.007 | 0.001–0.012 | 0.271 | 0.013 | |
| FCM/kg | −0.021 | −0.038 to − 0.005 | −0.226 | 0.013 | |
| iFGF23 | −0.029 | −0.126–0.068 | −0.068 | 0.553 | |
| CKD (n = 25) | Baseline phosphate | 0.671 | 0.372–0.971 | 0.644 | <0.0001 |
| iFGF23 | 0.001 | 0.000–0.002 | 0.303 | 0.040 | |
| Non-CKD (n = 40) | Baseline phosphate | 0.472 | 0.002–0.942 | 0.301 | 0.049 |
| FCM/kg | −0.023 | −0.043 to − 0.002 | −0.331 | 0.032 | |
FCM/kg, weight-adjusted ferric carboxymaltose dose; iFGF23, intact fibroblast growth factor 23; ns, not significant.
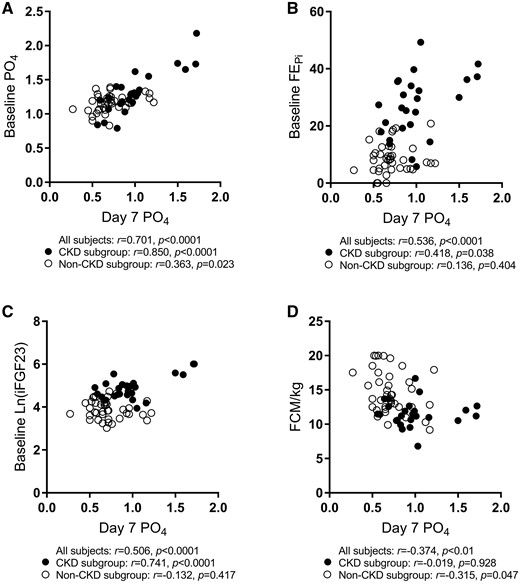
Scatter plots and bivariate correlations for trough serum phosphate. The CKD subgroup is represented by black circles (•) while the non-CKD subgroup is represented by white circles (○). Pearson correlation coefficients were performed separately for all subjects combined, CKD only and non-CKD subgroups. iFGF23 was natural log transformed before analysis. PO4, phosphate; FEPi, fractional excretion of phosphate; FCM/kg, weight adjusted ferric carboxymaltose dose; iFGF23, intact fibroblast growth factor 23.
As there were significant differences between the CKD and non-CKD groups, analyses for predictors of low Day 7 phosphate were determined again by separating the CKD group from the other two groups. Within the CKD group, univariate analysis showed strong correlations between Day 7 phosphate and baseline phosphate (r = 0.850, P < 0.0001), iFGF23 (r = 0.741, P < 0.0001), FEPi (r = 0.418, P = 0.038) and 1,25-dihydroxyvitamin D (r = –0.586, P = 0.002), whereas weight-adjusted iron dose (r = –0.019, P = 0.928) and gender (r = –0.091, P = 0.665) showed no significant associations. The two most significant variables (baseline phosphate and iFGF23) were then assessed in a multivariate analysis and remained significant as determinants of Day 7 phosphate (β = 0.644, P < 0.0001 and β = 0.303, P = 0.040, respectively) (Table 3).
In the non-CKD groups, the bivariate correlations of significance were FCM/kg (r = –0.315, P = 0.047) and baseline serum phosphate (r = 0.363, P = 0.023). In the multivariate model, both FCM/kg and baseline serum phosphate remained significant factors for influencing Day 7 phosphate (β = –0.331, P = 0.032 and β = 0.301, P = 0.049, respectively) (Table 3).
DISCUSSION
This study demonstrates, for the first time, the differential biological responses in markers of iron and bone mineral metabolism in three different subject cohorts after receiving identical doses of IV FCM. Despite inherent differences at baseline, the first parameter to change in all groups was iFGF23 (the biologically active form of FGF23), at Day 2. This was followed by an increase in urinary phosphate excretion and a corresponding reduction in serum phosphate, both of which were most evident by Day 7 and persisted for up to 42 days. We also found differences between groups: the control group had the greatest increase in iFGF23 at Day 2 and subsequently had the most sustained increase in FEPi; the pregnant group had the lowest baseline FEPi, with the quickest recovery in serum phosphate. As expected, the CKD group had the highest baseline iFGF23 levels, while the cFGF23 reduction occurred much later than in the pregnant group (by Day 21).
The decrease in serum phosphate that occurs after infusion of several types of IV iron—including IV FCM and iron polymaltose [3, 5, 14], but not iron dextran [5] or iron sucrose [15]—is well-recognized but poorly understood (summarized in Table 4), although an imbalance in the intracellular proteolysis of iFGF23 due to differences in the carbohydrate moieties is considered a likely mechanism [7, 16, 17]. Whether such changes have clinical implications is unclear, although recent reports potentially link recurrent iron infusions of FCM with sporadic cases of osteomalacia in some patient groups [18–20].
Summary of the effects of iron on phosphate handling and FGF23 in prospective studies
| Author | Cohort | n | Iron | Dose | iFGF23 | cFGF23 | PO4 excretion | Serum PO4 |
|---|---|---|---|---|---|---|---|---|
| Current study | GI bleeding | 20 | IV FCM | 1 g | ↑377%, d2 | ↓31%, d42 | ↑159%, d7 | ↓56%, d7 |
| Pregnant women | 20 | IV FCM | 1 g | ↑169%, d2 | ↓60%, d21 | ↑83%, d7 | ↓67%, d7 | |
| CKD | 25 | IV FCM | 1 g | ↑248%, d2 | ↓27%, d42 | ↑40%, d7 | ↓76%, d7 | |
| Schouten et al. [3, 18] | Iron deficient women | 8 | IV iron polymaltose | 1.1–3.5 g | ↑307%, d7 | n/a | ↑24%, d7 | ↓47%, d7 |
| Wolf et al. [5] | Menorrhagia | 17 | IV FCM | 15 mg/kg, max 1 g | ↑128%, d1 | ↓79%, d7 | ↑42%, d7 | ↓21%, d14 |
| 22 | IV Iron dextran | 15 mg/kg, max 1 g | No Δ | ↓87%, d14 | No Δ | No Δ | ||
| Prats et al. [4] | CKD | 47 | IV FCM | 15 mg/kg, max 1 g | n/a | ↓57%, d84 | n/a | ↓14%, d21 |
| Dahlerup et al. [8] | IBD | 21 | IV iron isomaltoside | 1.5–3 g | No Δ | n/a | n/a | 4/21 with P ≤ 0.65 |
| Takeda et al. [10] | Haemodialysis | 27 | IV SFO | 40 mg 3×/week for 3 weeks | ↑36%, d21 | n/a | n/a | No Δ |
| Iguchi et al. [9] | Haemodialysis | 28 | Oral FCH | 1.1–1.2 g/d | ↓11%, d84 | ↓28%, d84 | n/a | No Δ |
| Yamashita et al. [11] | Haemodialysis | 33 | Oral ferrous citrate | 50 mg/d for 3 months | ↓32% | ↓16% | n/a | No Δ |
| Roberts et al. [12] | Haemodialysis | 22 | IV FCM | 200 mg | ↓32%, d2 | ↑15%, d2 | n/a | ↓10%, d2 |
| 20 | IV iron sucrose | 200 mg | No Δ | No Δ | n/a | No Δ |
GI, gastrointestinal; IBD, inflammatory bowel disease; SFO, saccharated ferric oxide; FCH, ferric citrate hydrate; d, day; PO4, phosphate.
The reduction in phosphate concentrations was consistent but variable among groups in our study, specifically with the participants in the CKD group usually not falling below the normal range. Notwithstanding the variable baseline parameters in each group, we were able to identify key associative predictors of the post-FCM decrease in serum phosphate. The first, and perhaps the strongest of these, was a low baseline serum phosphate, an association observed both when the groups were combined and when the CKD group was excluded (Table 3). With the groups combined, a lower phosphate nadir was also predicted by the weight-normalized iron dose (FCM/kg), an independent association seen in the non-CKD groups. Such predictors may be useful in identifying the potential for a meaningful decrease in serum phosphate in clinical practice. However, our data also found counterintuitive associations between FEPi and iFGF23 in relation to the trough serum phosphate, where those with higher baseline phosphate excretions and higher baseline iFGF23 also had higher Day 7 phosphate levels. On analysis, this observation most likely reflects the influence of the CKD group and can be explained by the pathophysiology of phosphate handling in kidney disease: at baseline, the serum phosphate in the CKD group did not differ compared with the other groups; however, this was achieved through greater phosphate removal (and associated with higher levels of serum iFGF23 and FEPi). Given that the CKD group was also the largest group within our study, it created a ‘false’-positive correlation between overall trough phosphate and both baseline iFGF23 and FEPi, as evidenced by the loss of statistical significance when the CKD group was excluded from the analysis (Table 3).
The observed decreases in serum phosphate and 1,25-dihydroxyvitamin D were potentially of greatest concern in pregnancy, where phosphate has essential roles in energy metabolism, cell signalling and skeletal development [21]. Whether this might affect the developing foetal skeleton and/or maternal metabolism is unknown; however, one pregnant subject required oral phosphate supplementation 1 week after infusion because of symptomatic weakness and a serum phosphate of 0.27 mmol/L. No evidence of foetal abnormalities was found during her (brief) admission. The fact that 25(OH)D changes did not change in any group suggests that the observed decrease in active vitamin D reflects inhibition of intrarenal hydroxylation by iFGF23. Whether supplementation with oral phosphate or active vitamin D before IV infusion of FCM could potentially ameliorate such effects needs to be ascertained. However, at this stage our results suggest that measuring the serum phosphate pre- and 1-week post-infusion might be considered in susceptible patients. Weight-based infusions, dose reductions of iron or selecting an iron formulation that has not been associated with hypophosphataemia (such as iron dextran or iron sucrose) might also be strategies to address predictable decreases in serum phosphate.
There was a clear, early but variable increase (according to group) in serum hepcidin concentration in all groups following FCM. The smallest increase was in the pregnant group, consistent with physiological upregulation of iron absorption during gestation. Changes in hepcidin accompanied the increases in ferritin and TSAT, but there was no association between baseline or subsequent changes in hepcidin and any markers of phosphate metabolism.
The strength of this study was the inclusion of a control group that identified mainly concordant but also discrete changes compared with the other two groups and points to a complex balance between iron status, vitamin D and FGF23 both in pregnancy and in CKD. However, the significance of these interrelationships remains unclear at this point.
This study has some limitations. By necessity, due to the frequency and intensity of investigations, the number of patients studied was relatively small. Second, the various baseline estimates differed significantly between groups: the CKD group was older, predominantly male and had a high prevalence of diabetes mellitus; furthermore, the physiological changes of pregnancy are unique. Inescapably, the validity of determining predictors of hypophosphataemia with all groups combined has inherent limitations. Last, we studied FGF23 and related variables at specific time points; the results of our study may have been different by including additional time points or a longer follow-up period. Similarly, the changes observed in this study were after a single dose of IV iron; it is not clear what the longer term effects of multiple doses of IV iron on these parameters would be.
Based on the findings from this study, in order to prevent potential FCM-associated morbidity and hospital readmissions, clinicians can (i) identify patients at risk of post-FCM hypophosphataemia based on their baseline serum phosphate or iFGF23 (for patients with CKD); (ii) reduce the dose of IV FCM, utilize a weight-based regimen in those without CKD, or use an iron preparation not associated with phosphate wasting such as iron dextran and (iii) carefully monitor serum phosphate, especially around 1 week post-infusion.
ACKNOWLEDGEMENTS
We acknowledge the contributions of Dr Sukhvinder Bansal for his work on mass spectrometry and Dr Evan Newnham for facilitating patient recruitment.
FUNDING
This study received an unrestricted research grant from Vifor Pharma.
AUTHORS’ CONTRIBUTIONS
L.P.M., M.A.R., D.L., L.L.H., S.M.T. and A.B.K. were responsible for research and study design. S.M.T., A.B.K., L.L.H. and D.L. were responsible for data collection. L.L.H. were responsible for laboratory work. L.P.M., M.A.R., D.L., L.L.H. and I.C.M. were responsible for data analysis. M.A.R., L.L.H. and L.P.M. were responsible for statistical analysis. L.P.M. supervised all work. L.L.H., D.L., M.A.R., I.C.M. and L.P.M were responsible for manuscript preparation.
CONFLICT OF INTEREST STATEMENT
L.P.M. has received honoraria and a research grant from Vifor Pharma. I.C.M. has received honoraria and consultancy fees from Vifor Pharma. L.L.H., D.L., A.B.K., S.M.T. and M.A.R. have no conflicts of interest to declare.


Comments