


Abstract
Cardiac disease is highly prevalent in hemodialysis (HD) patients. Decreased tissue perfusion, including cardiac, due to high ultrafiltration volumes (UFVs) is considered to be one of the drivers of cardiac dysfunction. While central venous oxygen saturation (ScvO2) is frequently used as an indicator of cardiac output in non-uremic populations, the relationship of ScvO2 and UFV in HD patients remains unclear. Our aim was to determine how intradialytic ScvO2 changes associate with UFV.
We conducted a 6-month retrospective cohort study in maintenance HD patients with central venous catheters as vascular access. Intradialytic ScvO2 was measured with the Critline monitor. We computed treatment-level slopes of intradialytic ScvO2 over time (ScvO2 trend) and applied linear mixed effects models to assess the association between patient-level ScvO2 trends and UFV corrected for body weight (cUFV).
We studied 6042 dialysis sessions in 232 patients. In about 62.4% of treatments, ScvO2 decreased. We observed in nearly 80% of patients an inverse relationship between cUFV and ScvO2 trend, indicating that higher cUFV is associated with steeper decline in ScvO2 during dialysis.
In most patients, higher cUFV volumes are associated with steeper intradialytic ScvO2 drops. We hypothesize that in a majority of patients the intradialytic cardiac function is fluid dependent, so that in the face of high ultrafiltration rates or volume, cardiac pre-load and consequently cardiac output decreases. Direct measurements of cardiac hemodynamics are warranted to further test this hypothesis.
INTRODUCTION
Cardiac disease accounts for over 40% of mortality in end-stage renal disease (ESRD) patients. While the prevalence of cardiac disease is higher in older hemodialysis (HD) patients, the prevalence of cardiac disease in patients aged 20–44 years is greatly elevated compared with an age-matched general population [1]. While traditional risk factors such as hypertension, diabetes mellitus and hyperlipidemia are contributors, dialysis-specific factors such as anemia, hypoalbuminemia and chronic inflammation have also been incriminated [2]. Congestive heart failure (CHF) is highly prevalent among ESRD patients, and HD treatment related factors such as recurrent hemodynamic stress due to high ultrafiltration rates (UFR), intradialytic cardiac stunning due to decreased myocardial perfusion and episodes of intradialytic hypotension (IDH) may play a role in CHF pathogenesis [3–5].
The concurrence of CHF and ESRD makes fluid management particularly challenging. Not only are these patients more volume-sensitive and prone to volume overload, but CHF patients are particularly prone to hypotension, and fluid removal is limited by IDH episodes. A common therapeutic response to IDH is to administer saline boluses and often by the end of treatment patients are unable to attain their prescribed fluid status target. Additionally, episodes of IDH are not only uncomfortable for patients, but are also associated with worse outcomes [6].
Central venous oxygen saturation (ScvO2) is determined by cardiac output, hemoglobin (Hgb) levels, arterial oxygen saturation (SaO2) and oxygen extraction by the organs that drain into the superior vena cava. Therefore, ScvO2 may serve as a proxy of cardiac output, and more specifically of upper body blood flow (UBBF) [7, 8]. This relationship has been recognized for decades and hence intensivists use ScvO2 for directed fluid management in sepsis, trauma and post-surgery. In the renal field, a study in 18 maintenance HD patients revealed a significant inverse association between ScvO2 at the end of dialysis and ultrafiltration volume (UFV) corrected for body weight (cUFV) [9]. However, the dynamical changes of ScvO2 relative to cUFV are currently unclear.
The goal of our study was to explore the relationship between intradialytic ScvO2 changes and cUFV in a large and diverse population of chronic HD patients, employing automated intradialytic minute-to-minute measurements of ScvO2 during multiple treatments per patient.
MATERIALS AND METHODS
Population and study design
This retrospective multi-center study utilized routinely collected data from maintenance HD patients dialyzed in 17 US facilities of the Renal Research Institute (RRI) between January 2012 and August 2015. In these clinics, the Critline monitor (CLM; Fresenius Medical Care, Waltham, MA, USA) was used as part of standard of care. All patients were treated with bicarbonate dialyzate and polysulfone membranes.
As the CLM was introduced into RRI clinics on a rolling basis, patient recruitment also occurred on a rolling basis. Patient characteristics, ScvO2 and other clinical factors were monitored for 6 months starting with the first HD treatment with eligible ScvO2 readings. Only patients with at least 10 HD treatments with eligible ScvO2 recordings were included in the final analysis.
Data eligibility
Only patients with documented central venous catheters (CVC) were included in this study. To ensure sound CLM data, we included only treatments with a mean ScvO2 <85%, as higher values are likely from patients inappropriately documented as having CVC and instead likely have fistulas/grafts and therefore are arterial. Mean ScvO2 levels <25% are considered incompatible with life and were thus excluded. ScvO2 measurements concurrent with a relative blood volume (RBV) >102% may indicate CLM readings, e.g. during saline administration, and were thus excluded. As rapid changes in RBV may also be due to administration of saline, which may impact ScvO2 measurements, we performed a sensitivity analysis excluding treatments where RBV increased by >5% points compared with the preceding 5 min on one or more occasions.
Measurement of ScvO2
Intradialytic ScvO2 measurements were done by the CLM. The CLM is approved by the US Food and Drug Administration for the measurement of hematocrit and oxygen saturation in the extracorporeal dialysis circuit. The CLM automatically measures oxygen saturation 9000 times per min and reports an average 1×/min. As per the manufacturer, the CLM accuracy for oxygen saturation measurement is within 2%.
Assessing the relationship between ScvO2 and cUFV
In order to explore the association between ScvO2 and cUFV on a population level, we employed linear mixed effects models (see detailed description below) to combine multi-level data, starting from a treatment level to a patient level and lastly to the population level. First, we calculated on a treatment level the trend of ScvO2 over time based on 1×/min ScvO2 recordings. We then assessed the patient-level association between cUFV and ScvO2 trend by computing the slope of ScvO2 over cUFV across all treatments in a given patient. Lastly, this association was quantified on a population level by combining all patient-level results.
Clinical and laboratory data
Laboratory measurements (Spectra Laboratories, Rockleigh, NJ, USA) were downloaded to the RRI data warehouse and extracted to the study database. Clinical data were retrieved from electronic health records. Continuous clinical variables were averaged over the 6-month observation period. Body mass index was calculated using post-HD weight. Blood pressure was measured before and after HD treatments as per standard of care protocol for RRI clinics. The peridialytic systolic blood pressure (SBP) change (delta SBP) was calculated as post-HD SBP − pre-HD SBP.
Comorbidities
CHF, diabetes and chronic obstructive pulmonary disease (COPD) were defined using International Classification of Diseases—Ninth Revision codes.
Statistical analysis
Continuous variables are presented as mean ± standard deviation (SD) when normally distributed and as medians (interquartile range) otherwise. Categorical variables are presented as percentages of the group from which they were derived. Statistics of ScvO2 variables were calculated first per HD treatment, then per patient across all his/her treatments and then per group.
Patients were stratified into two groups based on the direction (positive or negative slope) of the ScvO2/cUFV relationship. Point estimates and 95% confidence intervals (CIs) of the group differences are reported.
Since we had repeated ScvO2 measurements from all patients available, we employed linear mixed effects models that considered both fixed and random effects to evaluate the relationship between ScvO2 and cUFV on a population level. The model takes into account that each patient has a random intercept and slope for the relationship between ScvO2 and cUFV; the fixed effects produces estimates of population intercept and slope.
Statistical analyses were performed using SAS version 9.3 (SAS Institute Inc., Cary, NC, USA) and R 3.0.2 (libraries ggplot2, nlme; R Foundation for Statistical Computing, Vienna, Austria. The study was approved by the New England Institutional Review Board (14-446) and conducted in accordance with the Declaration of Helsinki. This study is registered at clinicaltrials.gov (NCT02501044).
RESULTS
Baseline characteristics
Between 1 January 2012 and 31 August 2015, 579 patients with CVC as vascular access received 7937 HD treatments at 17 US RRI clinics. Of these, 232 patients with 6042 HD sessions met our inclusion criteria of at least 10 baseline HD treatments with ScvO2 readings and 6 months of follow-up time (Supplementary Figure S1). Patients contributed on average 25 ± 13.3 treatments with ScvO2 measurement. Patient age was 62.7 ± 15.7 years, dialysis vintage 2.9 ± 4.6 years, 56% were white and 48.3% were males (Table 1).
Patient characteristics of all patients and comparison between patients with negative and positive ScvO2 trends.
| Variable | All patients | Negative ScvO2 trend | Positive ScvO2 trend | Difference between groups |
|---|---|---|---|---|
| Mean ± SD | Mean ± SD | Mean ± SD | Mean (95% CI) | |
| Patients, n (%) | 232 | 181 (78) | 51 (22) | n.a. |
| HD treatments with ScvO2 measurements | 26 ± 13.3 | 27.4 ± 13.7 | 21.1 ± 10.3 | 6.4 (2.9 to 9.9) |
| Demographics | ||||
| Age (years) | 62.7 ± 15.7 | 62.5 ± 15.2 | 63.6 ± 17.7 | −1.1 (−6.0 to 3.8) |
| Race (% white) | 56 | 56.4 | 54.9 | 1.5 (−13.6 to 17.0) |
| Gender (% male) | 48.3 | 45.9 | 56.9 | −11.0 (−26.1 to 4.7) |
| Vintage (years) | 2.9 ± 4.6 | 2.7 ± 3.9 | 3.6 ± 6.6 | −0.9 (−2.9 to 1.0) |
| BMI (kg/m2) | 28.1 ± 6.9 | 28.2 ± 6.8 | 27.6 ± 7.3 | 0.6 (−1.6 to 2.9) |
| ScvO2 (%) | ||||
| Mean ScvO2 | 58.7 ± 7.3 | 58.3 ± 7.1 | 60.3 ± 8.1 | −2.0 (−4.3 to 0.3) |
| Median ScvO2 | 59.1 ± 7.3 | 58.6 ± 7.1 | 60.7 ± 8.0 | −2.0 (−4.3 to 0.2) |
| Minimum ScvO2 | 48.4 ± 9.7 | 48.0 ± 9.4 | 50.0 ± 10.6 | −2.0 (−5.0 to 1.0) |
| Maximum ScvO2 | 65.2 ± 6.2 | 64.9 ± 6.0 | 66.5 ± 6.9 | −1.6 (−3.5 to 0.3) |
| SD ScvO2 | 3.4 ± 1.1 | 3.4 ± 1.0 | 3.3 ± 1.3 | 0.1 (−0.3 to 0.5) |
| Comorbidities (%) | ||||
| Diabetes | 59.0 | 58.0 | 62.8 | −4.8 (−19.8 to 10.6) |
| CHF | 22.0 | 23.2 | 17.7 | 5.5 (−6.7 to 17.3) |
| COPD | 10.3 | 11.6 | 5.9 | 5.7 (−2.7 to 13.0) |
| Treatment parameters | ||||
| Pre-dialysis SBP (mmHg) | 146.4 ± 22.0 | 146.7 ± 20.8 | 145.5 ± 25.8 | 1.2 (−6.7 to 9.0) |
| Post-dialysis SBP (mmHg) | 140.3 ± 20.1 | 140.2 ± 19.0 | 140.7 ± 23.8 | −0.5 (−7.7 to 6.7) |
| IDWG (kg) | 2.0 ± 0.8 | 2.0 ± 0.8 | 1.8 ± 1.6 | 0.2 (−0.008 to 0.5) |
| IDWG (% of post HD weight) | 2.6 ± 0.9 | 2.7 ± 0.9 | 2.4 ± 1.0 | 0.2 (−0.06 to 0.5) |
| UFR (mL/kg/h) | 7.1 ± 2.6 | 7.3 ± 2.5 | 6.6 ± 2.9 | 0.6 (−0.2 to 1.4) |
| UFV (L) | 1.9 ± 0.8 | 2.0 ± 0.8 | 1.7 ± 0.8 | 0.3 (0.04 to 0.5) |
| Corrected UFV (mL/kg) | 25.3 ± 9.7 | 26.0 ± 9.5 | 22.9 ± 10.2 | 3.1 (0.05 to 6.1) |
| Post-dialysis weight (kg) | 77.4 ± 20.4 | 77.9 ± 20.8 | 75.9 ± 19.3 | 2.0 (−4.4 to 8.4) |
| Difference between post-dialysis weight and EDW (kg) | 0.2 ± 1.3 | 0.3 ± 1.3 | −0.1 ± 1.3 | 0.4 (−0.1 to 0.8) |
| Treatment time (minutes) | 219.0 ± 23 | 220.4 ± 23.1 | 214 ± 22.2 | 6.4 (−0.7 to 13.6) |
| Equilibrated Kt/V | 1.5 ± 0.3 | 1.5 ± 0.3 | 1.4 ± 0.2 | 0.05 (−0.03 to 0.1) |
| Laboratory parameters | ||||
| Serum albumin (g/dL) | 3.8 ± 0.4 | 3.8 ± 0.4 | 3.7 ± 0.5 | 0.1 (−0.02 to 0.3) |
| Hgb (g/dL) | 10.6 ± 0.9 | 10.7 ± 0.9 | 10.5 ± 0.9 | 0.2 (−0.1 to 0.5) |
| Serum sodium (mmol/L) | 138.6 ± 3.1 | 138.7 ± 3.0 | 138.7 ± 3.5 | −0.005 (−1.0 to 1.0) |
| Serum potassium (mmol/L) | 4.7 ± 0.6 | 4.7 ± 0.6 | 4.6 ± 0.5 | 0.04 (−0.1 to 0.2) |
BMI, body mass index; EDW, estimated dry weight; Hgb, hemoglobin; IDWG, interdialytic weight gain; n.a., not applicable.
Changes in ScvO2 on a treatment level
We observed treatments where ScvO2 decreased (negative trend) as well as treatments where ScvO2 increased (positive trend). Figures 1 shows examples from two different patients. A total of 62.4% of all treatments showed a ScvO2 decline during dialysis (Figure 2).
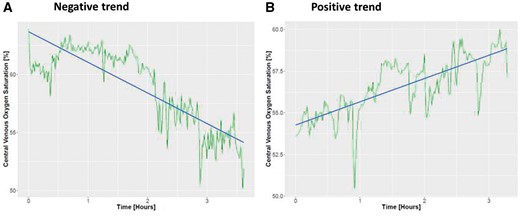
Changes in ScvO2 during a hemodialysis treatment for two different patients. (A) Negative trend and (B) positive trend. Green lines represent actual ScvO2 reading and the blue line represents the regression line fitted to the data.
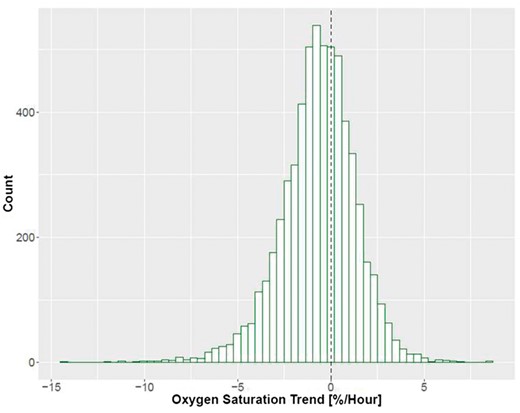
Distribution of ScvO2 trend on a treatment level. Dotted line denotes a slope of zero, meaning no change in ScvO2 throughout treatment.
Patient-level relationship between ScvO2 trend and cUFV
To analyze the relationship between the ScvO2 trend and cUFV, we combined all the treatment-level ScvO2 trends and cUFV data on a patient level. Examples are illustrated in Figure 3. Figure 3A shows a patient with an inverse (i.e. negative) ScvO2/cUFV relationship. In this figure, each green dot represents one dialysis treatment. Of note, data points with a ScvO2 trend >0 indicate treatments where ScvO2 increased. In the patient depicted in Figure 3A, a low cUFV (e.g. Point 1) was associated with a positive ScvO2 trend, while a high cUFV (e.g. Point 2) was associated with a negative ScvO2 trend, meaning that ScvO2 decreased during those treatments. Therefore, in this patient, with increasing cUFV, the intradialytic ScvO2 trend changed from increasing, to zero, to decreasing.
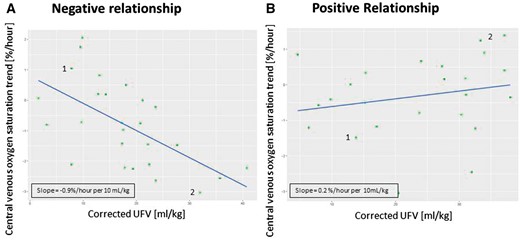
Examples showing changes in ScvO2 over cUFV in two patients. Each green dot represents a treatment; blue lines represent the regression line. (A) Negative ScvO2/cUFV relationship where Point 1 indicates a dialysis treatment with low cUFV and a positive ScvO2 trend and Point 2 indicates a dialysis treatment with a high cUFV and a negative ScvO2 trend; (B) positive ScvO2/cUFV relationship where Point 1 represents a low cUFV and a negative ScvO2 trend and Point 2 indicates a high cUFV and a positive ScvO2 trend.
In contrast, Figure 3B demonstrates a patient with a positive ScvO2/cUFV slope. At low levels of cUFV (e.g. Point 1), the ScvO2 trend is negative (meaning that ScvO2 decreased during the treatment), while at high levels of cUFV the ScvO2 trend is positive (meaning that ScvO2 increases during the treatment).
A vast majority of patients (80%) showed an inverse ScvO2/cUFV relationship (Figure 4), akin to the patient example in Figure 3A. Figure 5 shows on a population level the ScvO2/cUFV relationship. Blue lines represent patients with a negative ScvO2/cUFV slope and red lines those with a positive slope. The purple line represents the population fixed-effect slope derived from the linear mixed model, slope of −0.03 (P < 0.001). After taking into account fixed and random effects, we find that on a population level increasing cUFV is associated with lower ScvO2 trend, meaning that most patients have a decrease in ScvO2 during dialysis with higher cUFV. The sensitivity analysis excluding treatments with rapid RBV changes showed a materially identical slope of the population fixed effect (Supplementary Figure S2).
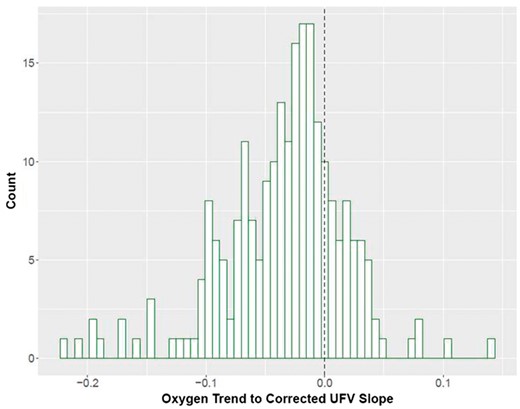
Distribution of ScvO2/cUFV slopes. The dotted line represents a flat relationship, meaning that there is no change in ScvO2 trend regardless of the cUFV.
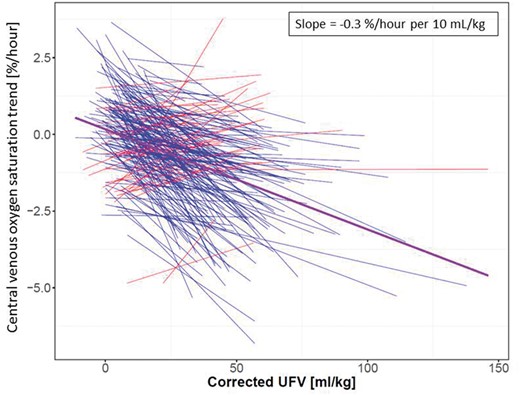
Linear mixed model of ScvO2 and corrected ultrafiltration. Each line represents an individual patient, blue lines indicate patients with a negative relationship and red lines show patients with a positive relationship. The purple line is population fixed-effect slope derived from the linear mixed model.
Comparison of patients stratified by ScvO2/cUFV relationship (Table 1)
Patients with negative ScvO2/cUFV slopes had higher UFVs (2.0 ± 0.8 versus 1.7 ± 0.8 L, difference 0.3 L; 95% CI 0.04–0.5) as compared with patients with positive ScvO2/cUFV. There were no differences in the prevalence of diabetes mellitus, CHF and COPD or other patient and treatment parameters.
Relationship between ScvO2 trend and pre-HD SBP, post-HD SBP and peridialytic SBP change
Neither pre-HD SBP nor post-HD SBP differed between the two groups (Table 1). To better evaluate the relationship between ScvO2 and peridialytic SBP changes (delta SBP) on a population level, we used a linear mixed model to generate a fixed-effect slope (Figure 6). Each green line in Figure 6 represents a linear regression line relating delta SBP versus ScvO2 trend for an individual patient. The purple line indicates the population fixed effect. We found that on a population level, when there is a decrease in SBP during dialysis, ScvO2 also tends to decrease during HD with a slope of 0.1%/h/10 mmHg.
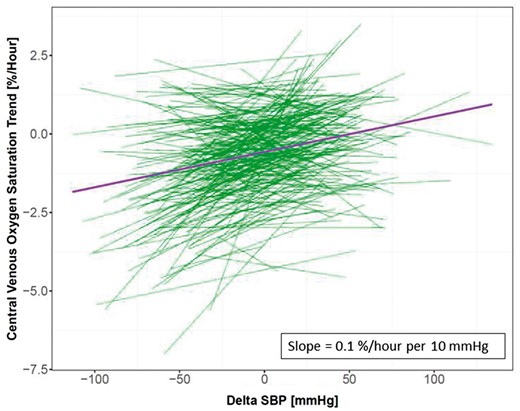
Linear mixed model of ScvO2 trend and peridialytic change in SBP (delta SBP). Each green line represents the relationship in an individual patient, while the purple line indicates the fixed-effect slope on a population level derived from the linear mixed model.
DISCUSSION
To date, this is the largest study exploring the relationship between ScvO2 and cUFV in chronic HD patients. The main finding of this research in a diverse population of chronic HD patients is an inverse relationship between intradialytic ScvO2 change and cUFV, meaning that most patients at high cUFV experience a more pronounced intradialytic ScvO2 decline.
We hypothesize that this finding is driven by a decline in cardiac preload when UFR exceeds plasma refill rate. This preload reduction may result in a drop in stroke volume, cardiac output and decreased tissue perfusion, such as decreased cardiac microcirculation leading to an increase in stunned myocardial segments.
In the absence of measurements of cardiac output and UBBF, our hypothesis is based on the following rationale. The CVC tip typically resides at either the superior vena cava or the right atrium [10]. Therefore, the oxygen saturation in the venous blood flowing in a CVC resembles ScvO2. The physiological determinants of ScvO2 can be appreciated by rearranging Fick’s equation. While the original Fick’s equation was used to calculate cardiac output based on measurements of mixed venous oxygen saturation in the pulmonary artery, the equation also holds true for local territories of the circulation where the oxygen saturation of the outflowing venous blood is known. Compared with the ‘classical’ Fick’s equation, in our case, mixed venous oxygen saturation has been replaced with ScvO2 and cardiac output with UBBF.
It becomes clear from that rearranged Fick’s equation that a decrease in ScvO2 can be due to (i) a decrease in SaO2, (ii) an increase in upper body oxygen consumption, (iii) a decrease in Hgb level and (iv) a decrease in UBBF. K is a constant that describes the amount of oxygen carried by Hgb. Recent studies in HD patients reported a biphasic intradialytic SaO2 dynamic, where an initial SaO2 drop is followed by a rise, so that SaO2 returns to above starting levels by the end of dialysis [11, 12]. Therefore, changes in intradialytic SaO2 are unlikely to explain the intradialytic ScvO2 decrease. At rest, the brain is by far the largest consumer of oxygen in the upper body. Brain oxygen consumption appears to be stable, except in extreme situations, such as general anesthesia or stroke; therefore, it is reasonable to assume that brain oxygen consumption does not change materially during HD [13, 14]. Because of ultrafiltration Hgb levels generally rise during HD, making Hgb an unlikely candidate to explain the ScvO2 drop observed in the majority of HD patients.
This leaves us with a decline in UBBF as the most plausible explanation for the ScvO2 drop. In situations where UFR outpaces plasma refill rate from the interstitial to intravascular space, right ventricular preload and stroke volume will drop and—if not compensated for by a sufficient increase in heart rate—a decline in cardiac output will ensue. A decline in cardiac output has recently been shown in an elaborate study utilizing cardiac magnet resonance imaging (MRI) during dialysis [15]. In this study, stroke volume and cardiac index declined during dialysis, and the degree of decline was inversely and significantly corrected with UFV. Importantly, in this study, the number of stunned myocardial segments was positively correlated with UFV. Another study that compared cardiac parameters during conventional and extended HD found that in extended HD, UFR was lower and UFV was not significantly different, and there was less pronounced decrease in cardiac output compared with conventional HD [16]. Therefore, not only is the absolute change in UBBF important, but also the rate of the change likely plays a role.
As depicted in Figures 3–5, ScvO2/cUFV associations differ widely between individual patients. Additionally, there is a large variation in cUFV across treatments per patient. This variation may be due to timing of treatment (after a short- or long-interdialytic interval), early termination or extra HD treatments, and changes in residual renal function during the study period. On a population level, the fixed effect derived from the linear mixed model indicates that ScvO2 decreases once cUFV exceeds 5 mL/kg body weight (Figure 5). This cUFV translates into an UFV of 400 mL in an 80 kg patient. This is in line with the aforementioned MRI study by Buchanan et al., where stroke volume and cardiac index fell at even smaller UFV [15].
Interestingly, while there is no difference between pre-HD and post-HD SBP between patients with a positive or negative ScvO2 trend, on a population level the larger the decrease in peridialytic SBP the larger the decrease in ScvO2 trend. This finding may indicate the effect of fluid removal on SBP.
Of note, a minority of patients showed a positive ScvO2 trend with higher cUFV. We hypothesize that those patients may actually be well above their dry weight while being prescribed a too low UFV. In the presence of excess fluid in the interstitial compartment and thus elevated interstitial hydrostatic pressures, the plasma refill rate can keep up with UFR and hence prevents a decline in cardiac preload and cardiac output [17, 18]. It is important to appreciate that fluid overload and interdialytic weight gain (the main determinant of UFV) are not necessarily correlated [19]. While these population-level results are important, we of course consider the inter-individual variability in the ScvO2 /cUFV relationship (Figure 5). To what extent a patient’s ScvO2 /cUFV relationship is associated with outcomes warrant further studies.
Our study expands the results of Harrison et al. [9]. In their study of 18 prevalent HD patients, the authors measured ScvO2 at the end of HD and found that higher cUFV was associated with low ScvO2. However, only examining end-dialysis ScvO2 levels precludes an assessment of intradialytic ScvO2 dynamics. Therefore, we chose to expand that research and determined the association between ScvO2 trend throughout the entire dialysis treatment and cUFV. Based on their findings, Harrison et al. hypothesized that ScvO2 may serve as a marker of circulatory stress induced by ultrafiltration. Our findings in a 12 times larger patient population with multiple treatments per patient support that notion. As a next step, it will be important to directly test this hypothesis by comprehensive hemodynamic studies during dialysis.
In our study cohort, only very limited data regarding blood recirculation is available. Depending on catheter type and tip location, recirculation has been estimated between 0% and 23% [20]. The effect of blood recirculation on ScvO2 is currently unclear. However, we expect this to be limited, given the poor solubility of oxygen in plasma and the resultant minimal oxygen transfer across the dialyzer membrane [21].
Our study suggests that ScvO2 could evolve into a novel marker to monitor hemodynamic response to HD. In addition, it is conceivable that ScvO2 could serve as input into a system that controls the UFR. A recent study also supports the role of oxygen monitoring during HD as the researchers found the variability of oxygen saturation to be associated with IDH in both patients with arteriovenous fistula and those with CVCs [22]. Such a control system could prevent undue ScvO2 drops by appropriate UFR adjustments; this could benefit in particular those with frequent episodes of IDH and incident HD patients, who have both a high morbidity and mortality and frequently use CVC as vascular access [1, 23].
Admittedly, our study has a few limitations. First, as it is retrospective in nature, we are unable to determine causality. Additionally, no technical means (e.g. bioimpedance) to quantitate patients’ fluid status are routinely available in US dialysis facilities. Knowledge of the fluid status would have allowed us to further explore the association between the patient ScvO2 and cUFV, since this relationship may be influenced by the vascular refilling dynamics and, consequently, by fluid status and ‘dry’ weight. We do not have echocardiograms on these patients, so the relationship between ScvO2/cUFV and cardiac output remains conjectural. Also we do not have the availability of SaO2 in these patients, since pulse oximetry is not done as part of standard of care in our dialysis facilities. While intradialytic blood pressures were not routinely captured in our EHR database, we do have pre- and post-SBP. Our analysis shows that these SBPs were neither clinically nor statistically different between the two groups (Table 1). Lastly, the exact positions of the CVC tips are unknown to us, since our electronic health records do not report the related chest X-ray findings. Strengths are the diversity and large number of patients studied, the availability of multiple HD sessions per patients, and automatic and frequent intradialytic ScvO2 measurements.
In conclusion, cUFV and intradialytic ScvO2 dynamics are inversely correlated, so that high cUFV is associated with a ScvO2 decrease in the majority of our HD patients. We hypothesize that a decline in ScvO2 reflects a reduction in cardiac output. Future studies with direct hemodynamic measurements are warranted to further elucidate the relation between ScvO2 dynamics and circulatory stress on dialysis and their relation with outcome.
FUNDING
L.C. is supported in part by NIH (5T32DK007757 - 18).
CONFLICT OF INTEREST STATEMENT
P.K. holds stock options in Fresenius Medical Care. L.C. is supported in part by the NIH (5T32DK007757 – 18). S.T. reports performance shares and personal fees from Fresenius Medical Care during the conduct of the study. J.P.K. reports grants from Fresenius Medical Care outside the submitted work. The other authors declared no conflict of interest. The results presented in this article have not been published previously in whole or part.


Comments