


ABSTRACT
Patients starting renal replacement therapy (RRT) for end-stage renal disease often present with one or more co-morbidities. This study explored the prevalence of co-morbidities in patients who started RRT in Europe during the period from 2005 to 2014.
Using data from patients aged 20 years or older from all 11 national or regional registries providing co-morbidity data to the European Renal Association – European Dialysis and Transplant Association Registry, we examined the prevalence of the following co-morbidities: diabetes mellitus (DM) (primary renal disease and/or co-morbidity), ischaemic heart disease (IHD), congestive heart failure (CHF), peripheral vascular disease (PVD), cerebrovascular disease (CVD) and malignancy.
Overall, 70% of 7578 patients who initiated RRT in 2014 presented with at least one co-morbidity: 39.0% presented with DM, 25.0% with IHD, 22.3% with CHF, 17.7% with PVD, 16.4% with malignancy and 15.5% with CVD. These percentages differed substantially between countries. Co-morbidities were more common in men than in women, in older patients than in younger patients, and in patients on haemodialysis at Day 91 when compared with patients on peritoneal dialysis. Between 2005 and 2014 the prevalence of DM and malignancy increased over time, whereas the prevalence of IHD and PVD declined.
More than two-thirds of patients initiating RRT in Europe have at least one co-morbidity. With the rising age at the start of RRT over the last decade, there have been changes in the co-morbidity pattern: the prevalence of cardiovascular co-morbidities decreased, while the prevalence of DM and malignancy increased.
INTRODUCTION
Patients starting renal replacement therapy (RRT) for end-stage renal disease (ESRD) seldom have only the burden of their renal disease that resulted in ESRD. In addition they often have one or more of the following co-morbidities: diabetes mellitus (DM), ischaemic heart disease (IHD), congestive heart failure (CHF), peripheral vascular disease (PVD), cerebrovascular disease (CVD) and malignancy. Evaluating the prevalence of these conditions is considered important as the presence of co-morbidities in patients receiving RRT may indicate increased patient frailty [1], lower physical inactivity [2], higher mortality [3, 4], altered RRT modality choice [less peritoneal dialysis (PD)] [5, 6] and reduced access to renal transplantation [7].
Whilst we know that the age of the incident RRT population in Europe has increased considerably over the last three or four decades, and the distribution of primary renal diseases (PRDs) has changed [8, 9], little is known about changes in the prevalence of co-morbidities in patients initiating RRT. Moreover, the most recent report on the prevalence of co-morbidities in patients starting RRT in Europe was published in 2005 [7].
Therefore, the aims of our study were: (i) to present the prevalence of co-morbidities in patients who started RRT in Europe in 2014, and (ii) to examine trends over time in the prevalence of co-morbidities in this population over the 10-year period between 2005 and 2014.
MATERIALS AND METHODS
Study population
Patients aged 20 years or older who initiated chronic RRT between 1 January 2005 and 31 December 2014 from all 11 national (Austria, Denmark, Finland, Iceland, Norway, Sweden) or regional renal registries (Dutch- and French-speaking Belgium, Spanish regions of Aragon, Catalonia and Galicia) providing co-morbidity data to the European Renal Association – European Dialysis and Transplantation Association (ERA-EDTA) Registry were included in this study. The national and regional renal registries had full coverage (100%) of the general population in the participating countries and regions.
Definitions
This study focused on the following six co-morbidities: DM, IHD, CHF, PVD, CVD and malignancy. For diabetic patients starting RRT, DM could be the PRD or a co-morbidity. The possible combinations are displayed below:
| DM | As co-morbidity | |||
|---|---|---|---|---|
| Yes | No | |||
| As PRD | Yes | a | b | |
| No | c | d | ||
| DM | As co-morbidity | |||
|---|---|---|---|---|
| Yes | No | |||
| As PRD | Yes | a | b | |
| No | c | d | ||
| DM | As co-morbidity | |||
|---|---|---|---|---|
| Yes | No | |||
| As PRD | Yes | a | b | |
| No | c | d | ||
| DM | As co-morbidity | |||
|---|---|---|---|---|
| Yes | No | |||
| As PRD | Yes | a | b | |
| No | c | d | ||
However, patients with DM as PRD were in some registries also recorded as having DM as co-morbidity (a), whereas in other registries DM was not recorded as co-morbidity (b). To enable comparisons between registries we composed the following subcategories for DM:
DM recorded as PRD or as a co-morbidity in addition to another PRD, further referred to as DM (PRD and/or co-morbidity), which is the sum of (a), (b) and (c);
DM recorded as co-morbidity only, including only patients with a PRD other than DM (c); and
DM recorded as PRD, independent of whether DM was recorded as co-morbidity or not (a + b).
Definitions of each of the co-morbid conditions are given in Appendix 1. Missing data on a co-morbidity was treated as a separate category, and these patients were not included in analyses considering patients with (or without) a particular co-morbidity. Data on CHF were not collected by Spain (Catalonia) and Sweden. The prevalence of the individual co-morbidities was calculated as the percentage of patients with the co-morbidity at the onset of RRT. PRDs were defined according to both the old and new (2012) ERA-EDTA coding systems and subsequently classified into eight groups [10].
Statistical analysis
Prevalence of co-morbidities in 2014
To explore differences in patient characteristics such as age, sex, PRD and treatment modality between patients with and without co-morbidities, we used conventional descriptive statistics. These analyses were based on patients commencing RRT in 2014 from all 11 national and regional registries. For this year we also analysed which combinations of co-morbidities occurred most frequently.
Trends over time
We examined 10-year trends in the prevalence of the co-morbidities using data from patients who started RRT between 2005 and 2014 from the four registries that provided co-morbidity data for this entire period: i.e. Catalonia, Denmark, Norway and Sweden. Data on the prevalence of CHF was only provided by Denmark and was therefore not included in the 10-year trend analysis. Additional analyses of 5-year trends (2010–14) were performed using data from 10 registries, i.e. all participating registries except Aragon. The 5-year trends for CHF included data from seven registries: Austria, Belgium (Dutch- and French-speaking), Denmark, Finland, Iceland and Spain (Galicia). Additionally, 5-year trends were also examined including only data from those four registries that were used for the 10-year trends, and these results were compared with the 5-year trends using data from all registries. For these trend analyses percentages were standardized to the age and sex distribution of the total group of incident patients. Trends were examined for the total group of patients, and for subgroups based on age (i.e. 20–64, ≥65 years), sex and treatment modality at Day 91. The slope of the trends, i.e. the annual percentage change (APC), was computed using Poisson regression as provided by the Joinpoint regression program 4.0.4. Details of this method have been described previously [11]. All analyses were performed using SAS software 9.4 or Joinpoint 4.0.4. A P < 0.05 was considered statistically significant.
RESULTS
Prevalence of co-morbidities in 2014
In 2014, a total of 7578 patients initiated RRT in 11 countries/regions in Europe. The prevalence of co-morbidities by country is shown in Table 1. In 2014, 70.0% of the incident RRT patients had at least one co-morbidity. DM (PRD and/or co-morbidity) was the most frequent co-morbidity (39.5%), IHD was the second most prevalent co-morbidity (25.0%), followed by CHF (22.3%), PVD (17.7%), malignancy (16.4%) and CVD (15.5%). The prevalence of DM (PRD and/or co-morbidity) ranged from 27.5% in Iceland to 47.4% in Finland, while the prevalence of DM (co-morbidity only) ranged from 10.5% in Finland to 22.3% in the Dutch-speaking part of Belgium. The prevalence of IHD ranged from 14.8% in Spain (Aragon) to 40.0% in Iceland, CHF from 9.0% in Finland to 30.5% in Dutch-speaking Belgium, PVD from 9.3% in Spain (Aragon) to 23.4% in Dutch-speaking Belgium, CVD from 5.6% in Spain (Aragon) to 29.1% in Austria and the prevalence of malignancy ranged from 5.6% in Spain (Aragon) to 20.2% in Dutch-speaking Belgium. The highest percentage of patients with no co-morbidities at the onset of RRT was found in Spain (Aragon) (42.6%), and the lowest percentage in the Dutch-speaking part of Belgium (23.9%). The percentage of patients with three or more co-morbidities at the start of RRT varied between 6.8% in Spain (Aragon) and 27.8% in Austria. The data did not show a north–south gradient.
Co-morbidities in adult patients starting RRT in 2014, by country
| DM | ||||||||||||||||||||||||||
|---|---|---|---|---|---|---|---|---|---|---|---|---|---|---|---|---|---|---|---|---|---|---|---|---|---|---|
| All | PRD and/or co-morbidity | Co-morbidity only | PRD | IHD | CHFa | PVD | CVD | Malignancy | Number of co-morbiditiesb | |||||||||||||||||
| Yes | No | Miss | Yes | Yes | Yes | No | Miss | Yes | No | Miss | Yes | No | Miss | Yes | No | Miss | Yes | No | Miss | 0 | 1 | 2 | ≥3 | |||
| Country/region | N | Pmp | % | % | % | % | % | % | % | % | % | % | % | % | % | % | % | % | % | % | % | % | % | % | % | % |
| Austria | 1021 | 150 | 41.9 | 53.2 | 4.9 | 16.6 | 25.4 | 29.5 | 64.3 | 6.3 | 23.3 | 70.5 | 6.2 | 22.9 | 70.8 | 6.3 | 29.1 | 64.6 | 6.3 | 17.5 | 76.5 | 6.0 | 26.9 | 25.9 | 19.4 | 27.8 |
| Belgium (Dutch-speaking) | 1145 | 227 | 40.3 | 57.6 | 2.1 | 22.3 | 18.1 | 34.2 | 63.1 | 2.6 | 30.5 | 66.8 | 2.7 | 23.4 | 74.0 | 2.6 | 17.9 | 79.6 | 2.5 | 20.2 | 77.4 | 2.4 | 23.9 | 25.7 | 24.7 | 25.7 |
| Belgium (French-speaking) | 828 | 227 | 37.8 | 60.4 | 1.8 | 15.1 | 22.7 | 20.4 | 77.3 | 2.3 | 21.6 | 76.1 | 2.3 | 12.8 | 84.9 | 2.3 | 10.5 | 87.2 | 2.3 | 12.2 | 85.5 | 2.3 | 40.7 | 27.4 | 14.1 | 17.8 |
| Denmark | 741 | 170 | 36.2 | 63.6 | 0.3 | 11.5 | 24.7 | 24.0 | 75.7 | 0.3 | 19.7 | 80.0 | 0.3 | 17.3 | 82.5 | 0.3 | 18.8 | 81.0 | 0.3 | 19.4 | 80.3 | 0.3 | 26.7 | 33.3 | 24.3 | 15.7 |
| Finland | 447 | 105 | 47.4 | 50.1 | 2.5 | 10.5 | 36.9 | 22.8 | 75.4 | 1.8 | 8.9 | 85.7 | 5.4 | 17.2 | 80.5 | 2.2 | 11.2 | 86.1 | 2.7 | 15.0 | 77.2 | 7.8 | 31.5 | 35.8 | 17.7 | 15.0 |
| Icelandc | 40 | 84 | 27.5 | 72.5 | 0 | 15.0 | 12.5 | 40.0 | 55.0 | 5.0 | 27.5 | 62.5 | 10.0 | 17.5 | 65.0 | 17.5 | 12.5 | 82.5 | 5.0 | 12.5 | 85.0 | 2.5 | 37.5 | 20.0 | 15.0 | 27.5 |
| Norway | 511 | 132 | 33.1 | 66.9 | 0 | 15.5 | 17.6 | 28.6 | 71.0 | 0.4 | 18.0 | 81.4 | 0.6 | 19.6 | 80.0 | 0.4 | 16.6 | 83.0 | 0.4 | 19.2 | 80.8 | 0 | 31.3 | 31.1 | 18.6 | 19.0 |
| Spain (Aragon) | 162 | 150 | 41.4 | 58.6 | 0 | 16.7 | 24.7 | 14.8 | 85.2 | 0 | 18.5 | 81.5 | 0 | 9.3 | 90.7 | 0 | 5.6 | 94.4 | 0 | 5.6 | 94.4 | 0 | 42.6 | 29.6 | 21.0 | 6.8 |
| Spain (Catalonia) | 1169 | 195 | 40.0 | 54.5 | 5.5 | 17.5 | 22.5 | 20.5 | 73.3 | 6.2 | – | – | – | 17.9 | 76.0 | 6.2 | 10.6 | 83.2 | 6.2 | 15.2 | 72.6 | 12.1 | 39.8 | 28.8 | 21.5 | 9.9 |
| Spain (Galicia) | 396 | 172 | 41.4 | 58.6 | 0 | 12.6 | 28.8 | 19.7 | 80.3 | 0 | 23.0 | 77.0 | 0 | 19.7 | 80.3 | 0 | 8.6 | 91.4 | 0 | 14.1 | 85.9 | 0 | 31.1 | 33.1 | 20.2 | 15.7 |
| Sweden | 1140 | 152 | 38.2 | 61.8 | 0 | 14.2 | 23.9 | 22.5 | 77.5 | 0 | – | – | – | 10.9 | 89.1 | 0 | 12.2 | 87.8 | 0 | 15.9 | 84.1 | 0 | 40.1 | 32.5 | 17.6 | 9.8 |
| All countries | 7578 | 168 | 39.5 | 58.3 | 2.2 | 15.9 | 23.5 | 25.0 | 72.4 | 2.6 | 22.3 | 75.0 | 2.7 | 17.7 | 79.7 | 2.7 | 15.5 | 81.9 | 2.6 | 16.4 | 79.8 | 3.8 | 30.0 | 29.1 | 20.3 | 20.6 |
Percentages are row percentages. Percentages may not add up because of rounding off.
Pmp, per million population; miss, missing.
For ‘All countries’ data from Spain (Catalonia) and Sweden were excluded.
For the sum of co-morbidities, DM was included when present as co-morbidity or as PRD; for Spain (Catalonia) and Sweden the number of co-morbidities does not include CHF; for ‘All countries’ data from Spain (Catalonia) and Sweden were excluded.
Data included patients starting RRT in 2013 and 2014.
Patient characteristics of patients presenting with co-morbidities at the start of RRT in 2014
Table 2 presents the baseline characteristics of the study population by co-morbidity. Among patients with co-morbidities, the median age ranged from 70.0 years in patients with DM (PRD and/or co-morbidity) to 74.8 years in those with CHF. For all co-morbidities, patients with the co-morbidity had a higher median age and a lower probability to start RRT on PD or kidney transplantation than those without the condition. In most co-morbidity groups except in patients with CHF or malignancy, the most frequent PRD was DM. Among patients with DM (co-morbidity only), hypertension/renal vascular disease was the most frequent PRD.
Baseline characteristics of patients starting RRT in Europe in 2014, by co-morbidity
| DM | |||||||||||||||
|---|---|---|---|---|---|---|---|---|---|---|---|---|---|---|---|
| All patients | PRD and/or co-morbidity | Co-morbidity only | PRD | IHD | CHFa | PVD | CVD | Malignancy | |||||||
| (N = 7578) | Yes | No | Yes | Yes | Yes | No | Yes | No | Yes | No | Yes | No | Yes | No | |
| % of patients | 100 | 39.5 | 58.3 | 15.9 | 23.5 | 25.0 | 72.4 | 22.3 | 75.0 | 17.7 | 79.7 | 15.5 | 81.9 | 16.4 | 79.8 |
| Sex, % male | 66.0 | 67.9 | 64.6 | 67.4 | 68.2 | 73.9 | 63.3 | 67.2 | 66.0 | 74.3 | 64.1 | 69.8 | 65.3 | 70.0 | 65.2 |
| Age (years), median | 68.5 | 70.0 | 67.3 | 73.2 | 67.6 | 73.3 | 66.4 | 74.8 | 66.5 | 73.5 | 67.2 | 72.3 | 67.6 | 73.3 | 67.3 |
| (IQR) | 56.4–77.2 | 61.1–77.0 | 53.3–77.4 | 65.3–79.5 | 58.1–75.0 | 66.1–79.6 | 53.1–75.9 | 66.9–80.7 | 54.3–75.6 | 66.1–79.2 | 54.3–76.4 | 65.2–78.6 | 54.9–76.9 | 66.3–79.7 | 54.6–76.6 |
| PRD | |||||||||||||||
| % Glomerulonephritis | 12.2 | 5.2 | 16.9 | 13.0 | – | 6.8 | 14.1 | 6.2 | 13.5 | 5.4 | 13.8 | 5.0 | 13.6 | 7.1 | 13.3 |
| % Pyelonephritis | 4.2 | 1.6 | 6.0 | 4.0 | – | 2.0 | 5.1 | 1.6 | 5.2 | 1.4 | 4.9 | 2.1 | 4.7 | 7.6 | 3.6 |
| % PKD | 5.9 | 1.5 | 8.8 | 3.7 | – | 3.1 | 6.8 | 2.0 | 6.5 | 2.5 | 6.6 | 3.8 | 6.3 | 3.1 | 6.5 |
| % DM, type 1 | 4.8 | 12.2 | – | – | 20.5 | 4.7 | 4.9 | 3.2 | 5.2 | 5.1 | 4.8 | 4.0 | 5.0 | 1.3 | 5.5 |
| % DM, type 2 | 18.6 | 47.1 | – | – | 79.1 | 27.6 | 15.7 | 23.8 | 17.4 | 27.9 | 16.7 | 26.9 | 17.3 | 13.4 | 20.1 |
| % DM, both types | 23.5 | 59.6 | – | – | 100 | 32.4 | 20.7 | 27.0 | 22.6 | 33.3 | 21.6 | 31.0 | 22.4 | 14.7 | 25.7 |
| % HT/RVD | 17.8 | 12.3 | 21.8 | 30.5 | – | 22.3 | 16.6 | 23.0 | 18.1 | 25.6 | 16.4 | 26.1 | 16.5 | 18.0 | 18.1 |
| % Miscellaneous | 21.7 | 11.6 | 28.9 | 28.6 | – | 21.6 | 22.1 | 29.0 | 22.6 | 19.5 | 22.5 | 19.0 | 22.5 | 35.4 | 19.4 |
| % Unknown/missing | 14.6 | 8.2 | 17.6 | 20.2 | – | 11.9 | 14.5 | 11.2 | 11.4 | 12.3 | 14.1 | 13.0 | 14.0 | 14.1 | 13.3 |
| Modality at start of RRT | |||||||||||||||
| % HD | 78.7 | 83.3 | 75.7 | 86.3 | 81.3 | 84.9 | 76.7 | 88.1 | 79.3 | 86.4 | 77.1 | 86.3 | 77.3 | 86.7 | 77.3 |
| % PD | 16.7 | 14.5 | 18.2 | 12.1 | 16.2 | 13.7 | 17.8 | 11.5 | 16.3 | 12.5 | 17.6 | 12.6 | 17.5 | 12.2 | 17.7 |
| % Kidney transplant | 4.6 | 2.2 | 6.1 | 1.7 | 2.6 | 1.4 | 5.5 | 0.4 | 4.4 | 1.1 | 5.3 | 1.1 | 5.1 | 1.1 | 5.0 |
| Modality at Day 91 | |||||||||||||||
| % HD | 76.8 | 82.5 | 73.1 | 84.9 | 80.9 | 83.5 | 74.7 | 86.5 | 77.7 | 85.5 | 75.1 | 85.4 | 75.3 | 85.2 | 75.4 |
| % PD | 17.5 | 15.0 | 19.2 | 12.8 | 16.4 | 15.0 | 18.4 | 12.9 | 17.0 | 13.1 | 18.4 | 13.6 | 18.3 | 13.3 | 18.4 |
| % Kidney transplant | 5.7 | 2.4 | 7.6 | 2.1 | 2.6 | 1.5 | 6.8 | 0.5 | 5.2 | 1.3 | 6.4 | 1.0 | 6.3 | 1.4 | 6.1 |
With exception of the first row, all percentages are column percentages. Percentages may not add up because of rounding off.
PKD, polycystic kidney disease; HT/RVD, hypertension/renal vascular disease; IQR, interquartile range.
Data from Spain (Catalonia) and Sweden were excluded.
Table 3 shows the prevalence of co-morbidities for patients initiating RRT in 2014, stratified by sex, age, PRD and treatment modality at Day 91. All co-morbidities were more common in men than in women. As expected, the prevalence of all co-morbidities increased with age at the onset of RRT, with the exception of DM (PRD and/or co-morbidity) and CVD, which were more prevalent among patients aged between 65 and 74 years than in the oldest subgroup (≥75 years). Patients with glomerulonephritis and polycystic kidney disease as primary kidney disease had the lowest prevalence of co-morbidities. Malignancy was more common in patients with pyelonephritis and in patients with the PRD category miscellaneous than in other PRD categories. Subgroup analysis revealed that in the pyelonephritis category this was mainly due to a high prevalence of malignancy as co-morbidity among patients with acquired obstructive uropathy (41% had malignancy, n = 156). In the category miscellaneous, the large proportion of patients with malignancy was caused by high percentages of malignancy among patients with myelomatosis/light chain deposit disease (82%, n = 114), kidney tumour (87%, n = 78) and traumatic or surgical loss of kidney (62%, n = 42). Among patients on haemodialysis (HD) at Day 91 after the initiation of RRT, the prevalence of all co-morbidities was higher than among patients on PD. As shown, DM (PRD and/or co-morbidity) was the most frequent condition in all subgroups. Among males, IHD was the second most common co-morbidity, whereas for females this was CHF.
Prevalence of co-morbidities for subgroups of patients starting RRT in 2014
| Subgroup | DM | |||||||||||
|---|---|---|---|---|---|---|---|---|---|---|---|---|
| PRD and/or co-morbidity | Co-morbidity only | PRD | IHD | CHFa | PVD | CVD | MAL | Number of co-morbiditiesa | ||||
| Yes | Yes | Yes | Yes | Yes | Yes | Yes | Yes | 0 | 1 | 2 | ≥3 | |
| % | % | % | % | % | % | % | % | % | % | % | % | |
| Sex | ||||||||||||
| Males | 40.6 | 16.3 | 24.3 | 28.1 | 22.6 | 19.9 | 16.3 | 17.4 | 26.7 | 28.9 | 21.6 | 22.8 |
| Females | 37.2 | 15.3 | 22.0 | 19.1 | 21.6 | 13.3 | 13.7 | 14.5 | 33.4 | 30.3 | 19.4 | 16.9 |
| Age at start of RRT | ||||||||||||
| 20–44 years | 22.6 | 3.7 | 18.9 | 3.8 | 6.5 | 3.0 | 4.4 | 2.7 | 63.2 | 27.3 | 7.7 | 1.8 |
| 45–64 years | 37.3 | 11.6 | 25.7 | 17.7 | 12.4 | 12.1 | 11.2 | 10.9 | 39.6 | 31.6 | 17.1 | 11.7 |
| 65–74 years | 47.1 | 18.8 | 28.3 | 30.6 | 24.9 | 21.8 | 20.0 | 20.7 | 18.8 | 29.8 | 24.4 | 27.0 |
| ≥75 years | 40.6 | 21.7 | 18.9 | 34.2 | 34.4 | 24.4 | 19.2 | 22.6 | 17.2 | 27.5 | 25.3 | 30.0 |
| PRD | ||||||||||||
| Glomerulonephritis | 17.0 | 17.0 | – | 14.0 | 11.7 | 7.8 | 6.4 | 9.5 | 59.8 | 22.1 | 10.6 | 7.5 |
| Pyelonephritis | 15.0 | 15.0 | – | 11.6 | 8.3 | 5.9 | 7.8 | 29.7 | 48.2 | 34.2 | 9.6 | 7.9 |
| PKD | 10.0 | 10.0 | – | 12.9 | 8.2 | 7.6 | 9.8 | 8.5 | 59.2 | 24.8 | 9.2 | 6.8 |
| DM, type 1 | 100 | – | 100 | 24.4 | 14.5 | 18.6 | 12.9 | 4.4 | 0 | 55.5 | 25.4 | 19.1 |
| DM, type 2 | 100 | – | 100 | 37.1 | 28.2 | 26.5 | 22.3 | 11.8 | 0 | 30.7 | 30.5 | 38.8 |
| DM, both types | 100 | – | 100 | 34.4 | 25.3 | 25.0 | 20.4 | 10.3 | 0 | 35.8 | 29.4 | 34.8 |
| HT/RVD | 27.3 | 27.3 | – | 31.3 | 27.0 | 25.4 | 22.7 | 16.6 | 27.1 | 26.8 | 23.0 | 23.1 |
| Miscellaneous | 21.0 | 21.0 | – | 24.9 | 26.9 | 15.9 | 13.5 | 26.8 | 33.0 | 28.7 | 19.1 | 19.2 |
| Unknown/missing | 22.1 | 22.1 | – | 20.4 | 21.5 | 14.9 | 13.7 | 15.9 | 38.9 | 27.4 | 18.9 | 14.9 |
| Treatment modality | ||||||||||||
| HD at Day 91 | 42.6 | 17.4 | 25.2 | 26.6 | 23.4 | 19.2 | 16.7 | 17.8 | 26.0 | 29.7 | 22.0 | 22.3 |
| PD at Day 91 | 34.1 | 11.6 | 22.5 | 21.0 | 17.0 | 12.9 | 11.7 | 12.2 | 36.7 | 31.3 | 17.2 | 14.8 |
| Tx at Day 91 | 16.9 | 6.0 | 10.9 | 6.5 | 2.2 | 4.0 | 2.7 | 4.0 | 65.5 | 27.5 | 6.0 | 1.0 |
Percentages are row percentages. Percentages may not add up because of rounding off.
MAL, malignancy; Tx, kidney transplant.
Data from Spain (Catalonia) and Sweden were excluded.
As shown in Table 4, 30.0% of the patients did not have any co-morbidity at the start of RRT. Among patients with only one co-morbidity DM was the most frequent condition (12.5%) and PVD the least frequent (1.9%). Moreover, the most frequent combinations of co-morbidities were DM plus IHD (3.5%), DM plus CHF (2.6%) and DM plus PVD (2.3%). All other combinations that occurred in at least 1% of the patients are listed in Table 4.
Top 15 combinations of co-morbidities in patients starting RRT in 2014
| Co-morbidity | n | % |
|---|---|---|
| No co-morbidity | 1583 | 30.0 |
| One co-morbidity | ||
| DM | 661 | 12.6 |
| MAL | 304 | 5.8 |
| CHF | 166 | 3.2 |
| IHD | 166 | 3.2 |
| CVD | 137 | 2.6 |
| PVD | 99 | 1.9 |
| Two co-morbidities | ||
| DM + IHD | 184 | 3.5 |
| DM + CHF | 135 | 2.6 |
| DM + PVD | 120 | 2.3 |
| IHD + CHF | 97 | 1.8 |
| DM + MAL | 97 | 1.8 |
| DM + CVD | 92 | 1.8 |
| Three co-morbidities | ||
| DM + IHD + CHF | 104 | 2.0 |
| DM + IHD + PVD | 89 | 1.7 |
| Four co-morbidities | ||
| DM + IHD + CHF + PVD | 52 | 1.0 |
DM was included when present as co-morbidity or as PRD.
MAL, malignancy.
Data from Spain (Catalonia) and Sweden were excluded.
Trends in the prevalence of co-morbidities
The 10-year trends in the percentages of co-morbidities among patients starting RRT between 2005 and 2014, based on data from Denmark, Norway, Spain (Catalonia) and Sweden, are presented in Figures 1–4. Throughout this time period, the percentage of patients with DM (PRD and/or co-morbidity) increased [APC 1.6%; 95% confidence interval (CI) 1.0–2.1], which appears to result from an increase among patients older than 65 years of age. Also the percentage of patients with DM (co-morbidity only) significantly increased over time in the overall incident population (APC 4.3%; 95% CI 3.4–5.3) and in all subgroups. On the other hand, the percentage of patients with DM (PRD) only remained stable over time in the total group, while it decreased in patients aged 20–64 years at the start of RRT (APC −1.2%; 95% CI −2.3 to − 0.1) and increased in those older than 65 years of age at the onset of RRT (APC 1.7%; 95% CI 0.6–2.7).
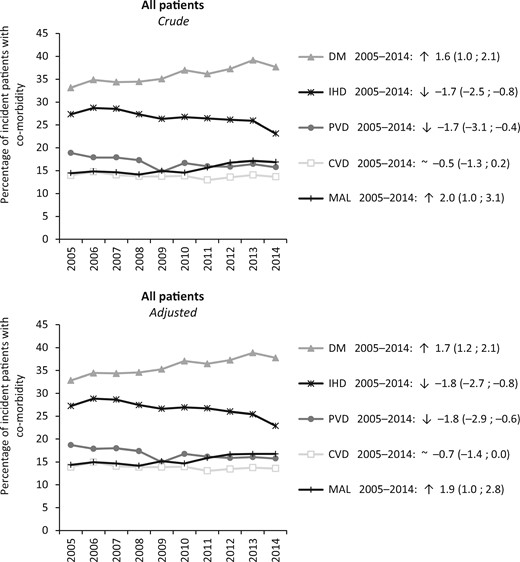
Percentages of patients with co-morbidities at the start of RRT during the period 2005–14 (n = 33 723), crude and standardized for the age and sex distribution of the incident RRT population, presented as the APC and 95% CI. DM (PRD and/or co-morbidity). MAL, malignancy.
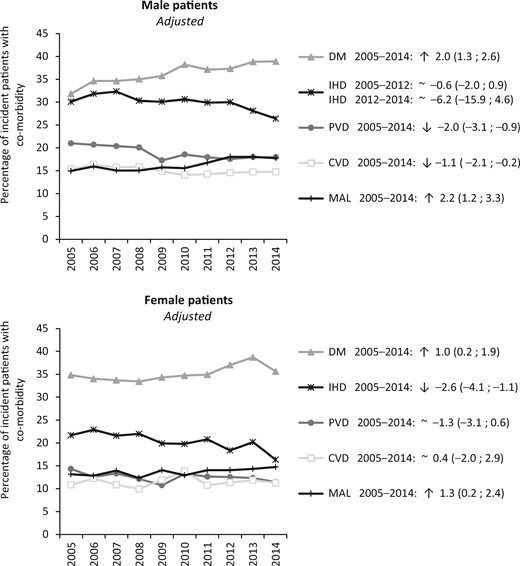
Percentages of male and female patients with co-morbidities at the start of RRT during the period 2005–14 (no. of males = 22 120 and no. of females = 11 603), standardized for the age distribution of the incident RRT population, presented as the APC and 95% CI. DM (PRD and/or co-morbidity). MAL, malignancy.
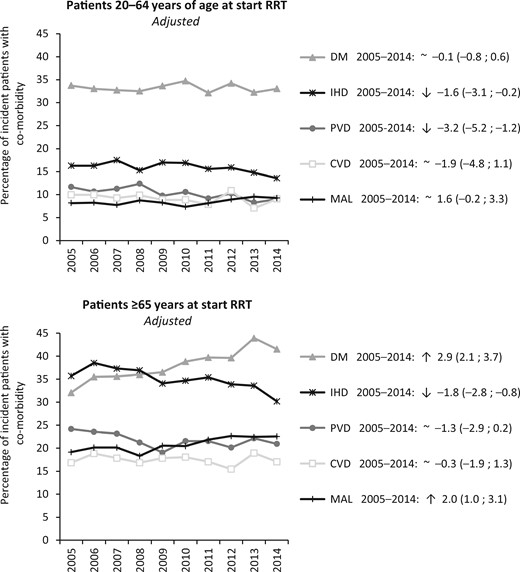
Percentages of patients younger and older than 65 years of age with co-morbidities at the start of RRT during the period 2005–14 (n <65 = 14 786 and n ≥65 = 18 937), standardized for the age and sex distribution of the incident RRT population, presented as the APC and 95% CI. DM (PRD and/or co-morbidity). MAL, malignancy.
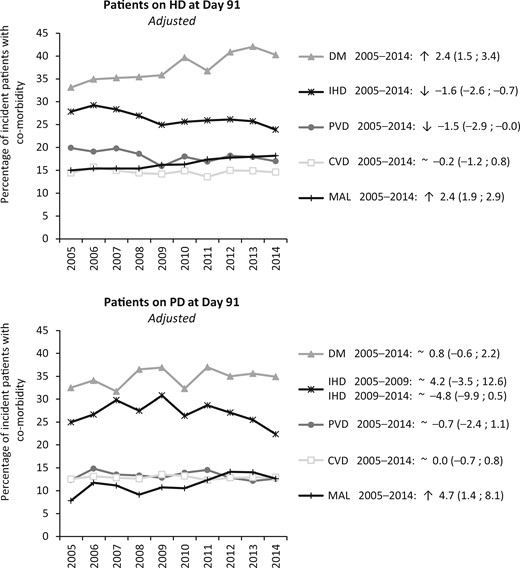
Percentages of patients on HD or PD at Day 91 with co-morbidities at the start of RRT during the period 2005–14 (no. of HD = 21 756 and no. of PD = 7313), standardized for the age and sex distribution of the incident RRT population, presented as the APC and 95% CI. DM (PRD and/or co-morbidity). MAL, malignancy.
The percentage of patients with IHD at the start of RRT decreased over time (APC −1.7; 95% CI −2.5 to − 0.8), which was due to a decrease among females. The percentage of patients with PVD declined during the study period (APC −1.7; 95% CI −3.1 to − 0.4), as a result of a decrease among males and in the subgroup of patients aged 20–64 years. Overall, the percentage of patients with CVD at the initiation of RRT remained stable over time, even though a reduction in CVD was observed in males.
The percentage of patients with malignancy as co-morbidity at the onset of RRT increased between 2005 and 2014 (APC 2.0; 95% CI 1.0–2.5). This was due to an increase among patients older than 65 years of age.
For the group as a whole, the percentage of patients without co-morbidities at the start of RRT was stable during the study period, despite a small increase in patients aged 20–64 years (APC 0.6; 95% CI 0.1–1.1). In addition, the percentage of patients with one, two, or three or more co-morbidities at the onset of RRT remained stable (data not shown).
The 5-year and 10-year trends in the prevalence of co-morbidities showed similar results (Supplementary data, Table S1).
DISCUSSION
In this study of patients who started RRT in the period between 2005 and 2014 in Europe, we found a high overall prevalence of co-morbidities: in 2014, 70% of the patients had at least one co-morbidity at the onset of RRT. DM (PRD and/or co-morbidity) was the most prevalent co-morbidity overall, in all countries, in both men and women and in all age groups. Co-morbidities were more common in men than in women, in older patients when compared with younger patients, and in patients on HD when compared with patients on PD at Day 91 after the initiation of RRT. Furthermore, we observed increasing trends in the prevalence of DM (co-morbidity only) and malignancy, while the prevalence of cardiovascular diseases, including IHD, PVD and CVD, decreased in several subgroups.
The prevalence of co-morbidities in patients starting RRT has been provided previously in an international setting within Europe [7] reporting data on patients commencing RRT in Austria, Spain (Catalonia), Lombardy (Italy), Norway and the UK (England/Wales) between 1995 and 2000. In the previous study the prevalence was lower for DM (PRD and/or co-morbidity), 28% versus 40% in the current study, for DM (co-morbidity only), 8% versus 16%, and for malignancy, 11% versus 16%, whereas the prevalence was similar for IHD, 23% versus 25% and CVD, 14% versus 16%, and higher in case of PVD, 24% versus 18% [12]. The results for the period 1995–2000 suggest that the rise in the prevalence of DM and malignancy and the decrease in the prevalence of PVD demonstrated in the current study may already have started in the 1990s.
A more recent study [12] performed in France showed a similar prevalence of DM (43%), IHD (27%) and PVD (20%), a lower prevalence of CVD (11%) and malignancy (11%), and a higher prevalence of CHF (27%) for the year 2014 than the current study. In addition, this French study confirmed the increasing trend in the prevalence of DM and malignancy, the reduction in PVD, and the stable rates for CVD and CHF. Although our data showed a decreasing prevalence of IHD, in France the prevalence remained stable during the study period.
The most recent report from the ERA-EDTA Registry [10] showed that after adjustment for age and PRD, women starting RRT had a better 5-year survival than men. Our findings show that this may partly be explained by lower co-morbidity burden among women when initiating RRT. Moreover, our study shows that patients with one or more co-morbidities were less likely to commence RRT with PD or kidney transplantation, which is in line with earlier reports [5–7].
It is remarkable that the increase of the prevalence of DM (PRD and/or co-morbidity) over the 10-year study period was solely due to an increasing prevalence of patients with DM as co-morbidity, as the prevalence of DM as PRD remained stable over time. This stable prevalence of DM as PRD is in agreement with previous studies showing that both in Europe [9] and in the USA [13] the incidence of RRT for ESRD due to DM has stabilized, and even started to decrease, despite a rising prevalence of DM in the general population [14]. We cannot readily explain the increasing prevalence of patients with DM as co-morbidity. However, improved overall management of diabetes [15, 16], with an increased use of antihypertensive agents, better control of dyslipidaemia with statins and better glycaemic control with glucose-lowering medications may have resulted in fewer DM patients developing ESRD caused by their DM and thus developing ESRD due to another PRD with DM as a co-morbidity. Alternatively, it could be due to the difficult assignment of the PRD in DM patients (i.e. no biopsy to confirm DM as PRD).
The decreasing prevalence of IHD and PVD among most of the subgroups and for CVD among males are consistent with the decreasing prevalence of cardiovascular disease in the general population in most European countries [17]. This may be explained by advances in the prevention, diagnosis and treatment of the most common cardiovascular conditions [18]. An example of successful prevention is the prevalence of tobacco smoking, which has decreased in most Western European countries according to reports from the WHO [19]. Moreover, better management of diabetes [15, 16] may have improved the cardiovascular prognosis of patients with diabetes. In addition, the more intensive management of cardiovascular risk factors (both in diabetics and non-diabetics) [20] may have reduced the prevalence of cardiovascular diseases. The drop in cardiovascular conditions is also in line with changes in the mortality of RRT patients in recent years. A recent Japanese study [21] showed that although cardiovascular diseases such as heart failure, cerebrovascular disorders, myocardial infarction, hyperkalaemia/sudden death and pulmonary thromboembolism are still the most frequent causes of death in the RRT population in Japan, their occurrence has been falling over the last two decades.
The rise in the prevalence of malignancy is also consistent with the increasing incidence of malignancy in the general population [22]. Furthermore, this increase among patients starting RRT may also be associated with changes in the acceptance criteria for initiating RRT. A previous study showed that patients with malignancy as co-morbidity are less likely to receive PD than patients without this condition [5]. Our results, however, do show a rise in the prevalence of malignancy among PD patients.
This study has important strengths. First, we were able to use data on co-morbidities from a large number of patients from 11 different European countries and regions. The data was derived from large renal registries with a high degree of quality control. Second, as we used data sets that were collected annually we were able to analyse trends over time for the prevalence of each co-morbidity. To the best of our knowledge, this study is the first to report these trends in an international setting.
Our study, however, also has some limitations. The study focuses on the co-morbidities that were collected by most of the renal registries providing data to the ERA-EDTA Registry. However, it should be noted that other co-morbidities might be relevant as well, such as arrhythmias [23], liver disease [24] and cognitive impairment [25]. In addition, there were small differences in the applied definitions among the participating registries (Appendix 1). These differences may have resulted in higher or lower rates of co-morbidities due to the inclusion or exclusion of specific diseases. Moreover, the way the data were collected might be different between and within countries. For most of the registries, it was possible to distinguish between ‘no co-morbidity’ or ‘missing data on co-morbidity’, with the exception of Norway (only for DM and malignancy), Spain (Aragon and Galicia) and Sweden. In these cases, all patients without co-morbidity data were considered to have no co-morbidity, which may have resulted in an underestimation of co-morbidity rates. These limitations may lead to difficulties in performing comparisons between regions or countries. Finally, 10-year trends were calculated using only data from three Scandinavian countries and the Spanish region of Catalonia. Although this may have biased the results, sensitivity analyses using 5-year data showed similar trends for these and other countries. Nevertheless, as this study is based on data from 11 European countries and regions, the results may not be generalizable to other countries or regions in Europe.
CONCLUSION
In conclusion, more than two-thirds of patients commencing RRT in Europe have at least one co-morbidity. The co-morbidity pattern changed over time. The prevalence of DM and malignancy increased over the last decade, whilst the prevalence of cardiovascular co-morbidities decreased. Further studies are needed to investigate the effects of these changes on patient outcomes.
ACKNOWLEDGEMENTS
We would like to thank the patients and the staff of the dialysis and transplant units for contributing the data via their national and regional renal registries. Furthermore, we gratefully acknowledge the following registries and persons for their contribution of the data: Austrian Dialysis and Transplant Registry (OEDTR); Dutch-speaking Belgian Society of Nephrology (NBVN) (B. De Moor and F. Schroven); French-speaking Belgian Society of Nephrology (GNFB) (J. M. des Grottes); Danish Nephrology Registry (DNS); Finnish Registry for Kidney Diseases (C. Grönhagen-Riska); Icelandic End-Stage Renal Disease Registry; Norwegian Renal Registry (T. Leivestad and A. Ésberg); Swedish Renal Registry (SRR) (K.G. Prütz, M. Stendahl, M. Evans, S. Schön, M. Segelmark, A. Pagels, G. Welinder and T Lundgren); Aragon (J.I. Sanchez Miret), Catalonia (RMRC) (E. Arcos, J. Comas and J. Tort) and Galicia (E. Bouzas-Caamaño and J. Sánchez-Ibáñez) and the other ERA-EDTA registry committee members not mentioned above for their advice in the analysis and the drafting of this article: A. Więcek, F.J. Caskey, M. Evans, J.W. Groothoff, J. Harambat, F. Jarraya, M. Nordio, I. Rychlik; and M. Pippias and V.S. Stel in the AMC Registry office for data collection and management.
FUNDING
K.J.J. reports grants from ERA-EDTA, during the conduct of the study. The ERA-EDTA Registry is funded by the European Renal Association – European Dialysis and Transplant Association (ERA-EDTA). This article was written by L.C., M.N., R.L., J.D.M., J.M.A.D., P.F., J.G.H., C.C., R.K., F.C., A.C., R.P., A.V.R., H.R., Z.A.M., K.J.J. and A.K. on behalf of the ERA-EDTA Registry, which is an official body of the ERA-EDTA (European Renal Association – European Dialysis and Transplant Association).
CONFLICT OF INTEREST STATEMENT
L.C. reports an ERA-EDTA/SLANH Fellowship during the conduct of the study. All other authors declare no conflicts of interest. The results presented in this article have not been published previously in whole or part, except in abstract format.
REFERENCES
Appendix 1. Overview of the co-morbidities and their definitions
| Co-morbidity | Definition | |
|---|---|---|
| DM | Standard definition | Metabolic disorder characterized by chronic hyperglycaemia |
| IHD | Standard definition | Clinical diagnosis of angina or myocardial infarction; OR evidence of coronary artery disease on imaging or electrocardiography; OR a history of coronary artery bypass grafting |
| CHF | Standard definition | Prior diagnosis of CHF; OR a history of pulmonary oedema; OR a history of hospitalization for CHF within the past 12 months |
| Austria | Congestive heart-failure with ejection fraction <30% | |
| Denmark | A history of CHF or pulmonary oedema | |
| Finland | Chronic clinical heart failure | |
| PVD | Standard definition | Clinical history of claudication; OR evidence of PVD on imaging; OR amputation/bypass graft for ischaemic disease |
| Austria | Any PVD including aortic aneurysm, diffuse vessel sclerosis, documented stenosis of vessels | |
| Denmark | A history of claudication or PVD | |
| Finland | Symptomatic PVD, vascular surgery because of PVD or amputation | |
| CVD | Standard definition | Any history of a cerebrovascular event, a transient ischemic attack; OR a cerebrovascular accident; OR carotid surgery |
| Belgium, Dutch-speaking | Standard definition including severe carotid stenosis | |
| Malignancy | Standard definition | Any history of malignancy except non-melanoma skin cancer |
| Austria, Denmark, Spain (Catalonia) and Sweden | Any history of malignancy |


Comments