


ABSTRACT
An easy-to-use prediction model for long-term renal patient survival based on only four predictors [age, primary renal disease, sex and therapy at 90 days after the start of renal replacement therapy (RRT)] has been developed in The Netherlands. To assess the usability of this model for use in Europe, we externally validated the model in 10 European countries.
Data from the European Renal Association–European Dialysis and Transplant Association (ERA-EDTA) Registry were used. Ten countries that reported individual patient data to the registry on patients starting RRT in the period 1995–2005 were included. Patients <16 years of age and/or with missing predictor variable data were excluded. The external validation of the prediction model was evaluated for the 10- (primary endpoint), 5- and 3-year survival predictions by assessing the calibration and discrimination outcomes.
We used a data set of 136 304 patients from 10 countries. The calibration in the large and calibration plots for 10 deciles of predicted survival probabilities showed average differences of 1.5, 3.2 and 3.4% in observed versus predicted 10-, 5- and 3-year survival, with some small variation on the country level. The concordance index, indicating the discriminatory power of the model, was 0.71 in the complete ERA-EDTA Registry cohort and varied according to country level between 0.70 and 0.75.
A prediction model for long-term renal patient survival developed in a single country, based on only four easily available variables, has a comparably adequate performance in a wide range of other European countries.
INTRODUCTION
End-stage renal disease (ESRD) is a major health problem with high-mortality rates, affecting ∼1000 patients per million population (pmp) in European countries [1]. The overall yearly unadjusted incidence of new ESRD patients starting renal replacement therapy (RRT) is >100 patients pmp.
For nephrologists, it would be helpful to be able to predict long-term survival chances for all patients starting with RRT to support initial patient counselling. As it is unclear at therapy initiation whether a patient will stay on dialysis or subsequently receive a kidney transplant, it is desirable to use a model for overall survival prediction after the start of RRT, irrespective of treatment. Most existing prediction models are focused on dialysis survival until transplantation [2], survival on the kidney transplant waiting list [3, 4] or patient survival after renal transplantation [5, 6] or are designed for a specific patient group [7] and therefore cannot be used for overall RRT survival prediction. In 2013, a straightforward model to predict renal patient survival from the start of RRT was developed, based on a cohort of incident RRT patients from 1995 to 2005 in The Netherlands [8]. It predicts 10-year survival based on four commonly available predictors: age at the start of RRT, sex, primary renal disease (PRD) and mode of RRT at 90 days [haemodialysis (HD), peritoneal dialysis (PD) or transplantation]. Unlike the existing models, this model predicts overall survival from the start of RRT, irrespective of whether patients will change treatment modality in a later stage or not.
A general survival prediction model is desirable for patients to understand the survival implications of ESRD and it can be used for shared patient–physician discussion of future treatment perspectives, like the consideration of conservative care as an alternative to starting dialysis. Furthermore, a survival prediction model could be useful in research for patient selection, group comparisons or patient stratification according to survival risk in clinical trials. Although for survival predictions of individual patients it is preferable to take additional clinical parameters into account if available, as concluded in a later study [9], we think that the original straightforward registry model might be very valuable for group comparisons in studies, across countries or in periods of time and for risk stratification or selection purposes in (aetiologic) studies. Therefore this study has been performed.
In order to understand whether this prediction model developed in a patient group from one country is also suitable for use in other countries, it is essential to explore its generalizability in an external validation study [10]. The predictive performance of the model in The Netherlands appeared to be adequate, as demonstrated by internal validation outcomes {good calibration results as well as discrimination [concordance (C)-index 0.720]} [8]. However, internal validation merely relates to the ‘reproducibility’ of results, while the usability of the prediction model in another country is a question of ‘transportability’ of the model [11]. As countries differ in dialysis and transplantation possibilities [e.g. access to (home) dialysis and possibility for renal transplantation (with a living or deceased donor)] as well as in patient population characteristics, this could influence survival prediction. In this external validation study, we therefore assessed the performance of the model as a European renal patient survival prediction model, using data from the European Renal Association–European Dialysis and Transplant Association (ERA-EDTA) Registry.
MATERIALS AND METHODS
We used ERA-EDTA Registry data from 10 European countries with national or regional registries providing individual-level patient data on patients who started RRT between 1995 and 2005. Like in the original model, 90 days after the start of RRT was used as baseline, to exclude acute patients and to ensure enough time to switch to the intended therapy modality. We included last available follow-up information in the ERA-EDTA Registry until 1 January 2014. We excluded the country where the model was developed (The Netherlands) and countries with <1000 incident patients in our period of interest. The remaining countries that were included in the validation study are Austria, Belgium (data from the Dutch-speaking and French-speaking Belgian Registry), Denmark, Spain (data from the regional registries of Andalusia, Aragon, Asturias, Basque country, Catalonia, Cantabria, Castile and León, Castile-La Mancha, Extremadura, Valencia), Finland, France, Greece, Norway, Sweden and the UK (data from the UK Renal Registry and the Scottish Renal Registry). Most countries had 100% completeness in the whole study period, with the exception of Spain (coverage increasing from 53% in 1995 to 68% in 2005), France (coverage increasing from 17% in 2002 to 55% in 2005) and the UK (coverage increasing from 9% in 1995 to 89% in 2005). We included patients who were at least 16 years old at the start of RRT. We excluded patients who stopped RRT within 3 months after the start of RRT, including patient death [N = 96 (0.07%)] and patients with missing values on one or more of the remaining prediction variables [833 patients with missing PRD (0.6%)]. The events from 90 days after the start of RRT until death or end of the study were analysed (1 January 2014); the follow-up period was maximized at 10 years. This resulted in a data set of 136 304 patients.
The original model [8] was developed to predict 10-year patient survival from 90 days after the start of RRT. It was based on age at the start of RRT, PRD, sex and therapy at 90 days. The formula for the survival probability at time t, S(t), is S(t) = exp(−H(t)). Here, H(t) is the cumulative hazard that is calculated from the baseline hazard (H0) as H(t) = H0(t) * exp(prognostic index). The prognostic index can be calculated using the values of the four predictors for a specific patient (Table 1) together with their parameter estimates. The primary endpoint of interest was 10-year survival; additionally, we evaluated the performance of the model for 5- and 3-year survival.
Validated RRT survival prediction model as published in BMC Nephrology [8]
| Patient characteristics | Parameter estimatea |
|---|---|
| Age (per year) | 0.054 |
| Primary renal disease | |
| Glomerulonephritis | Reference |
| Cystic kidney disease | −0.280 |
| Renal vascular disease | 0.331 |
| Diabetes | 0.767 |
| Other diseases | 0.407 |
| Unknown | 0.296 |
| Therapy at 90 days | |
| HD | Reference |
| Peritoneal dialysis | −0.131 |
| Kidney transplantation | −1.634 |
| Male sex | 0.067 |
| Baseline hazards (year) | |
| 1 | 0.003 |
| 3 | 0.010 |
| 5 | 0.017 |
| 7 | 0.024 |
| 10 | 0.033 |
Prognostic index of a patient: the sum of (the product of) parameter estimates.
The survival probability at a certain time point, S(t), can be calculated from the prognostic index and the baseline hazard using the following equation: S(t)=exp(−H0(t) * exp(prognostic index)). For example, a male 55-year-old patient with diabetes who started on HD has a prognostic index of ((55 years * 0.054 = 2.97)+0.767 (PRD diabetes)+ 0.067 (male)) = 3.804. The 10-year survival prognosis is exp(−0.033 * (exp(3.804))) = 23%.
We analysed the performance of the model both in the total ERA-EDTA Registry cohort and in the separate countries (anonymously). In order to be transparent and enhance the usability of the model, we followed the recently published Transparent Reporting of a multivariable prediction model for Individual Prognosis or Diagnosis checklist [12, 13]. In Table 1, we provide the renal patient survival prediction model that was published in BMC Nephrology [8]. The performance of the prediction model was evaluated by assessing both calibration and discrimination. Calibration is the agreement between the probability of developing the outcome of interest within a certain time period (in our case 10-, 5- and 3-year survival) as estimated by the model and the observed outcome frequencies [14]. Measures to represent calibration in our study are the calibration in the large calibration plots and calibration slopes. ‘Calibration in the large’ is the overall calibration measured as the observed versus predicted survival for the complete patient cohort. The calibration plot is a graphical method to express calibration by plotting the observed outcome frequencies against the mean predicted outcome probabilities within subgroups of participants that are ranked by increasing estimated survival probability [14]. Ideally, the plots follow a 45° line, with an intercept of 0 and a slope of 1 [15]. This is also reflected in the calibration slope, which represents the outcome of a Cox regression analysis with the prognostic (risk) index as the only predictor [15] and is thus ideally equal to 1. Discrimination is the ability of a model to distinguish individuals who experience the outcome from those who remain event free [14]. The C-index is the most widely used measure to evaluate discrimination. For a Cox model, it represents the chance that, given two individuals, the model assigns a higher risk score to the one that develops the event of interest in the shortest period of time. A C-index of 0.5 indicates no discriminative power and a C-index of 1 indicates perfect discriminative power [16]. A C-index of 0.7 is considered reasonable and a C-index of 0.8 is considered good.
Because age is a strong predictor for survival, we performed an additional sensitivity analysis, stratifying calibration and discrimination analyses by age. For comparison of model performance we also stratified by sex. Further, as some countries only had good data completeness in more recent years, we stratified the calibration and discrimination analysis by the starting year of RRT.
RESULTS
The distribution of the prediction model variables (age at the start of RRT, sex, PRD and the therapy at 90 days) over the 10 European countries that are used in our external validation study is shown in Table 2. Most variation between countries as well as between the validation and development cohort is seen in the distribution of PRD and therapy at 90 days.
Distribution of prediction variables in the ERA-EDTA Registry validation cohort; countries (random order) and total external validation cohort compared with the development cohort [8]
| Country | A | B | C | D | E | F | G | H | I | J | Total validation cohort | Development cohort [8] |
|---|---|---|---|---|---|---|---|---|---|---|---|---|
| Age group (years), % | ||||||||||||
| 16–45 | 14.5 | 10.9 | 17.2 | 15.2 | 19.2 | 11.3 | 12.5 | 19.3 | 14.5 | 19.3 | 15.1 | 17.6 |
| 45–65 | 39 | 30.1 | 38 | 33.2 | 41.3 | 28 | 31.1 | 33.8 | 33.3 | 34.3 | 33.4 | 36.9 |
| 65–75 | 27.9 | 30.5 | 27.1 | 31.1 | 26.7 | 28 | 34.6 | 25 | 26.6 | 26.9 | 29.3 | 28.4 |
| ≥75 | 18.6 | 28.5 | 17.6 | 20.5 | 12.8 | 32.8 | 21.8 | 21.9 | 25.5 | 19.6 | 22.2 | 17.2 |
| PRD, % | ||||||||||||
| Glomerulonephritis | 14.4 | 11.9 | 12.3 | 14.6 | 14.5 | 14.1 | 15.1 | 21.5 | 16.2 | 13.7 | 14.4 | 12.5 |
| Cystic kidney disease | 4.5 | 5.4 | 6.5 | 7.3 | 9.3 | 7.1 | 5.1 | 8.9 | 6.3 | 7.2 | 6.6 | 8.8 |
| Renal vascular disease | 16.2 | 22.7 | 13.1 | 17.4 | 5.8 | 24.5 | 12.2 | 25.2 | 10.9 | 11.7 | 15.8 | 25.2 |
| Diabetes | 32.1 | 22.8 | 23.2 | 19.1 | 34.4 | 21.9 | 25.4 | 13.5 | 24.6 | 19.8 | 22.6 | 16.6 |
| Other diseases | 21.7 | 28.8 | 24.8 | 20.4 | 24.8 | 22.5 | 14.9 | 27 | 31.1 | 25.8 | 23.4 | 21.8 |
| Unknown | 11.1 | 8.4 | 20.1 | 21.1 | 11.2 | 10 | 27.2 | 3.9 | 10.9 | 21.8 | 17.2 | 14.9 |
| Therapy at 90 days, % | ||||||||||||
| HD | 88.7 | 86.9 | 64.5 | 86.7 | 70.5 | 81.7 | 88 | 68.6 | 64.1 | 65.3 | 78.5 | 65.5 |
| Peritoneal dialysis | 9 | 11.6 | 31.6 | 11.9 | 28.3 | 15.7 | 11.4 | 17.9 | 31.8 | 31.8 | 19.1 | 31.7 |
| Transplantation | 2.3 | 1.5 | 3.9 | 1.5 | 1.2 | 2.6 | 0.6 | 13.5 | 4.1 | 3 | 2.5 | 2.8 |
| Sex (male), % | 60.5 | 58.1 | 63.1 | 61.3 | 62.5 | 60.9 | 61.5 | 67 | 64.3 | 61.1 | 61.4 | 61.1 |
The calibration in the large for the prediction model in the ERA-EDTA Registry cohort shows adequate results, with a difference of 1.5, 3.2 and 3.4% in observed versus predicted 10-, 5- and 3-year overall RRT survival, respectively. The calibration plots for 10 deciles of predicted survival for 10-, 5- and 3-year survival are shown in Figure 1.
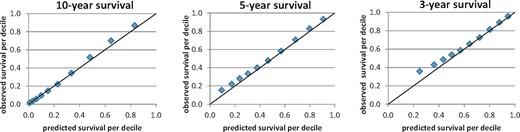
Calibration plots for 10-, 5- and 3-year survival per decile of predicted survival for the complete ERA-EDTA Registry cohort.
The calibration results of the prediction model at the country level show varying results; in five countries (Countries 1–5), the observed and predicted survival probabilities are similar, with an overall difference of ≤1% (Figure 2), so the performance of the original model is good. In the other five countries, the predicted survival probabilities are either slightly higher (Country 8) or slightly lower (Countries 6, 7, 9 and 10). The average absolute difference between observed and predicted survival over the countries is 3% (0–8%) for 10-year survival and 4% (0–9%) for 5- and 3-year survival.
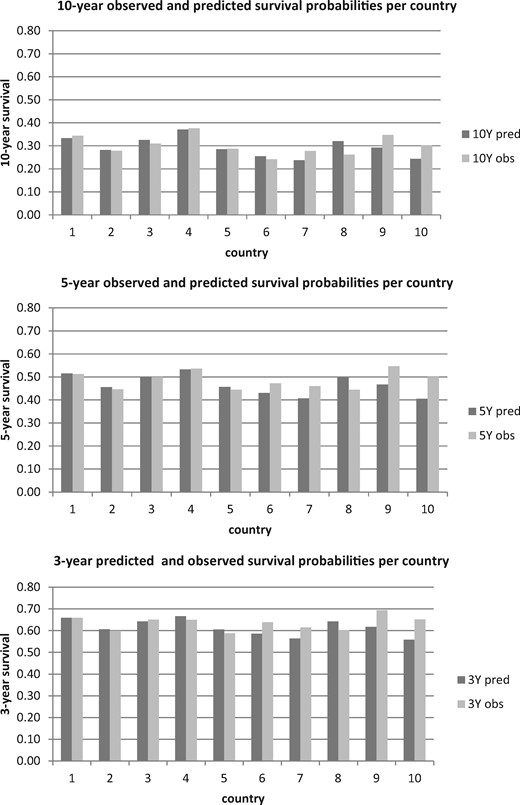
Calibration in the large for 10-, 5- and 3-year survival per country, sorted (different from Table 2) by overall performance (high–low; overall performance is the average performance over the three periods of time).
The calibration slope, with the prognostic index as the only predictor, is 0.995 for the complete ERA-EDTA Registry cohort. For the separate countries, the slopes differ from 0.922 to 1.088, which is close to the ideal 1.
The discrimination for 10-year survival, expressed as the C-index, shows adequate performance of the model, with values between 0.70 and 0.75 (Figure 3) for the 10 different countries and 0.710 (95% confidence interval 0.708–0.712) for the complete ERA-EDTA Registry cohort.
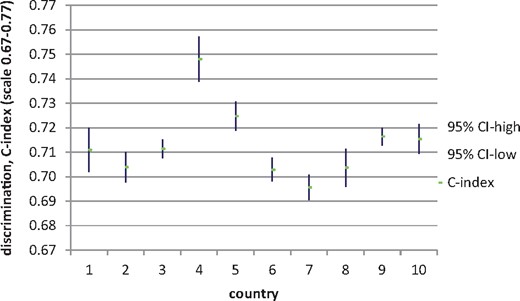
Discrimination (C-index) outcomes for 10-year survival per country (sorted like Figure 2).
Stratified calibration and discrimination results (Table 3) show that within the different age groups discrimination was moderate. Discrimination was best in the patients <65 years of age, and 10-year calibration was best for the oldest age categories. Model performance in the different sexes is similar. Further, this stratified sensitivity analysis shows that model performance slightly deteriorated over time.
Stratified calibration and discrimination results
| Calibration | Discrimination | ||||||||||||
|---|---|---|---|---|---|---|---|---|---|---|---|---|---|
| N | Pred. 3-y survival | Obs. 3-y survival | Diff. 3-y survival (%) | Pred. 5-y survival | Obs. 5-y survival | Diff. 5-y survival (%) | Pred. 10-y survival | Obs. 10-y survival | Diff. 10-y survival (%) | C-index | CI low | CI high | |
| Age group (years) | |||||||||||||
| 16–45 | 20 659 | 0.913 | 0.909 | 0.35 | 0.856 | 0.865 | −0.98 | 0.744 | 0.778 | −3.34 | 0.701 | 0.694 | 0.708 |
| 45–65 | 45 507 | 0.736 | 0.752 | −1.59 | 0.597 | 0.625 | −2.82 | 0.389 | 0.422 | −3.27 | 0.660 | 0.657 | 0.663 |
| 65–75 | 39 901 | 0.514 | 0.560 | −4.61 | 0.325 | 0.366 | −4.07 | 0.126 | 0.122 | 0.44 | 0.572 | 0.569 | 0.575 |
| 75–100 | 30 235 | 0.342 | 0.413 | −7.13 | 0.166 | 0.207 | −4.08 | 0.038 | 0.031 | 0.63 | 0.551 | 0.547 | 0.554 |
| Sex | |||||||||||||
| F | 52 674 | 0.611 | 0.645 | −3.39 | 0.462 | 0.496 | −3.35 | 0.290 | 0.306 | −1.63 | 0.710 | 0.707 | 0.713 |
| M | 83 630 | 0.610 | 0.644 | −3.46 | 0.460 | 0.491 | −3.13 | 0.287 | 0.301 | −1.37 | 0.710 | 0.708 | 0.712 |
| Year starting RRT | |||||||||||||
| 1995 | 7200 | 0.656 | 0.646 | 0.96 | 0.512 | 0.500 | 1.23 | 0.334 | 0.311 | 2.30 | 0.727 | 0.720 | 0.734 |
| 1996 | 7515 | 0.644 | 0.644 | −0.04 | 0.498 | 0.499 | −0.13 | 0.320 | 0.301 | 1.85 | 0.714 | 0.707 | 0.721 |
| 1997 | 8541 | 0.646 | 0.648 | −0.17 | 0.501 | 0.493 | 0.79 | 0.323 | 0.312 | 1.03 | 0.714 | 0.708 | 0.721 |
| 1998 | 9994 | 0.635 | 0.651 | −1.64 | 0.487 | 0.494 | −0.65 | 0.310 | 0.300 | 0.97 | 0.716 | 0.710 | 0.722 |
| 1999 | 10 565 | 0.629 | 0.646 | −1.71 | 0.481 | 0.493 | −1.23 | 0.304 | 0.307 | −0.25 | 0.712 | 0.705 | 0.718 |
| 2000 | 11 372 | 0.620 | 0.635 | −1.54 | 0.471 | 0.486 | −1.57 | 0.295 | 0.297 | −0.22 | 0.712 | 0.706 | 0.718 |
| 2001 | 12 283 | 0.609 | 0.641 | −3.25 | 0.459 | 0.485 | −2.56 | 0.286 | 0.293 | −0.71 | 0.710 | 0.704 | 0.715 |
| 2002 | 14 394 | 0.602 | 0.634 | −3.17 | 0.452 | 0.489 | −3.71 | 0.279 | 0.307 | −2.78 | 0.715 | 0.709 | 0.720 |
| 2003 | 15 814 | 0.594 | 0.643 | −4.90 | 0.443 | 0.490 | −4.74 | 0.272 | 0.301 | −2.90 | 0.709 | 0.704 | 0.714 |
| 2004 | 18 464 | 0.587 | 0.646 | −5.96 | 0.436 | 0.492 | −5.58 | 0.267 | 0.295 | −2.73 | 0.707 | 0.702 | 0.712 |
| 2005 | 20 162 | 0.580 | 0.653 | −7.34 | 0.428 | 0.504 | −7.57 | 0.261 | 0.331 | −6.99 | 0.705 | 0.701 | 0.710 |
Pred., predicted, Obs., observed, Diff., difference; y, year; CI low, confidence interval low limit; CI high, confidence interval high limit.
DISCUSSION
With this study we examined the external validity of a previously published renal patient survival prediction model based on four commonly available variables. The model performance in 10 European countries reporting to the ERA-EDTA Registry is adequate, with an overall C-index of 0.71 and an average 10-year calibration difference of 1.5%. The model performance for the long-term survival prediction is slightly better than the short-term survival prediction, as could be expected since the model was developed for 10-year survival. Although age is the strongest predictor, the model still performs well within the youngest age strata (<65 years). This indicates that the other three predictors add discriminating value. The fact that these external validation outcomes are similar to the internal validation results in the country where the model was developed indicates the robustness of the model.
These external validation outcomes are remarkable, taking into account the many differences between European countries in ESRD patient characteristics and treatment [1, 17–21] as well as mortality rates on dialysis [22]. If the model is influenced by differences in the standard of care between countries, such as differences in the percentage of living donor transplants, quality of donated kidneys or patients starting RRT at earlier stages of disease, this would be directly reflected by a significant difference in outcome. On the other hand, if differences are a consequence of population differences that are either directly or indirectly covered by the model, it will not impact model performance.
The model corrects for differences in patient age, sex, PRD and therapy at 90 days after the start of RRT, as these are part of the prediction model. Indirectly, the model probably also partly corrects for differences in patient condition, as some of the model variables (like PRD, therapy and age) are related to patient condition (e.g. hypertension, body mass index and cardiovascular disease). As well as clinical variation, there are other differences that might affect ESRD patient care and survival, including human and environmental factors (dietary habits [23], smoking, physical activity [24], socio-economic status [25] and birthweight [26], health care policies [27] and genetic differences [28]) and access to the waiting list and renal transplantation. Stel et al. [29] concluded from a study in four European countries that variation in transplantation rates may be due to a combination of factors, including legislation, donor availability, transplantation system organization and infrastructure, wealth and investment in health care, as well as underlying public attitudes/awareness to donation and transplantation. The fact that reimbursement strategies play a role has been confirmed by a study among five European countries, the USA and Canada [30]. Finally, Kramer et al. [22] showed that macroeconomic factors as well as the intrinsic mortality of the dialysis population are associated with differences in mortality on dialysis between countries. Nevertheless, despite the fact that there probably are factors that influence renal patient care and mortality on RRT, which are not covered by the model, we have shown that the renal patient survival prediction model is applicable in a wide range of countries. The many differences of the ERA-EDTA Registry cohort compared with the Dutch model development cohort actually make it a very suitable data set for external validation, which in itself is a major strength of this study.
Our validation study shows a comparably sufficient but moderate discriminative power (C-index 0.71) of the prediction model in other European countries as was also the case in the Dutch cohort [8]. This indicates that there is room for improvement. In 2013, based on data from the Netherlands Cooperative Study on Adequacy of Dialysis (NECOSAD) treatment, we showed how the original survival prediction model could be improved by adding more clinical data [9]. In particular, the reclassifications at the patient level implied that individual survival probability is influenced substantially by the clinical condition of the patient, so an extended model should be used for individual survival prediction, as an objective predicted survival estimator, next to expert opinion. However, since many countries do not yet register the required additional data on a regular basis, it is not possible to externally validate an extended prediction model in a wide spectrum of European countries. This may be different in the future. Although the validated model is less suitable for use to predict individual patient survival, the validated renal patient survival model can be used by European countries to predict objective survival chances for groups of patients, to compare risk groups in different studies or for risk stratification/selection. For example, the model can be used to select patients with a predicted 10-year mortality risk >60% to participate in a study or the model can be used to demonstrate time trends in the incident patient populations in a country by differentiation on risk group (defined by specified ranges of mortality rates). As has been pointed out in the two articles describing the previous models, it is important to note that the model is not recommended as a basis for clinical treatment decisions [8, 9], as prediction models do not prove causality, and the predictor ‘treatment at 90 days’ is merely a proxy for patient condition.
The strength of this study is the validation of the renal patient survival model in 10 different European countries, with good or acceptable results in all of these countries. Since we observed some variation at country level, this study also stresses the importance of external model validation in more than just one country. External validation limited to a single country could lead to over- or underestimated model performance, when the mortality rate in this population is different from the reference population [10, 31]. Based on our aim to externally validate the original prediction model, we have evaluated this model without any adjustments. Our validation results show good discrimination and only slightly inferior calibration outcomes in some countries. Therefore, in our opinion, model adjustment was not necessary. However, when the presented prediction model is used in another population with differing mortality rates resulting in inadequate calibration results, it would be recommended to recalibrate the model by adjusting the baseline hazard using actual population data, as described by Toll et al. [32]. In fact, a purpose of future research could be to update the model based on European data to optimize performance in this population and to establish a European model, possibly even with country as a predictor on top of the four predictors currently used. This might further increase the usefulness of the RRT survival prediction model in other European countries. Depending on the proposed use of the new model, it might also be considered to develop a risk chart to estimate survival chances for different risk groups. In either case external validation of the newly developed model is needed again.
Despite the fact that the prediction model has been shown to be valuable in this external validation cohort, there are still some study weaknesses to be noted. The most important limitation of the study is that the model has only been validated in other countries, but not in another period of time. In our study this was not possible, since a more recent cohort does not have 10 years of follow-up yet. However, knowing that RRT population and treatment possibilities as well as treatment quality and survival [21] change over time, regular evaluation and possible recalibration (as suggested earlier for other populations) of the model is recommended. A second limitation of this study is that for some countries we validated our results on patients from only a limited number of years or from a limited number of regions, which might introduce selection bias and influence calibration and discrimination outcomes. Although that might introduce differences at the country level, we do not think that this changes the conclusions of the validation study. In fact, model performance might be slightly underestimated in these countries, and for the complete ERA-EDTA Registry cohort, as model performance is more likely to deteriorate in other periods of time, as pointed out in the previous limitation and confirmed by the results of the analyses stratified by time. Finally, we should mention the fact that the model uses mainly very straightforward variables, except for the PRD. There might be difficulties in adequately (and uniformly) describing the patient’s disease. However, the PRD with the most influence on survival (diabetes) is relatively easy to detect.
In conclusion, our external validation study shows that a straightforward prediction model for long-term patient survival on RRT developed in a single country, based on only four easily available variables, has a comparably adequate performance in a wide range of European countries participating in the ERA-EDTA Registry.
AUTHORS’ CONTRIBUTIONS
All authors have contributed to the results of this study. A.C.H., M.B.A.H., M.v.D. and A.K. worked on the design, analysis and interpretation of the data and the other authors worked on the design and interpretation of the data. All authors worked on drafting/revising the article and providing intellectual content and final approval of the version to be published.
ACKNOWLEDGEMENTS
The authors thank the patients and the staff of dialysis and transplant units for contributing data via their national and regional renal registries. The authors would also like to thank the following registries for the contribution of these data: Austrian Dialysis and Transplant Registry (OEDTR) (R. Kramar); Dutch-speaking Belgian Society of Nephrology (NBVN) (B. De Moor and F. Schroven); French-speaking Belgian Society of Nephrology (GNFB) (J. M. des Grottes and F. Collart); Danish Nephrology Registry (DNS); Finnish Registry for Kidney Diseases (C. Grönhagen-Riska); the Epidemiology and Information Network in Nephrology (REIN) (M. Lassalle); Greek Renal Registry (N. Afentakis); Norwegian Renal Registry (T. Leivestad); Swedish Renal Registry (SNR) (K. G. Prütz, M. Stendahl, M. Evans, S. Schön, L. Bäckman and M. Segelmark); Dutch End-Stage Renal Disease Registry (RENINE) (M. Hemmelder); UK Renal Registry (all the staff of the UK Renal Registry and of the renal units submitting data); Scottish Renal Registry (SRR) (all of the Scottish renal units) and the regional registries of Andalusia (SICATA) (P. Castro de la Nuez), Aragon (J. I. Sanchez Miret), Asturias (R. Alonso de la Torre, J. R. Quirós and RERCA Working Group), Basque country (UNIPAR) (Á. Magaz, J. Aranzabal, M. Rodrigo and I. Moina), Cantabria (M. Arias Rodríguez and O. García Ruiz), Castile and León (R. González and C. Fernández-Renedo), Castile-La Mancha (G. Gutiérrez Ávila and I. Moreno Alía), Catalonia (RMRC) (E. Arcos, J. Comas and J. Tort), Extremadura (J. M. Ramos Aceitero and M. A. García Bazaga) and Valencian region (REMRENAL) (O. Zurriaga Llorens, M. Ferrer Alamar and N. Fuster Camarena) and the other ERA-EDTA Registry committee members for their advice in the analysis and the drafting of this manuscript: A. Więcek, M. Evans, J. Harambat, F. Jarraya and I. Rychlik; and M. Pippias and V. S. Stel in the AMC Registry office for data collection and management. This article was written by A.C.H., M.B.A.H., M.v.D., A.K., J.d.M., J.G.H., J.M. A.D., M.T.G., P.F., P.B., B.E.V., F.J.C., J.P.T., Z. M., C.C., J.W.G, M.N., K.J.J., F.W.D. and A.J.H on behalf of the ERA-EDTA Registry, which is an official body of the ERA-EDTA.
CONFLICT OF INTEREST STATEMENT
None declared.
FUNDING
The ERA-EDTA Registry is funded by the ERA-EDTA.


Comments