


Abstract
Background: Depression and early death are both common in adults with Stage 5 chronic kidney disease. Studies have shown an association between depression and total mortality, but the association between depression and cardiovascular death is less certain.
Methods: We conducted a prospective multinational cohort study involving adults who were treated with long-term haemodialysis within a single dialysis network between April and November 2010. Depression was considered present when patients reported a Beck Depression Inventory (BDI) II score ≥14 at baseline. Sensitivity analyses considered a BDI II score ≥20 to identify moderate depression. Multivariable Cox proportional hazards regression was used to assess adjusted hazards for all-cause and cardiovascular mortality at 12 months.
Results: Three thousand and eighty-six participants in the network received the BDI II questionnaire, and 2278 (73%) provided complete responses to the survey questions. Among these, 1047 (46%) reported depression. During a mean follow-up of 11 (standard deviation: 2.5) months (2096 person-years), we recorded 175 deaths, of which 66 were attributable to cardiovascular causes. Depression (BDI score ≥14) was not associated with all-cause mortality [adjusted hazard ratio: 1.26 (95% confidence interval: 0.93–1.71)] or cardiovascular mortality [0.82 (0.50–1.34)]. When a higher BDI score (BDI score ≥20) was used to identify moderate depression, depression was associated with total mortality [1.40 (1.02–1.93)] but not cardiovascular mortality [1.05 (0.63–1.77)].
Conclusions: The association between depression and cardiovascular mortality in adults with kidney failure treated with haemodialysis is uncertain. Depression is a heterogeneous disorder and may only be a risk factor for premature death when at least of moderate severity.
INTRODUCTION
Chronic kidney disease (CKD) affects ∼10–15% of adults globally and increases the risk of death ∼2- to 4-fold, mostly due to excess cardiovascular mortality [1–4]. Patients with Stage 5 chronic kidney disease (CKD V), treated with dialysis, report a particularly heavy symptom burden including fatigue, anxiety and depression, sleep disturbance and itch [5]. Using interviews for diagnostic purposes, major depression affects about one-quarter of people who have CKD and the prevalence may be higher in adults who have advanced CKD [6].
While an increased risk of all-cause mortality in adults with depression and CKD has been found consistently [a systematic review of 22 studies involving 83 381 participants demonstrated a hazard ratio of 1.59, 95% confidence interval (95% CI): 1.35–1.87], there are only a few small studies that have examined the relationship between depression and cardiovascular mortality [7]. In adults with cardiovascular disease, depression predicts mortality after acute myocardial infarction even when accounting for the biological effects of myocardial ischaemia [8], suggesting that mechanistic pathways between cardiovascular events and death are potentially mediated through depression. Few trials of treatment for depression in adults with CKD are available [9, 10], despite patients with CKD citing depression as a key research priority [11]. Accordingly, improved understanding of the link between depression and cardiovascular mortality in adults treated with dialysis could enhance the design of future trials of antidepressive therapies.
The aim of this study was to examine the association between self-reported depression and early all-cause and cardiovascular mortality in adults with CKD V, treated with long-term haemodialysis.
MATERIALS AND METHODS
We have reported this study according to the Strengthening the Reporting of Observational Studies in Epidemiology (STROBE) guidelines [12].
Study population and baseline data
We included consecutive patients aged 18 years or older who had been treated with long-term haemodialysis for any duration within a convenience sample of clinics operated by a single dialysis provider in Europe (Portugal, Turkey, Italy and France). Data were collected between April and November 2010. We excluded participants who at the time of Beck Depression Inventory (BDI) II survey administration had a life expectancy of <6 months as estimated by the treating physician, had transplantation planned within 6 months or had anticipated recovery of kidney function. We obtained ethics approval for analysis of routinely collected data within the dialysis network from the University of Sydney Human Research Ethics Committee (project number 2013/031) and the study was conducted according to the requirements of the Declaration of Helsinki.
Demographic, clinical, laboratory and dialysis-related data were obtained from clinical databases linked using a unique identification code. Standardized variables included: age; gender; country of treatment; education level; marital and occupational status; alcohol intake; smoking history; physical activity; housing situation; body mass index; income; comorbidities including previous cardiovascular disease and diabetes; medication use; serum parameters including haemoglobin, phosphorus, parathyroid hormone, calcium and albumin; and dialysis characteristics. All variables were assessed and recorded using the same standard operating procedures across all clinical sites. The mean age and gender composition of our cohort was similar to prevalent patients treated with kidney replacement therapy in Europe [13].
Exposure ascertainment: depression
Depression was ascertained using the BDI II questionnaire. This is a self-reported survey composed of 21 items that are symptoms of depression, limited to the previous 2 weeks, including sadness, pessimism, failure, loss of pleasure, self-dislike and criticalness, suicidal thoughts, agitation, loss of interest, indecisiveness and worthlessness, as well as somatic symptoms including loss of energy, changes in sleep patterns and appetite, concentration, tiredness and loss of interest in sex. Each item is rated on a 4-point scale from 0 to 3 with higher scores indicating greater symptoms of depression. The maximum total score is 63.
Surveys were provided to patients by clinical staff at their dialysis centre during routine dialysis care. Patients completed the questionnaire anonymously during a dialysis session. Relevant baseline data (demographic, clinical and biochemical) were obtained from a clinical database linked to the patients via their standardized unique identification code. We used BDI II questionnaires in the patients' native language after translation and subsequent linguistic validation by the MAPI Institute (http://www.mapi-institute.com).
The primary exposure was depression using a threshold of 14 or higher on the BDI II. This threshold was used because in a previous study in adults treated with dialysis, it showed the optimal diagnostic accuracy for depression compared with a physician-administered Structured Clinical Interview [14]. Moderate depression has been also evaluated using a threshold of 20 or higher.
Outcome ascertainment: mortality
Data for total and cause-specific mortality were obtained from data linkages within a centralized clinical database in which changes to patient status were updated by managing clinicians on a monthly basis. Cardiovascular death was adjudicated by the participants' treating clinicians, who were unaware of the depressive symptom score. Cardiovascular causes included a sudden death or attributed to acute myocardial infarction, pericarditis, atherosclerotic heart disease, cardiomyopathy, cardiac arrhythmia, cardiac arrest, valve heart disease, pulmonary oedema, congestive cardiac failure, cerebrovascular accident, including intracranial haemorrhage, and ischaemic brain damage, including anoxic encephalopathy. The primary outcomes defined a priori were all-cause mortality and death due to cardiovascular causes. Participants were followed up until the occurrence of death. Patients who withdrew from the study, underwent kidney transplantation, were lost to follow-up or survived were censored.
Statistical analyses
Baseline socio-demographic, clinical and dialysis-related characteristics were summarized as mean [standard deviation (SD)] or median (25th to 75th percentile) for continuous variables and number (proportion) for categorical variables. The presence of depression was considered as a time-fixed binary variable throughout the follow-up period. Event rates for mortality outcomes were calculated for presence of depression, reporting crude risk ratios. Time to event cumulative Kaplan–Meier curves were plotted against depression scores. We then applied a Cox proportional hazards model fitted stratified by country to estimate associations between depression and early all-cause and cardiovascular mortality adjusted for age and variables that had an association with mortality at P < 0.25 including gender, smoking, employment, myocardial infarction, diabetes, mean arterial pressure and serum phosphorus for all-cause mortality, and age, employment, diabetes, myocardial infarction and serum phosphorus for cardiovascular mortality. An additional analysis adjusted also for receiving antidepressant medications was conducted. The proportional hazards assumption in all Cox models was assessed by fitting log (time)-dependent covariates in the multivariable model and checking graphically by plotting the Schoenfeld residuals, but no variables violated the proportionality assumption.
To account for any potential ascertainment error that might occur when assessing depression using a BDI score ≥14, we did sensitivity analyses using a BDI II cut-point score of 20 or higher, indicative of moderate depression in the general population. All analyses were done using SAS 9.3 (www.sas.com), and two-tailed P < 0.05 were taken to indicate statistical significance.
RESULTS
Participant characteristics
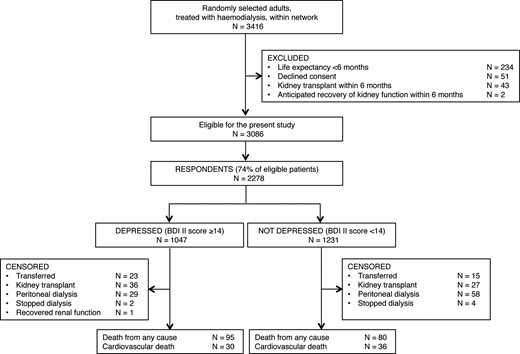
Flow chart showing identification of study participants. BDI II, Beck Depression Inventory II.
Overall, respondents had a mean age of 63.6 (SD: 14.9) years, 60.8% were men, 35.6% had received secondary school education and 74.0% were retired. They had been on haemodialysis for a median period of 49 (26–86) months (Table 1).
Demographic and clinical characteristics of haemodialysis patients according to the presence or absence of depression (BDI)
| Characteristics | BDI II score ≥14 (n = 1047) | BDI II score <14 (n = 1231) | Overall (n = 2278) | P-value for difference based on BDI II score |
|---|---|---|---|---|
| Demographics | ||||
| Age (years) | 65.3 (14.3) | 62.1 (15.2) | 63.6 (14.9) | <0.001 |
| Country | 0.009 | |||
| France | 39 (3.7) | 70 (5.7) | 109 (4.8) | |
| Italy | 232 (22.2) | 218 (17.7) | 450 (19.8) | |
| Portugal | 505 (48.2) | 635 (51.6) | 1140 (50.0) | |
| Turkey | 271 (25.9) | 308 (25.0) | 579 (25.4) | |
| Men | 555 (53.0) | 831 (67.5) | 1386 (60.8) | <0.001 |
| European | 1011 (96.6) | 1164 (94.6) | 2175 (95.5) | 0.07 |
| Socio-economic characteristics | ||||
| Living alone | 104 (11.2) | 114 (10.6) | 218 (10.9) | 0.66 |
| Employment status | 0.006 | |||
| Employed | 80 (9.0) | 163 (15.5) | 243 (12.5) | |
| Unemployed | 129 (14.4) | 134 (12.8) | 263 (13.5) | |
| Retired | 685 (76.6) | 753 (71.7) | 1438 (74.0) | |
| Secondary education | 241 (27.1) | 449 (42.8) | 690 (35.6) | <0.001 |
| Current or former smoker | 223 (25.4) | 361 (34.9) | 584 (30.5) | <0.001 |
| Wait-listed for transplant | 29 (2.8) | 58 (4.7) | 87 (3.8) | 0.02 |
| Daily physical activity | 39 (4.6) | 72 (7.2) | 111 (6.0) | 0.003 |
| Clinical characteristics at baseline | ||||
| Myocardial infarction | 116 (11.1) | 158 (12.8) | 274 (12.0) | 0.20 |
| Stroke | 85 (8.1) | 61 (5.0) | 146 (6.4) | 0.02 |
| Peripheral vascular disease | 194 (18.5) | 184 (15.0) | 378 (16.6) | 0.02 |
| Diabetes | 273 (33.6) | 259 (27.4) | 532 (30.3) | 0.005 |
| Dialysis characteristics | ||||
| Time on dialysis (months) | 48.8 (25.5–87.0) | 48.8 (26.4–86.1) | 48.8 (26.1–86.3) | 0.94 |
| Kt/V | 1.74 (0.33) | 1.69 (0.31) | 1.71 (0.32) | <0.001 |
| Mean arterial pressure | 89.5 (13.8) | 91.3 (13.9) | 90.5 (13.9) | 0.002 |
| Laboratory variables | ||||
| Serum albumin (g/L) | 38.9 (4.2) | 40.2 (4.1) | 39.6 (4.2) | <0.001 |
| Serum phosphorus (mg/dL) | 4.37 (1.28) | 4.47 (1.27) | 4.43 (1.28) | 0.06 |
| Haemoglobin (g/dL) | 11.3 (1.3) | 11.4 (1.3) | 11.3 (1.3) | <0.001 |
| Medications | ||||
| Antidepressant | 120 (11.5) | 104 (8.5) | 224 (9.8) | 0.02 |
| Antipsychotic | 19 (1.8) | 9 (0.7) | 28 (1.2) | 0.02 |
| Hypnotic | 70 (6.7) | 54 (4.4) | 124 (5.4) | 0.02 |
Data are expressed as mean (SD), number (%) or median (25th percentile, 75th percentile). Kt/V refers to the clearance of urea and is a measure of the amount of dialysis received. Proportions do not always correspond to overall numbers of participants due to missing data.
BDI II, Beck Depression Inventory II.
Depression
Overall, the median BDI II score was 13 (interquartile range, 7–21). One thousand and forty-seven respondents (46.0%) reported BDI II scores ≥14, consistent with depression in adults treated with dialysis. Two hundred and twenty-four (9.0%) survey respondents were prescribed antidepressant medication. Table 1 displays the baseline characteristics of the included respondents according to the presence of depression. Depression was associated with being older or female, experiencing lower educational attainment, receiving a pension or being unemployed, lower physical activity, not being wait-listed for a kidney transplant, pre-existing diabetes, stroke or peripheral vascular disease, lower levels of blood pressure, haemoglobin, serum albumin and phosphorus, and more frequent prescription of neuroactive drugs including antidepressant, antipsychotic and hypnotic agents.
Association of depression with all-cause and cardiovascular mortality
During 11.0 months of follow-up on average (median, 12.0 months; 2096 person-years), there were 175 deaths of which 66 were attributable to cardiovascular causes (Table 2). Overall, 195 respondents were censored from analyses: 38 were transferred to another dialysis centre, 63 underwent kidney transplantation, 87 started peritoneal dialysis, 6 stopped dialysis and 1 experienced kidney function recovery. The number stopping dialysis during the follow-up period was numerically small and similar in those who had depression compared with those who did not (two versus four, respectively) (Figure 1).
Cause of death according to the presence or absence of depression (BDI)
| Cause of death | Overall (n = 2278) | BDI II score ≥14 (n = 1047) | BDI II score <14 (n = 1231) | |||
|---|---|---|---|---|---|---|
| N | % | N | % | N | % | |
| Cardiovasculara | 66 | 2.9 | 30 | 2.9 | 36 | 2.9 |
| Vascular | 5 | 0.2 | 4 | 0.4 | 1 | 0.1 |
| Infection | 20 | 0.9 | 11 | 1.1 | 9 | 0.7 |
| Liver disease | 2 | 0.1 | 1 | 0.1 | 1 | 0.1 |
| Gastrointestinal haemorrhage | 6 | 0.3 | 3 | 0.3 | 3 | 0.2 |
| Metabolic | 1 | 0.0 | 1 | 0.1 | 0 | 0.0 |
| Otherb | 45 | 2.0 | 29 | 2.8 | 16 | 1.3 |
| Unknown | 30 | 1.3 | 16 | 1.5 | 14 | 1.1 |
| Total | 175 | 7.7 | 95 | 9.1 | 80 | 6.5 |
aSudden death or attributed to acute myocardial infarction, pericarditis, atherosclerotic heart disease, cardiomyopathy, cardiac arrhythmia, cardiac arrest, valve heart disease, pulmonary oedema, congestive cardiac failure, cerebrovascular accident, including intracranial haemorrhage, and ischaemic brain damage, including anoxic encephalopathy.
bNot cardiovascular related.
Cox proportional hazards model for all-cause and cardiovascular mortality
| All-cause mortality | Cardiovascular mortality | |
|---|---|---|
| Unadjusted analysis | ||
| BDI II score ≥14 | 1.44 (1.07–1.94) | 0.99 (0.61–1.62) |
| Bivariate analysis stratified by country | ||
| BDI II score ≥14 | 1.46 (1.08–1.97) | 0.99 (0.61–1.61) |
| Multivariate analysis (stratified by country) | ||
| BDI II score ≥14 | 1.26 (0.93–1.71) | 0.82 (0.50–1.34) |
| Age, per year increase | 1.05 (1.03–1.06) | 1.07 (1.04–1.09) |
| Female | 0.76 (0.55–1.06) | – |
| Former or current smoker (versus never) | 0.69 (0.47–1.03) | – |
| Employed (versus unemployed) | 0.57 (0.20–1.60) | 0.51 (0.07–3.91) |
| Diabetes mellitus | 1.56 (1.13–2.16) | 2.08 (1.26–3.43) |
| Myocardial infarction | 1.18 (0.79–1.77) | 1.62 (0.90–2.91) |
| Mean arterial pressure >90 mmHg | 0.59 (0.43–0.80) | – |
| Serum phosphorus >5.5 mg/dL | 0.89 (0.57–1.38) | 0.92 (0.46–1.83) |
Multivariate analysis for all-cause mortality included adjustment for age, gender, smoking status, employment, diabetes mellitus, myocardial infarction, mean arterial pressure and serum phosphorus. Multivariate analysis for cardiovascular mortality included adjustment for age, employment status, diabetes mellitus, myocardial infarction and serum phosphorus. Bold values are referred to risk factors significantly associated with mortality.
![Unadjusted associations between depression (BDI) and all-cause (Panel 1) and cardiovascular (Panel 2) mortality. The BDI II score is dichotomized according to a score ≥14 indicating depression versus <14 indicating no depression, according to a previous study showing the highest diagnostic accuracy for this cut-point value against the Structured Clinical Interview for Depression in adults with kidney failure treated with dialysis [14]. BDI II, Beck Depression Inventory II.](https://oup.silverchair-cdn.com/oup/backfile/Content_public/Journal/ndt/32/2/10.1093_ndt_gfw016/3/m_gfw01602.jpeg?Expires=1750495255&Signature=BJ74yyUv58dArGIAXvFmwcRdwjHF6KudvEQy2sBsdHrDApPUjmLb89wdA1pS3hMGN36wzFWztbSDHJpsxDY8vvttMEdGEKd8ukPtAKIJxp~XDJ07wJwbltnqJl24MDRCCN-FjcYji-GPhODO6hHiHI5wPeQftt4jjW53x4Y-5wudRIltMHGKR0MeoBTY2IUDWAx65wf1YueIBkVUxmi7-9YKF2UeBwdFDWj2RAsueZYLtufWoeghnBjC1k61X1O5vVwzBSkCvm~gFaSK-y2qRf8c5HxxG1h7c8au5w2amSa9JjHKSwtBM0lCG5uh3eMDyokBi3pX~fHuKrhzIf5IKA__&Key-Pair-Id=APKAIE5G5CRDK6RD3PGA)
Unadjusted associations between depression (BDI) and all-cause (Panel 1) and cardiovascular (Panel 2) mortality. The BDI II score is dichotomized according to a score ≥14 indicating depression versus <14 indicating no depression, according to a previous study showing the highest diagnostic accuracy for this cut-point value against the Structured Clinical Interview for Depression in adults with kidney failure treated with dialysis [14]. BDI II, Beck Depression Inventory II.
Sensitivity analysis
When a higher cut-point for the BDI II score was used as the exposure (BDI ≥20), 656 of 2278 (28.8%) met the criteria for moderate depression. In survival analyses using this cut-point, associations between depression and mortality were stronger and statistically significant for all-cause mortality. For the higher BDI II cut-point, the adjusted hazard ratio for all-cause mortality was 1.40 (95% CI: 1.02–1.93) and the adjusted hazard ratio for cardiovascular mortality was 1.05 (95% CI: 0.63–1.77).
DISCUSSION
Nearly half of this cohort of adults with kidney failure treated with dialysis reported a symptom score consistent with depression using a previously validated BDI II score ≥14. Factors associated with depression included age, country, employment, education, cardiovascular disease, blood pressure and treatment with psychoactive medication. There was no evidence of increased all-cause or cardiovascular mortality in adults with a higher depression score. When a higher BDI II cut-point score used in the general population to indicate moderate depression was used, ∼30% of survey respondents met criteria for moderate depression with evidence of a 40% increased risk of all-cause mortality, but there was no evidence of association with cardiovascular mortality.
Our study examines the association between depression and cardiovascular mortality in adults with kidney failure exceeding the cumulative number of patients involved in existing studies [7]. Three existing studies involving 1080 participants have investigated linkages between depression and cardiovascular mortality and report similar findings to this study, indicating a non-significant increase in cardiovascular death for depressed adults with kidney disease [15–17]. Notably, in one study in which depression (score ≤52 on the five-item Mental Health Index) was measured at 6-monthly intervals in 917 incident dialysis patients for 2 years, persistent or current depression was associated with cardiovascular mortality [adjusted hazard ratio 3.27 (95% CI: 1.57–6.81)], whereas depression detected over 6 months previously or at baseline only was not associated with cardiovascular mortality, indicating that active depression may be associated with death but, as in this current study, previous or resolved depression may no longer have ongoing prognostic implications [15].
The reasons for a weaker association between depression and fatal cardiovascular events in this and previous studies are not clear. In an existing study using the Hospital Anxiety and Depression Score to define depression, depressed mood was associated with increased risk of death due to sepsis but not cardiovascular disease, suggesting that non-cardiovascular causes of mortality may contribute to lower survival associated with depression [17]. Depression is associated with increased inflammation, lower serum albumin and impaired nutrition [18, 19], all of which can be linked to cardiovascular injury and morbidity in CKD, but whether depression is a cause or effect of these clinical phenomena cannot be deduced from existing observational data. In addition, depression is associated with lower treatment adherence [20] and withdrawal from dialysis care [21], which may account for increased non-cardiovascular morbidity; however, the current study reported only a small number of such events and could not discern differences in patient decisions about continuing dialysis based on the presence of depression.
Patients on or nearing dialysis identify causes and treatment of depression as a high priority [11], but trials evaluating pharmacological and psychosocial interventions for depression in dialysis patients are sparse [9, 10], suggesting that this is an area requiring research prioritization. Based on the current study and previous analyses, all-cause but not cardiovascular mortality may be an appropriate end point for trials of antidepressant medication, and patient-prioritized outcomes informed by priority-setting exercises involving patients, caregivers and health providers may guide researchers in designing optimal future studies. In an ongoing trial randomizing adults with CKD and major depression to sertraline sertraline (a selective serotonin reuptake inhibitor), planned end points include changes in cognitive function, medication adherence, nutrition, inflammation and platelet function that will potentially explore the mechanisms by which depression mediates patient-relevant outcomes such as quality of life and morbidity in the setting of CKD [22].
The strengths of this study include the large sample size and the multinational population. However, our study should be interpreted in the context of the limitations of this type of study design. First, as is shown by our sensitivity analyses, ascertainment errors are possible, particularly the use of self-completed questionnaires to determine presence of depression. While we used a cut-point score for depression based on a previous study specifically in a dialysis population [14], sensitivity analyses in our study showed that any association between depression and mortality outcomes may rely on the cut-point used to define depression when using self-administered tools. Notably, in a meta-analysis of existing observational studies, the method of measuring depression (self-rating scale versus interview or physician assessment) did not appear to modify the association between depressed mood and total mortality (P = 0.3 for the difference between subgroups of studies), but information for ascertainment of depression in studies examining cardiovascular death was insufficient to draw robust conclusions [7]. Second, depression was measured at baseline and repeated measures were not available to characterize depression as persistent or present at the end of follow-up. As in a previous study, active depression may be required to have a prognostic impact in this clinical situation. Third, we included a convenience sample of patients and found a mortality rate (8%) lower than expected in a dialysis population (15–20%) [23]. Therefore, our study might be underpowered to detect the effect of depression on mortality in this setting and be at risk of a Type II statistical error (failing to find an effect that is present). This could be the reason why in our main analysis we did not find a significant association between depression and all-cause mortality, differently from previous studies [7]. Fourth, our definition of cardiovascular mortality included both cardiovascular and cerebrovascular events, since outcome information obtained from data linkages with the centralized clinical database did not allow us to distinguish between these events. Fifth, depression has been shown to potentially increase risks of infection-related death and withdrawal from dialysis. Despite the large sample size, insufficient events were available for these outcomes (20 and 6, respectively) to conduct meaningful analyses, and there was a relatively large proportion of deaths without specific causes (30 deaths with unknown cause). In addition, the total number of deaths observed during follow-up was not sufficient to inform a competing risk analysis. Sixth, the study was limited to the haemodialysis setting of prevalent patients only. Finally, approximately one-quarter of participants did not respond fully to the BDI II questionnaire and had significantly different demographic and clinical characteristics, including older age, lower educational opportunity and employment, and smaller dialysis dose. Therefore, the results of our study might be less generalizable across the full range of patient characteristics that are present in many dialysis populations.
In conclusion, depression is not robustly associated with cardiovascular mortality in adults with kidney failure treated with haemodialysis. The link between depression and cardiovascular mortality in this clinical setting remains uncertain. Depression may increase non-cardiovascular causes of death in dialysis populations, but further work is needed to understand the implications of depression on non-cardiovascular morbidity.
ACKNOWLEDGEMENTS
We thank all the participants for their involvement in the study.
CONFLICT OF INTEREST STATEMENT
None declared.
REFERENCES


Comments