


Abstract
It has been demonstrated that low birth weight gives rise to a reduction in nephron number with increased risks for hypertension and renal disease. Its impact on renal function in kidney donors, however, has not been addressed.
To investigate the impact of birth weight, kidney weight, kidney volume and estimated nephron number on kidney function, we collected data from 91 living kidney donors before nephrectomy, at +12, +36 and +60 months after nephrectomy.
Birth weight showed a positive correlation with estimated glomerular filtration rate (eGFR) at +12, +36 and +60 months after nephrectomy (P < 0.05). The strongest link was observed in donors >50 years old (R = 0.535, P < 0.001 at +12 months). Estimated nephron number and eGFR showed a strong positive correlation at +12, +36 and +60 months after nephrectomy (R = 0.540; R = 0.459; R = 0.506, P < 0.05). Daily proteinuria at +12 months showed a negative correlation with birth weight (P = 0.009). Donors with new-onset hypertension showed significantly lower birth weights and higher uric acid levels (P < 0.05). Kidney weight and volume did not show any impact on donor outcomes (P > 0.05).
Low nephron number predisposes donors to inferior remaining eGFR, hypertension and proteinuria. The strong correlation in elderly donors may be attributed to reduced renal functional reserve due to the decline of renal function with age.
INTRODUCTION
Very recent studies suggest that living kidney donors face an increased risk of end-stage renal disease, cardiovascular disease and overall mortality as a result of the reduction of nephron number by unilateral nephrectomy [1, 2]. Since a method to assess the number of functioning nephrons has not been developed to identify individuals with a reduced nephron number, low birth weight as the best surrogate marker of nephron number needs to be evaluated in the context of living kidney donation. Here, the substantial variability in nephron number across the otherwise healthy population of donors suggests an impact of renal mass on living kidney donor outcomes. Previous studies have suggested an increased risk of albuminuria in living kidney donors with low birth weight [3].
Previous studies on renal development showed that nephrogenesis markedly increases in the third trimester and reaches completion at ∼34–36 weeks of gestation, after which only loss of nephrons by aging, disease or trauma occurs [4, 5]. This results in the extremely large variability seen in the number of nephrons per kidney, which averages 600 000–800 000 per kidney but ranges widely from 200 000 to 2 000 000 nephrons per kidney [4, 5]. Infants born during active nephrogenesis before completion at 34–36 weeks of gestation will have a reduced nephron number proportional to their birth weight. A number of studies have confirmed a 20–35% reduction in the nephron number of experimental animals in whom growth retardation was induced [6, 7]. With a decrease in the renal mass the surviving nephrons undergo various structural and functional adaptations to meet the excretory demands. Structurally, glomerular hypertrophy occurs, and functionally there is an increase in the single nephron glomerular filtration rate (GFR).
Barker et al.[8–10] first proposed a strong relationship between intrauterine growth retardation and low birth weight, and the development of essential hypertension and cardiovascular disease. This link has been attributed to impaired renal development and a reduction of nephron number [11–13]. Autopsy studies showed a significant reduction in nephron number of almost 50% in subjects with essential hypertension compared with control subjects [14, 15].
In addition to the Barker hypothesis that the congenital reduction in nephron number is associated with the development of essential hypertension, an elevation in serum uric acid has been found to correlate with the risk for future hypertension [16–21]. In this context, Feig et al. [22] examined the relationship of birth weight with the degree of serum uric acid in subjects with the development of essential hypertension, and showed that the lower the birth weight, the higher the serum uric acid.
To assess the effect of nephron number on the outcomes of donors after living kidney donation we should look at donor birth weight, donor serum uric acid levels, donor kidney weight, donor kidney volume, body surface area (BSA), bodyweight and body mass index (BMI). Here, we tried to address the following open questions: (i) What is the impact of donor birth weight on the outcome of donor renal function? (ii) What is the impact of donor birth weight on the development of hypertension in the donor? (iii) What is the impact of donor birth weight on the development of proteinuria in the donor?
MATERIALS AND METHODS
Patients
This study was performed in compliance with the Declaration of Helsinki and Istanbul. Informed consent was obtained from all patients. We retrospectively examined 91 living donors who underwent donor nephrectomy at our single transplant centre at Charité Campus Virchow Clinic between April 2003 and August 2012. We excluded donors with <1 year of follow-up or missing donor birth weight. All living kidney donors included in our study were Caucasians.
We followed up 91 living donors for at least 12 months, 63 living donors for at least 36 months and 32 living donors for at least 60 months after donor nephrectomy.
Donor data studied included donor birth weight (g), donor kidney volumes (cm3), donor kidney weight (g), split kidney function evaluated by kidney scintigraphy, serum creatinine at +1, +12, +36 and +60 months (mg/dL), estimated GFR [eGFR (mL/min); estimated by the Chronic Kidney Disease Epidemiology Collaboration (CKD-EPI) formula], 24 h urinary excretion of protein at +12 months (g/24 h), body weight (kg), BSA (m2) and BMI (kg/m2). Estimation of nephron number was performed as stated below.
Donor birth weight
Donor birth weights were obtained from donor birth records. Collection of donor birth weights was successful in 43% of donors performed during the study period, leaving 91 donor–recipient pairs for analysis in this study.
Donor kidney volumes
Collection of donor kidney volumes was successful in 65 of 91 donors (67%).
Donor kidney weight
Explanted donor kidneys were weighed using the electronic weighing scales (Rhewa Type 341B, Germany) that were located in the operating room. In compliance with common procedure recommendations, kidney grafts were first prepared and then weighed by the surgeon immediately before grafting. Kidney weight of the remaining kidney was calculated from kidney volume of the remaining kidney, donor kidney volume and measured donor kidney weight. We calculated the ratio between the donor kidney weight (g) and recipient BSA (m2), and assessed the effect of this ratio on allograft function in the first 5 years after transplantation. Collection of donor kidney weights was successful in 77 of 91 donors (85%).
Calculation of nephron number
Statistical analysis
Statistical tests were performed using SPSS Version 19. For comparisons of study groups, two-sided Mann–Whitney U-test for nonparametric independent samples was used. For comparisons between paired samples, two-sided Wilcoxon signed-rank test for nonparametric dependent samples were used. Clinical characteristics were compared across groups using Fisher's exact test or χ2 test for categorical variables. Box-plots show median, interquartile range and 95th percentile. Simple linear regression analysis was used to evaluate the correlation between eGFR and the other variables at 12, 36 and 60 months after kidney transplantation. An appraisal was carried out on the time between transplantation and the occurrence of proteinuria (first measurement 0.5 g/24 h). Two-sided P-values <0.05 were considered statistically significant.
RESULTS
Clinical characteristics of donors
Altogether 91 living kidney donors were included in the statistical analysis. A total of 31 (34.1%) were male donors with a median age of 53 years (range 20–78 years). Median follow-up of donors after nephrectomy was 78 months (range 24–144 months), during which no donor died (0%) and no donor developed end-stage renal disease (0%). Analysis of clinical characteristics and outcomes of donors are shown in Tables 1 and 2. No statistical differences in demographic characteristics were observed according to the donor birth weight threshold of 2.5 kg.
Donor characteristics and comparison of donors with birth weight ≤2.5 kg versus birth weight >2.5 kg
| All donors (n = 91) | Donor birth weight ≤2.5 kg (n = 18) | Donor birth weight >2.5 kg (n = 73) | P-value | |
|---|---|---|---|---|
| Age (years)a | 53 (20–78) | 53 (20–71) | 52 (27–78) | 0.326 |
| Male, n (%) | 31 (34) | 8 (44) | 23 (32) | 0.405 |
| Donor nephrectomy of the right kidney, n (%) | 38 (42) | 9 (50) | 29 (40) | 0.439 |
| Open nephrectomy, n (%) | 33 (36) | 6 (33) | 27 (37) | 1 |
| Body weight (kg)a | 70 (45–113) | 72 (65–89) | 70 (45–113) | 0.182 |
| Donor body surface area (dBSA) (m2)a | 1.79 (1.42–2.33) | 1.83 (1.66–2.13) | 1.78 (1.42–2.33) | 0.151 |
| BMI (kg/m2)a | 25 (18–38) | 27 (23–31) | 25 (18–38) | 0.124 |
| ≤25, n (%) | 37 (41) | 5 (28) | 32 (44) | 0.287 |
| 26–30, n (%) | 48 (53) | 11 (61) | 37 (51) | 0.599 |
| >30, n (%) | 6 (7) | 2 (11) | 4 (5) | 0.339 |
| Smoking, n (%) | 10 (11) | 0 (0) | 10 (14) | 0.201 |
| Relationship, n (%) | ||||
| Parent | 22 (24) | 6 (33) | 16 (22) | 0.360 |
| Sibling | 19 (21) | 3 (17) | 16 (22) | 0.755 |
| Spouse | 47 (52) | 9 (50) | 38 (52) | 1 |
| Others | 2 (2) | 0 (0) | 2 (3) | 1 |
| Remaining kidney volume (cm3)a | 158 (102–227) | 163 (117–227) | 153 (102–220) | 0.639 |
| Remaining kidney weight (g)a | 175 (108–293) | 177 (128–288) | 175 (108–293) | 0.536 |
| Remaining kidney weight/dBSA (g/m2)a | 99 (68–161) | 103 (77–143) | 99 (68–161) | 0.415 |
| Remaining kidney scintigraphy (%)a | 53.3 (41.4–63.1) | 55.0 (44.4–63.1) | 52.1 (41.4–63.1) | 0.754 |
| Donor birth weight (g)a | 3200 (1500–5600) | 2000 (1500–2500) | 3400 (2600–5600) | — |
| Calculated nephron number of remaining kidneya | 6.9 × 10⁵ (2.3 × 10⁵–1.3 × 10⁶) | 4.5 × 10⁵ (2.3 × 10⁵–5.8 × 10⁵) | 7.2 × 10⁵ (4.9 × 10⁵–1.3 × 10⁶) | — |
aMedian (range).
Donor outcomes and comparison of donors with birth weight ≤2.5 kg versus birth weight >2.5 kg
| All donors (n = 91) | Donor birth weight ≤2.5 kg (n = 18) | Donor birth weight >2.5 kg (n = 73) | P-value | |
|---|---|---|---|---|
| Hypertension, n (%) | 35 (38) | 12 (66) | 23 (32) | 0.013* |
| Onset pre-transplant | 17 (19) | 5 (28) | 12 (16) | 0.314 |
| Onset post-transplant | 18 (20) | 7 (39) | 11 (15) | 0.043* |
| Proteinuria | ||||
| Proteinuria pre-transplant (mg/dL)* | 49 (10–98) | 49 (10–98) | 49 (40–72) | 0.788 |
| Proteinuria at +12 months (mg/dL)* | 130 (42–256) | 169 (107–256) | 128 (42–233) | 0.004* |
| Estimated glomerular filtration rate (eGFR) | ||||
| eGFR pre-transplant (mL/min) | 89.2 (63.5–116.4) | 93.9 (66.6–113.7) | 89.2 (63.5–116.4) | 0.854 |
| eGFR at +12 months (mL/min) | 58.6 (37.5–88.8) | 46.0 (37.5–75.4) | 60.1 (40.7–88.1) | 0.008* |
| eGFR at +36 months (mL/min) | 61.2 (40.0–100.5) | 49.0 (40.0–87.2) | 61.4 (43.8–100.5) | 0.204 |
| eGFR at +60 months (mL/min) | 66.6 (36.5–89.3) | 61.3 (51.3–70.3) | 71.9 (36.5–89.3) | 0.356 |
| Serum uric acid | ||||
| Serum uric acid pre-transplant (mg/dL)* | 4.9 (2.1–8.3) | 5.1 (3.8–8.3) | 4.7 (2.1–7.9) | 0.003* |
| Serum uric acid at +12 months (mg/dL)* | 5.8 (3.5–10.2) | 6.0 (4.9–8.9) | 5.6 (3.5–10.2) | <0.001* |
| Diabetes mellitus pre-transplant, n (%) | 0 (0) | 0 (0) | 0 (0) | — |
| Prediabetes | 0 (0) | 0 (0) | 0 (0) | — |
| Non-insulin-/insulin-dependent | 0 (0) | 0 (0) | 0 (0) | — |
| Diabetes mellitus post-transplant, n (%) | 8 (9) | 4 (22) | 4 (5) | 0.046* |
| Prediabetes | 4 (4) | 2 (11) | 2 (3) | |
| Non-insulin-/insulin-dependent | 2 (2)/2 (2) | 0 (0)/2 (11) | 2 (3)/0 (0) | |
| Cardiovascular events pre-transplant, n (%) | 0 (0) | 0 (0) | 0 (0) | — |
| Myocardial infarction | 0 (0) | 0 (0) | 0 (0) | — |
| Stroke | 0 (0) | 0 (0) | 0 (0) | — |
| Cardiovascular events post-transplant, n (%) | 2 (2) | 1 (6) | 1 (1) | 0.358 |
| Myocardial infarction | 1 (1) | 1 (6) | 0 (0) | |
| Stroke | 1 (1) | 0 (0) | 1 (1) | |
*Denotes statistically significant.
Donor outcomes
Correlation of markers of nephron number with the remaining kidney function
We first analysed the relationship between expected markers of nephron number (donor age, donor birth weight, donor kidney weight/BSA and donor kidney volume) and eGFR so as to test the hypothesis that the remaining kidney function is linked to overall and remaining nephron number. The mean eGFR was 57.1 mL/min [standard deviation (SD) 11.5 mL/min], 62.3 mL/min (SD 12.9 mL/min) and 64.1 mL/min (SD 12.5 mL/min) at +12, +36 and +60 months of follow-up after donor nephrectomy, respectively.
No differences were observed for eGFR before donor nephrectomy between donors with birth weight ≤2.5 kg and donors with birth weight >2.5 kg (P > 0.05; Table 2).
Donor birth weight showed a strong positive correlation with eGFR at +12 months after nephrectomy (R = 0.357, P < 0.001), and moderate positive correlation at +36 and +60 months after nephrectomy (R = 0.345, P = 0.006; R = 0.333, P = 0.042; Figure 1). Donors with birth weight ≤2.5 kg showed significantly lower eGFR at +12, +36 and +60 months after donor nephrectomy compared with donors with birth weight >2.5 kg (P < 0.05). The change in eGFR over time (+12 to +36, +36 to +60 and +12 to +60 months) did not show a statistical difference between donors with birth weight ≤2.5 kg and donors with birth weight >2.5 kg.
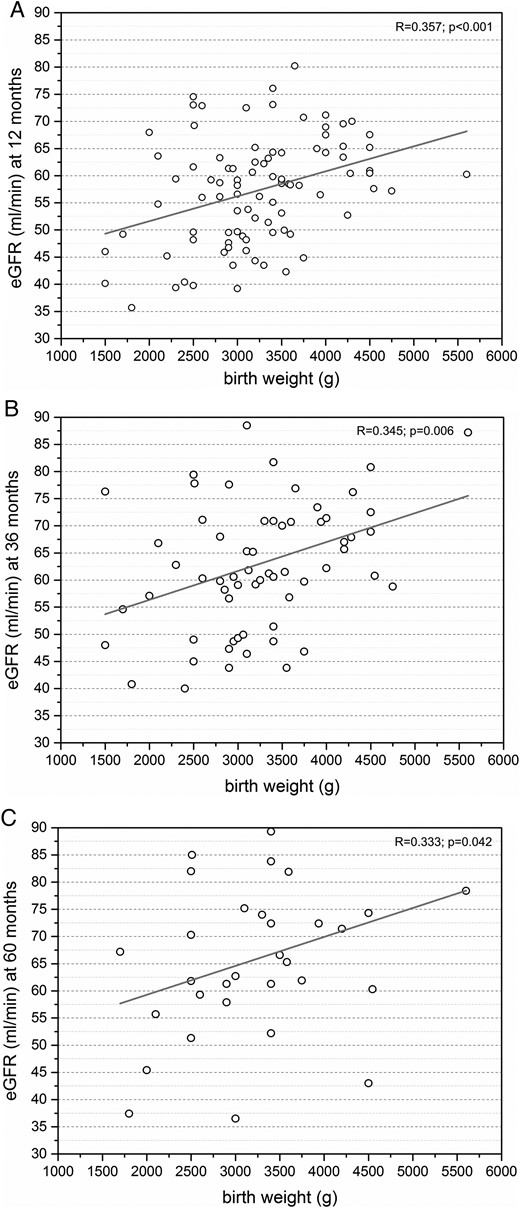
(A) Moderate positive correlation between eGFR and donor birth weight at +12 months after nephrectomy (n = 91). (B) Moderate positive correlation between eGFR and donor birth weight at +36 months after nephrectomy (n = 63). (C) Moderate positive correlation between eGFR and donor birth weight at +60 months after nephrectomy (n = 32).
Donor age showed a strong negative correlation with eGFR +12, +36 and +60 months after donor nephrectomy (P < 0.05; Figure 2A). The strongest positive correlation between donor birth weight and eGFR was observed at +12 months after nephrectomy in donors above the age of 50 years (R = 0.610, P < 0.001; Figure 2B), whereas donors below the age of 50 years showed no correlation (R = 0.008, P = 0.958; Figure 2B). No difference in the correlation between donor birth weight and eGFR was observed between female and male donors at +12 months (P < 0.05).
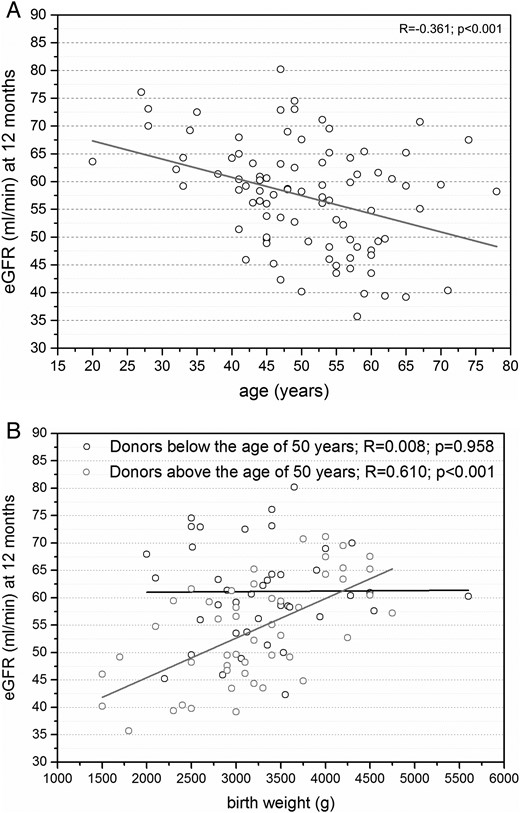
(A) Moderate negative correlation between eGFR and donor age at +12 months after nephrectomy (n = 91). (B) While donors above the age of 50 years show a strong positive correlation between eGFR and donor birth weight at +12 months after nephrectomy (n = 49), donors below the age of 50 years only show a weak positive correlation between eGFR and donor birth weight at +12 months after nephrectomy (n = 42).
Estimated nephron number of the remaining kidney showed the strongest correlation with eGFR at +12 months after nephrectomy (R = 0.540, P < 0.001), and strong positive correlation at +36 and +60 months after nephrectomy (R = 0.459, P < 0.001; R = 0.506, P = 0.003; Figure 3).
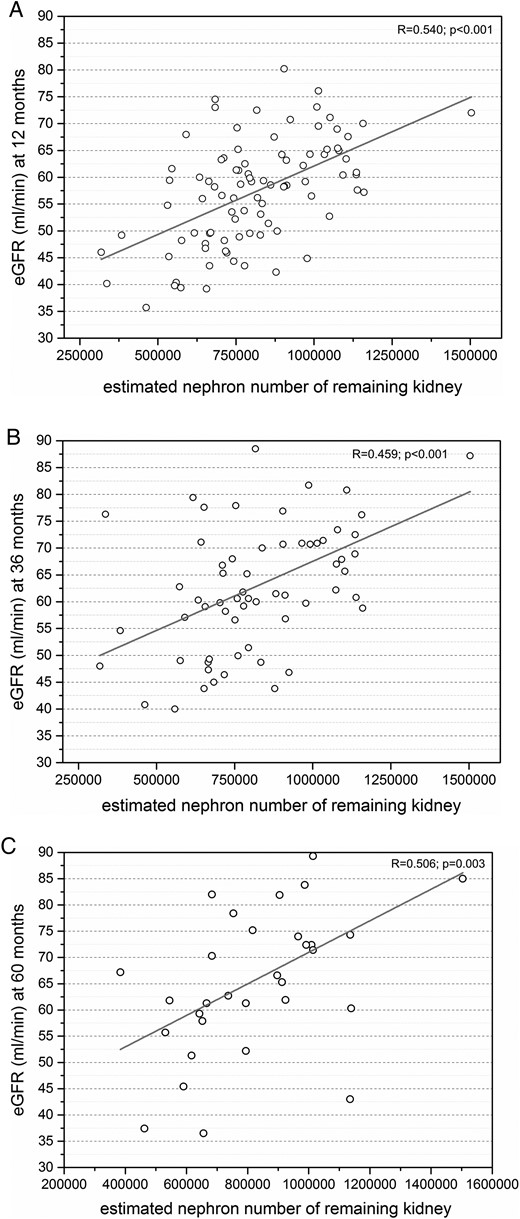
(A) Strong positive correlation between eGFR and estimated nephron number of the remaining kidney at +12 months after nephrectomy (n = 91). (B) Strong positive correlation between eGFR and donor birth weight at +36 months after nephrectomy (n = 63). (C) Strong positive correlation between eGFR and donor birth weight at +60 months after nephrectomy (n = 32).
Changes of eGFR (ΔeGFR) from +12 to +36 months were 2 mL/min (median; range −12 to 26 mL/min); 20 of 63 donors (32%) showed an increase of eGFR of >5 mL/min, whereas 10 of 63 donors (16%) showed a decrease of eGFR of >5 mL/min. No differences were observed for donor birth weight, age or estimated nephron number with regard to ΔeGFR (P > 0.05).
Donors classified as chronic kidney disease (CKD) Stage 2 at +12 months after nephrectomy showed significantly higher birth weights compared with donors classified as CKD Stage 3 at +12 months after nephrectomy (P < 0.001; Figure 4A). Donor kidney weight/BSA, donor kidney volume and split kidney function evaluated by kidney scintigraphy did not show any correlation with eGFR +12, +36 and +60 months after donor nephrectomy (P < 0.05).

(A) Significantly higher birth weight in donors that meet criteria of CKD Stage 2 compared with Stage 3 at +12 months after nephrectomy. (B) Significantly lower birth weight in donors with pre-existing or new-onset hypertension after donor nephrectomy. Black dots mark donors with pre-existing hypertension and grey dots mark donors with new-onset hypertension. (C) Significantly higher birth weight in donors with proteinuria <150 mg/24 h at +12 months after nephrectomy.
No differences were observed between donors with a right or left solitary kidney (P > 0.05).
Correlation of markers of nephron number on hypertension and proteinuria
We also observed a correlation between donor birth weight and the development of hypertension and daily proteinuria. Donors with pre-existing or new-onset hypertension at +12 months after nephrectomy showed significantly lower birth weights compared with donors without hypertension (P = 0.044; Figure 4B). Similarly, donors with birth weight ≤2.5 kg were more likely to show new-onset hypertension after donor nephrectomy compared with donors with birth weight >2.5 kg (P = 0.043). Donors with daily proteinuria >150 mg/24 h at +12 months after nephrectomy showed significantly lower birth weights compared with donors with daily proteinuria <150 mg/24 h (P < 0.001; Figure 4C). Similarly, donors with birth weight ≤2.5 kg showed significantly higher daily proteinuria at +12 months [81.3% (13/16) of donors with proteinuria >150 mg/24 h] compared with donors with birth weight >2.5 kg [35% (21/60) of donors with proteinuria >150/24 h; P < 0.05]. Donors with birth weight ≤2.5 kg showed a higher incidence of new-onset diabetes mellitus after nephrectomy compared with donors with birth weight >2.5 kg (P = 0.046). Donor kidney weight/BSA and donor kidney volume did not show any correlation with the development of proteinuria and hypertension at +12 months after donor nephrectomy (P < 0.05). No differences were observed between donors with a right or left solitary kidney (P > 0.05).
Correlation of serum uric acid levels and donor birth weight
Donor birth weight showed a moderate negative correlation with donor serum uric acid levels before donor nephrectomy (R = −0.307, P = 0.006; Figure 5A). At +12 months after nephrectomy donors showed significantly higher serum uric acid levels (P < 0.001) and a moderate negative correlation with donor birth weight (R = −0.337, P = 0.003; Figure 5B). Donors with birth weight ≤2.5 kg showed significantly higher serum uric acid levels before and at +12 months after nephrectomy compared with donors with birth weight >2.5 kg (P < 0.05). Donors with pre-existing or new-onset hypertension at +12 months after nephrectomy showed significantly higher serum uric acid levels at +12 months after nephrectomy compared with donors without hypertension (P = 0.005; Figure 5C). The increase in serum uric acid levels from pre- to post-nephrectomy did not show a statistical difference between donors with birth weight ≤2.5 kg and donors with birth weight >2.5 kg, or donors with or without hypertension (P > 0.05).
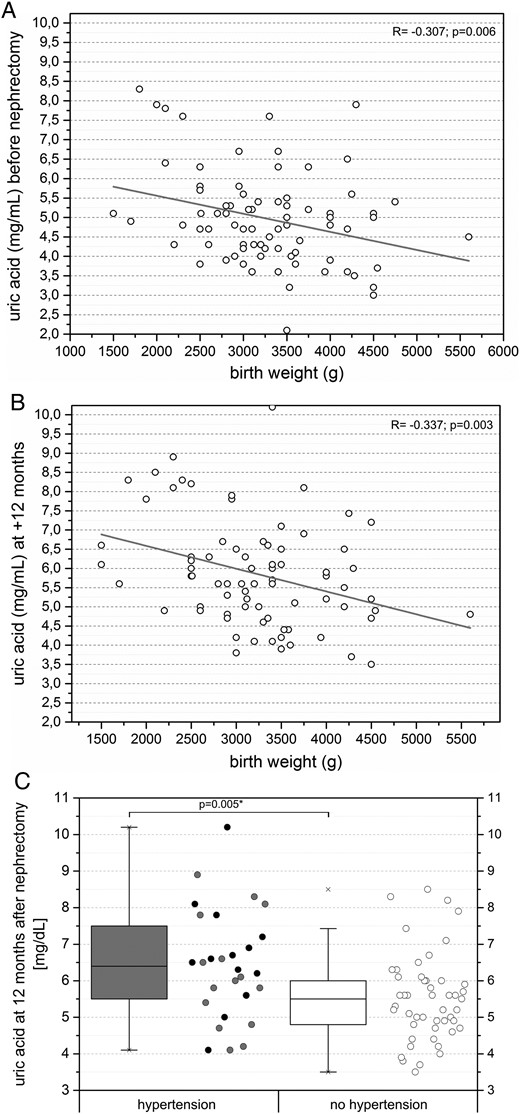
(A) Moderate negative correlation between donor serum uric acid levels and donor birth weight before nephrectomy (n = 80). (B) Moderate negative correlation between donor serum uric acid levels and donor birth weight at +12 months after nephrectomy (n = 77). (C) Significantly higher serum uric acid levels in donors with pre-existing or new-onset hypertension +12 months after nephrectomy. Black dots mark donors with pre-existing hypertension and grey dots mark donors with new-onset hypertension.
DISCUSSION
Previous works on health-related quality of life in living kidney donors showed favourable long-term outcomes [25]. However, very recent work suggested that living kidney donors are at increased long-term risk of end-stage renal disease, cardiovascular disease and overall mortality, which might be related to the reduction of nephron number due to nephrectomy [1, 2]. In a remarkable study in 1939, Hayman et al. showed that nephron number in healthy single kidneys ranges from 750 000 to 1 200 000, by counting glomeruli in suspension [26]. More recent studies have confirmed that this large variability of nephrons per kidney ranges even more widely, from 200 000 to 2 000 000 nephrons per kidney [11, 12, 15, 24]. Calculations of nephron number using donor birth weight and age as performed in this study show nephron number estimates falling in the suggested range.
Therefore, our hypothesis was that differences in outcomes of living kidney donors in terms of the remaining kidney function, manifestation of hypertension and the amount of daily proteinuria are associated with the large variability of nephron number, which obviously occurs, due to the reduction of nephron number by 50% after nephrectomy. Here, we attempted to address the impact of estimations of nephron number on donor outcomes.
First, our data suggest a strong relationship between donor birth weight as a marker of nephron number and the remaining eGFR in short- and intermediate-term follow-up. It has been confirmed that in many previous studies, birth weights are strongly correlated with glomerular number with an additional 200 000 nephrons predicted in each kidney for each 1 kg increase in birth weight [15, 27]. It is suggested that no new nephrons are formed in humans beyond the 36th week of gestation [11, 12]. Thus, any increase in total glomerular volume that accompanies kidney enlargement during growth must be achieved through enlargement of existing glomeruli. Published reports describe higher mean glomerular volumes in adults with lower nephron numbers, lower birth weights, larger adult body size and hypertension [24]. Larger glomeruli have been suggested to be at greatest risk for hyperperfusion injury and ultimately sclerosis [6, 11].
Our data show the strongest relationship between donor birth weight and remaining eGFR in elderly donors. This observation may be attributed to the continuous loss of glomeruli with age, with a mean predicted loss of ∼4500 glomeruli per kidney per year starting in the third decade of life [28]. The natural decline of renal function with age and reduced renal functional reserve in elderly donors may contribute to the strong correlation in elderly donors.
To take both observations from autopsy studies into account, we estimated the nephron number of the remaining kidney by a two-variable equation using donor birth weight and donor age. This calculation of nephron number using both donor birth weight and donor age showed the strongest correlation with eGFR at +12, +36 and +60 months after donor nephrectomy. This difference reflects the expected age-related reduction of the renal functional reserve.
Our data further support evidence that renal weight and size do not represent useful markers to estimate nephron number in adults. The gold standard method to determine nephron number is by stereology [29]. To circumvent this problem, renal weight and size have been often used as markers for nephron number. However, renal weight in adulthood should not be used as a marker for nephron endowment, as variations in weight only explain ∼5% of nephron numbers.
Secondly, our data suggest that low birth weight as a marker of nephron endowment has significant effects on the amount of daily proteinuria and the development of hypertension after donation. Here, previous works showed higher rates of microalbuminuria in patients with low birth weight, independent of the presence or the absence of diabetes mellitus [30–33].
In addition, it has been proposed that people with lower glomerular numbers are more susceptible to hypertension, which is initiated and propagated through the cascade of events that follows compensatory nephron hypertrophy [2, 5, 6]. In this context, our data on increased serum uric acid levels in donors developing hypertension support previous observations that an elevation in serum uric acid levels has a major role in the pathogenesis of hypertension [17, 34]. These studies suggest that uric acid causes endothelial dysfunction, vascular disease and a ‘salt-resistant’ hypertension, which then progresses to a renal-dependent pathway of salt-sensitive hypertension.
An important question, however, is how to link elevated serum uric acid levels and low birth weights with the risk for future hypertension. Here, Feig et al. have presented a proposal to combine both hypotheses [22]. Increased serum levels of uric acid in particular during the last trimester, which might be related to gestational hypertension or preeclampsia, may cross into the placenta along with other substances that may interfere with endothelial dysfunction to cause intrauterine growth retardation and impairment of nephron development. It remains possible that the low nephron number might itself predispose to the development of hyperuricaemia as a consequence of an increase in proximal tubular reabsorption. The elevation of uric acid may further be maintained by genetic, familial and environmental mechanisms. The observed higher incidence of Type 2 diabetes in donors with birth weight ≤2.5 kg is in line with previous studies suggesting a genetic link between low birth weight and later diabetes [4, 35].
Direct assessment of glomerular number in humans is currently not possible, although a combination of magnetic resonance imaging and histological analysis of kidney biopsies has enabled rough estimates [36]. Here, calculation of nephron number using birth weight and age represents the best available marker to estimate nephron number and might prove useful to be implemented in clinical decision-making: (i) education of donors about estimations of remaining kidney function, risk of new-onset hypertension and daily proteinuria; and (ii) selection of organ donors due to estimations of nephron number, particularly in elderly or hypertensive donors.
Limitations of this analysis included the relatively small sample size due to difficulties in collecting proofs of donor birth weights, and estimation of donor GFR due to safety reasons. The impact of donor birth weight as a marker of nephron number on mortality and risk of end-stage renal disease in donors needs to be addressed in upcoming studies. Here, additional parameters such as gestational age, and a classification of small-, appropriate- and large-for-gestational age need to be considered. Early initiation of therapy in cases of hyperuricaemia with regard to the development of hypertension in kidney donors needs to be evaluated. Since estimations of nephron number are based on autopsy studies performed in white Americans, ethnic variations with regard to glomerular size and number compared with our European cohort cannot be excluded.
In summary, our data for the first time show a strong correlation between estimations of nephron number and outcomes in kidney donors with regard to kidney function, hypertension and proteinuria. Its clinical value as a marker to be implemented in donor education and risk assessment needs to be addressed in upcoming studies.
CONFLICT OF INTEREST STATEMENT
None declared.
ACKNOWLEDGEMENTS
The authors gratefully thank Anett Sefrin, Cordula Giesler and Sabine Boas-Knoop, who participated in the research for this study. The authors would like to give very special thanks to Marc C. Gossmann for his support in data collection.


Comments
Sir, Drs. Schachtner and Reinke recently reported an interesting study on the impact of estimated nephron number on the outcome of the remaining donor kidney[1]. As counting nephrons in vivo is currently impossible, an estimation based on a marker may be helpful. The authors rightfully state the results from our meta-analysis with which we have shown that renal size or weight only explain a small variation in nephron numbers[2]. In order to provide an estimate, the authors have developed a rather clever calculation of the nephron number based on birth weight (as a marker of nephron endowment) and age (as a marker of nephron loss). This calculated nephron number showed the strongest correlation with renal function at the time points after donor nephrectomy. With the available data, I feel that the authors could provide additional information. For instance, it would be attractive to study the association between nephron number and renal size or weight within the present cohort. More importantly, the authors are right in referring the notion that larger glomeruli are expected to have an increased risk of hyperfiltration injury. As no measurements of glomerular size were available, it would be of interest to design a marker for glomerular size. A possible marker may be found in the relationship between nephron number and renal size. A kidney with a lower number of nephrons that still has an average size is expected to be hypertrophic, which is based on both an increase in glomerular as well as tubular size[3]. It may therefore be expected that a larger kidney volume per fixed number of nephrons (for instance: cm3/100,000 nephrons) is indicative of glomerular hypertrophy. This calculation may further improve the strength to predict renal injury, based on blood pressure, proteinuria and/or glomerular filtration rate. With their data, drs. Schachtner and Reinke have the possibility to study such a marker of glomerular hypertrophy. If this would turn out to be a predictive marker, the kidney volume to nephron number-ratio may assist in predicting long-term consequences of kidney donation[4].
References 1. Schachtner T and Reinke P. Estimated nephron number of the remaining donor kidney: impact on living kidney donor outcomes. Nephrol Dial Transplant 2016 doi: 10.1093/ndt/gfv458 2. Bueters RR, van de Kar NC, Schreuder MF. Adult renal size is not a suitable marker for nephron numbers: an individual patient data meta- analysis. Kidney Blood Press Res 2013; 37: 540-546 3. Elsherbiny HE, Alexander MP, Kremers WK, et al. Nephron hypertrophy and glomerulosclerosis and their association with kidney function and risk factors among living kidney donors. Clin J Am Soc Nephrol 2014; 9: 1892- 1902 4. Grams ME, Sang Y, Levey AS, et al. Kidney-Failure Risk Projection for the Living Kidney-Donor Candidate. N Engl J Med 2016; 374: 411-421
Conflict of Interest:
None declared