


Abstract
Atherosclerotic renal artery stenosis (ARAS) activates oxidative stress and chronic inflammatory injury. Contrast imaging and endovascular stenting pose potential hazards for acute kidney injury, particularly when superimposed upon reduced kidney perfusion.
We measured sequential early and long-term changes in circulating inflammatory and injury biomarkers in 12 ARAS subjects subjected to computed tomography imaging and stent revascularization compared with essential hypertensive (EH) subjects of similar age under fixed sodium intake and medication regimens in a clinical research unit.
NGAL, TIMP-2, IGFBP7, MCP-1 and TNF-α all were elevated before intervention. Post-stenotic kidney volume, perfusion, blood flow and glomerular filtration rate (GFR) were lower in ARAS than in EH subjects. TIMP-2 and IGFBP7 fell briefly, then rose over 18 h after contrast imaging and stent deployment. Circulating NGAL decreased and remained lower for 27 h. These biomarkers in ARAS returned to baseline after 3 months, while kidney volume, perfusion, blood flow and GFR increased, but remained lower than EH.
These divergent patterns of inflammatory signals are consistent with cell cycle arrest (TIMP-2, IGFBP7) and relative protection from acute kidney injury after imaging and stenting. Sustained basal elevation of circulating and renal venous inflammatory biomarkers support ongoing, possibly episodic, renal stress in ARAS that limits toxicity from stent revascularization.
INTRODUCTION
Atherosclerotic renal artery stenosis (ARAS) reduces blood flow and perfusion pressures to the post-stenotic kidney, produces renovascular hypertension and threatens glomerular filtration rate (GFR). For selected cases, restoring vessel patency with stent revascularization can lower arterial pressure and prevent the loss of renal function [1].
The procedures of endovascular stenting may be associated with contrast-induced nephropathy, atheroembolism, renal artery or aortic dissection, or renal artery rupture [1]. ARAS is associated with activation of the renal-angiotensin-aldosterone system, oxidative stress and chronic inflammatory injury [2]. Although endovascular stenting can provide major benefits for high-risk patients with severe hypertension, rapidly progressive renal failure and/or pulmonary edema [3], prospective treatment trials [4–6] fail to show consistent additional benefit of renal artery revascularization in improving renal function as compared with optimal medical therapy. The role and immediate changes of inflammatory biomarkers in this condition remain poorly defined.
Neutrophil gelatinase-associated lipocalin (NGAL) and kidney injury molecule-1 (KIM-1) have been proposed as signaling biomarkers of acute kidney injury (AKI) [7]. Recent studies using urinary insulin-like growth factor binding protein 7 (IGFBP7) and tissue inhibitor of metalloproteinases-2 (TIMP-2) validate these biomarkers for risk stratification of moderate and severe AKI in the Discovery and Sapphire studies [8]. Urinary IGFBP7*TIMP-2 has been approved by the US Food and Drug Administration as a biomarker to predict early AKI and prognosis in postoperative AKI [9, 10] and critically ill patients [11]. Both IGFBP7 and TIMP-2 participate in G1 cell cycle division during the early phase of cell injury and prevent cells with damaged DNA from dividing [9]. Hence, they are sensitive to and potentially protective for early tubular injury. Studies of remote ischemic preconditioning suggest that individuals with a rise in TIMP-2 and IGFBP7 are those most likely to be protected from AKI after surgery [12]. The aim of our present study was to examine changes in renal injury and inflammatory biomarkers in peripheral blood during the first 27 h after contrast imaging and stent revascularization and to compare them to levels achieved 3 months later. We further sought to examine renal venous levels of these biomarkers before and after restoring blood flow 3 months later.
METHODS
Patient selection
ARAS patients (n = 12) with clinical indications for renal revascularization (including treatment-resistant hypertension, circulatory congestion or rapidly progressive renal failure) and essential hypertension (EH) (n = 12) were prospectively enrolled for inpatient studies in the clinical research unit of Saint Mary's Hospital (Rochester, MN, USA) [13] from 2008 to 2014. Written informed consent was obtained from all patients at the time of enrollment, as approved by the Institutional Review Board of the Mayo Clinic. ARAS was quantified using entry criteria analogous to enrollment in Cardiovascular Outcomes for Renal Atherosclerotic Lesions (CORAL) [14] with magnetic resonance/computed tomography (CT) angiography showing at least 60% luminal occlusion in the affected artery estimated by Doppler ultrasound, with the additional requirement for serum creatinine <2.5 mg/dL. Patients maintained previous medications and daily dietary intake of 150 mEq of sodium. All patients were administered angiotensin-converting enzyme (ACE) inhibitors or angiotensin receptors blockers (ARBs). Seven patients had bilateral stenosis, 4 had a single artery treated and 1 was not subjected to stenting, leaving 18 stenotic kidneys (STKs) treated with stents for analysis. Demographics and clinical data were collected by physical examination or via electronic medical records. Use of concomitant medication including anti-hypertension drugs and statins was recorded. After stenting, a completion angiogram using iodixanol (Visipaque 320, GE Healthcare) was performed to ensure patent peripheral arteries were without small distal stenosis or occlusion. ARAS patients subjected to renal revascularization returned for repeat measurements 3 months after renal revascularization.
Renal function and blood pressure measurements
GFR by iothalamate clearance (iothalamate meglumine, Conray, Mallinckrodt) after oral hydration (20 mL/kg) was measured over three 30-min timed collection periods, as described previously [15, 16]. Single kidney GFR was determined by apportioning the measured iothalamate clearance to the percentage of blood flow for each kidney measured by CT, as described below. Blood pressure was measured by automated oscillometric recordings including three values taken three times daily (an automated oscillometric unit, Omron blood pressure, measured blood pressure at 5, 7, and 9 min after a 5-min rest).
Renal hemodynamic measurement by multidetector CT
A 5F straight catheter was advanced into right atrium for central venous injection of contrast for flow studies using multidetector CT (MDCT). MDCT imaging was obtained using a dual-source 64-slice helical MDCT scanner (SOMATOM Definition, Siemens Medical Solutions) after a bolus injection of iohexol 350 (0.5 mL/kg up to a maximum of 40 mL) using a power injector during respiratory suspension. Perfusion scans were performed at 120 kVp and 160 mAs (adjusted for the signal∶noise ratio of the scan) with 20 × 1.2 collimation and 0 table feed. The flow study was composed of 45 scans, of which the first 35 scans were divided into three consecutive scanning sequences (each 20 s long), followed by 10 additional scans at 8-s intervals. The total scanning time lasted ≈158 s and the longest breath hold was 20 s. Images representing four slices (5-mm thickness) localized in the hilum region were acquired and reconstructed using a B40f kernel. Fifteen minutes after completion of the perfusion study, a kidney volume scan (5-mm thick slices) was performed in the helical mode to determine both cortical and medullary regional volumes, then the patients underwent the stenting procedure. The total amount of contrast used for CT imaging included about 90 cc of iohexol (Novaplus, omnipaque 350 mg I/mL, GE Healthcare, Princeton, NJ) and 60 cc iodixanol (Visipaque 320 mg I/mL, GE Healthcare) for angiography. Stenotic kidney cortical perfusion, medullary perfusion and renal blood flow (RBF) were measured in ARAS patients using MDCT, as previously described [17].
Renal vein and peripheral plasma sampling
Renal vein blood samples for NGAL, monocyte chemoattractant protein-1 (MCP-1), interleukin-10 (IL-10), tumor necrosis factor α (TNF-α), KIM-1, IGFBP7 and TIMP-2 and inferior vena cava (IVC) samples for MCP-1, IL-10 and TNF-α were obtained before and immediately after stenting and again 3 months later. Additionally, peripheral venous levels for NGAL, KIM-1, IGFBP7 and TIMP-2 were obtained pre-stenting, immediately and every 6 h over the 27 h after stenting and again 3 months later. Samples were stored at −80°C until measurement as single batches for each patient. NGAL and KIM-1(ng/mL) were tested by ELISA according to the manufacturer's protocol (BioPorto Diagnostics, catalog no. KIT 036 and R&D Systems, catalog no. DKM100, respectively). The samples for IGFBP7 were diluted 1:2 and tested by ELISA (R&D Systems, catalog no. KIT DY1334-05). The samples for TIMP-2 were diluted 1:500 and tested by ELISA (Sigma-Aldrich, lot no. RAB0472). Levels of TNF-α and MCP-1 were measured by luminex (Millipore, cat no. MPXHCYTO-60K). Signals were read by the Bio-Plex 200 system (Bio-Rad).
Statistical analysis
Results were expressed as mean ± SD. Qualitative variables were expressed as a percentage. Comparisons between independent groups with EH or ARAS were performed using two-sample t-tests with unequal variance. Comparisons between stenotic and non-stenotic kidneys and repeated measurements in different time points within the same individuals after revascularization were performed using paired t-tests. To examine the early potential for AKI, analyses of the change in serum creatinine from baseline to 24 h were correlated with baseline and subsequent biomarker levels using Spearman's rank correlation analysis. Repeated-measures ANOVA was performed using the Fit Model platform in JMP software (SAS Institute, Cary, NC, USA) for repeated measurement design data within subjects. A significance level of 0.05 was accepted. Statistical analysis was performed using JMP software version 8.0.
RESULTS
Baseline characteristics comparison between ARAS and EH patients
Demographic and clinical features for 12 patients in the ARAS group (7 with bilateral renal artery stenosis) before revascularization and 12 EH patients are summarized in Table 1. Age, weight, diastolic blood pressure, hematocrit, total cholesterol and triglycerides were not different between groups. Serum creatinine, systolic blood pressure and body mass index (BMI) were higher in patients with ARAS, while HDL, LDL and iothalamate clearance (GFR) were lower. Baseline levels of systemic IGFBP7 and TIMP-2 in EH patients were higher than in ARAS patients.
Baseline characteristics
| EH (N = 12) | ARAS (N = 12) | P-value | |
|---|---|---|---|
| Gender, male (%) | 50 | 50 | |
| Age (years) | 64 ± 15 | 72 ± 6 | 0.05 |
| SBP (mmHg) | 132 ± 18 | 155 ± 18 | 0.002 |
| DBP (mmHg) | 71 ± 11 | 72 ± 12 | 0.36 |
| BMI (kg/m2) | 26.2 ± 4.1 | 31.6 ± 9.4 | 0.04 |
| ACEI or ARBs, yes/no (n/n) | 11/1 | 12/12 | |
| Statins, yes (%) | 6 (50%) | 12 (100%) | |
| Creatinine (mg/dL) | 0.97 ± 0.26 | 1.68 ± 0.49 | <0.0001 |
| Iothalamate clearance GFR (mL/min) | 77 ± 25 | 48 ± 21 | 0.003 |
| Hematocrit (%) | 38.5 ± 4.2 | 37.2 ± 3.1 | 0.18 |
| Total cholesterol (mg/dL) | 189 ± 26 | 162 ± 50 | 0.07 |
| TG (mg/dL) | 131 ± 62 | 146 ± 69 | 0.32 |
| HDL (mg/dL) | 57 ± 11 | 45 ± 11 | 0.02 |
| LDL (mg/dL) | 106 ± 19 | 72 ± 23 | 0.002 |
| IGFBP7 (pg/mL) | 14.59 | 13.24 | 0.004 |
| TIMP-2 (pg/mL) | 99.39 | 86.57 | 0.08 |
GFR, glomerular filtration rate; SBP, systolic blood pressure; DBP, diastolic blood pressure; N, number of patients; ACEI, angiotensin-converting enzyme inhibitors; ARBs, angiotensin receptors blockers.
GFR and RBF in ARAS stenotic and EH kidneys
Results from quantitative MDCT measurements of hemodynamics of individual kidneys are summarized in Table 2. One kidney per EH patient was chosen and compared with treated kidneys of ARAS patients.
Single kidney volumes, blood flows and function
| Single kidney | EH (N = 12 kidneys) | ARAS (N = 18 stenotic kidneys) | |
|---|---|---|---|
| Baseline | 3 months | ||
| Total kidney volume on CT (mL) | 133.3 ± 34.6 | 114.30 ± 42.89 | 120.23 ± 45.13† |
| Cortical volume (mL) | 85.9 ± 25.0 | 66.42 ± 25.20* | 74.27 ± 27.05† |
| Medullary volume (mL) | 47.4 ± 11.4 | 47.88 ± 19.45 | 45.96 ± 19.60 |
| Cortical perfusion (mL/min per mL of tissue) | 3.61 ± 1.26 | 2.36 ± 0.87* | 2.65 ± 0.87* |
| Medullary perfusion (mL/min per mL of tissue) | 1.16 ± 0.39 | 0.82 ± 0.29* | 0.92 ± 0.36 |
| Total renal blood flow (mL/min) | 371 ± 203 | 204 ± 108* | 237 ± 103*,† |
| Cortical flow (mL/min) | 316 ± 183 | 162 ± 84* | 194 ± 86*,† |
| Medullary flow (mL/min) | 55 ± 23 | 42 ± 30 | 43 ± 28 |
| Single kidney GFR (mL/min per kidney) | 38.60 ± 13.81 | 25.52 ± 13.70* | 31.36 ± 19.27† |
*P-value <0.05 versus EH.
†P-value ≤0.05 versus baseline.
Baseline
Cortical volume, cortical and medullary perfusion (flow per unit tissue volume) and whole kidney blood flow were reduced in the STKs as compared with EH kidneys, primarily due to reduced cortical flow. Single kidney iothalamate GFR (mL/min per kidney) in STKs was lower than in EH kidneys.
Three months later
Total kidney volume and total renal blood flow increased slightly after stenting, primarily due to a rise in cortical volume and flow. Single kidney iothalamate GFR increased. Cortical perfusion, total renal blood flow and cortical flow remained lower as compared with EH.
Serum creatinine and estimated GFR (eGFR) in ARAS and EH
Serum creatinine was higher in ARAS than in EH (1.68 ± 0.49 versus 0.97 ± 0.26 mg/dL, P < 0.001) before stenting and declined (1.52 ± 0.44 mg/dL, P = 0.003) by 3 months after stenting. For the group overall, serum creatinine level did not change 24 h after stenting (1.78 ± 0.43 mg/dL, P = 0.3). However, 2 of 12 (16.7%) ARAS patients' serum creatinine level increased >0.5 mg/dL by the next day. Both returned to baseline by 3 months. eGFR was lower for ARAS than EH (38 ± 12 versus 76 ± 21 mL/min/1.73 m2, P < 0.001) at baseline and increased by 3 months (43 ± 14 mL/min/1.73 m2, P = 0.004).
Changes in circulating biomarkers during 27 h after imaging and stenting
A repeated measures ANOVA revealed significant differences at different time points for NGAL, TIMP-2, IGFBP7*TIMP-2 and KIM-1, but not IGFBP7 (Table 3). NGAL decreased 3 h after contrast injection and stenting and remained lower than baseline for the following 24 h (Figure 1A). Both IGFBP7 and TIMP-2 fell immediately after stenting but rose again thereafter. TIMP-2 levels increased and remained above baseline over the following 18 h (Figure 1B and C). Similarly, IGFBP7*TIMP-2 fell immediately after endovascular stenting, then rose after 9 h (Figure 1D). KIM-1 did not change after stenting until 21 h later and remained higher than baseline for 6 h (Figure 1E). MCP-1 in IVC also decreased immediately after stenting, but TNF-α and IL-10 in IVC did not change (data not shown). All biomarkers returned to baseline levels after 3 months.
Repeated measures ANOVA analysis
| F ratio | P-value | |
|---|---|---|
| NGAL | 2.7000 | 0.0148 |
| TIMP-2 | 5.2079 | <0.0001 |
| IGFBP7 | 1.0019 | 0.4366 |
| IGFBP7*TIMP-2 | 4.5009 | 0.0003 |
| KIM-1 | 7.6770 | <0.0001 |
| F ratio | P-value | |
|---|---|---|
| NGAL | 2.7000 | 0.0148 |
| TIMP-2 | 5.2079 | <0.0001 |
| IGFBP7 | 1.0019 | 0.4366 |
| IGFBP7*TIMP-2 | 4.5009 | 0.0003 |
| KIM-1 | 7.6770 | <0.0001 |
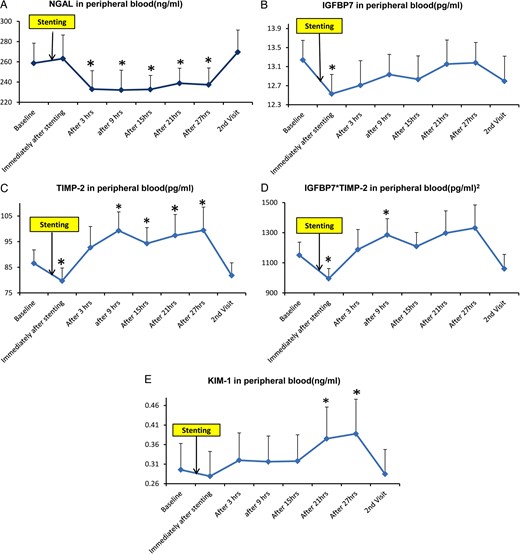
(A) Sequential measurements (mean ± SE) of peripheral plasma NGAL before (baseline) and after renal artery stenting in patients with high-grade renal artery stenosis. Thereafter, measurements were made at approximately 6-h intervals for 27 h, then repeated on readmission 3 months later. (B) Includes similar time point measurements of IGFBP7. (C) TIMP-2. (D) Product of IGBP7*TIMP-2. (E) KIM-1. *P-value <0.05 versus baseline.
Correlation between early changes (24 h) in serum creatinine and biomarkers after imaging and stenting
After imaging and stenting, circulating IGFBP7 positively correlated with the change in serum creatinine (▵Cr) at 3 h (r = 0.633, P = 0.0272), 21 h (r = 0.729, P = 0.0071) and 27 h (r = 0.716, P = 0.0089). TIMP-2 was related to ▵Cr only at 21 h (r = 0.595, P = 0.0414). IGFBP7*TIMP-2 was positively related to ▵Cr at all time points after imaging and stenting. No correlations were evident between NGAL and KIM-1 with ▵Cr (Table 4).
Correlations between 24-h serum creatinine change and plasma biomarkers
| Biomarkers | Baseline | Immediately | 3 h | 9 h | 15 h | 21 h | 27 h | |||||||
|---|---|---|---|---|---|---|---|---|---|---|---|---|---|---|
| r | P-value | r | P-value | r | P-value | r | P-value | r | P-value | r | P-value | r | P-value | |
| IGFBP7 | 0.47 | 0.12 | 0.398 | 0.20 | 0.633 | 0.03 | 0.499 | 0.10 | 0.475 | 0.12 | 0.729 | 0.01 | 0.716 | 0.01 |
| TIMP-2 | 0.425 | 0.17 | 0.196 | 0.54 | 0.553 | 0.06 | 0.449 | 0.14 | 0.419 | 0.18 | 0.595 | 0.04 | 0.525 | 0.08 |
| IGFBP7 TIMP-2 | 0.562 | 0.06 | 0.410 | 0.19 | 0.716 | 0.01 | 0.641 | 0.02 | 0.656 | 0.02 | 0.762 | 0.00 | 0.657 | 0.02 |
Renal vein biomarkers in ARAS STKs and EH kidneys
Baseline renal venous levels of NGAL, IGFBP7, TIMP-2, MCP-1 and TNF-α were elevated in STKs compared with EH (Figure 2). Immediately after renal revascularization, MCP-1, IGFBP7 and IGFBP7*TIMP-2 decreased, while NGAL did not change. These markers returned to basal levels by 3 months, except NGAL, which was slightly higher than baseline. KIM-1, TNF-α and IL-10 remained unchanged. Despite these transient changes, biomarkers remained higher than those observed in EH.
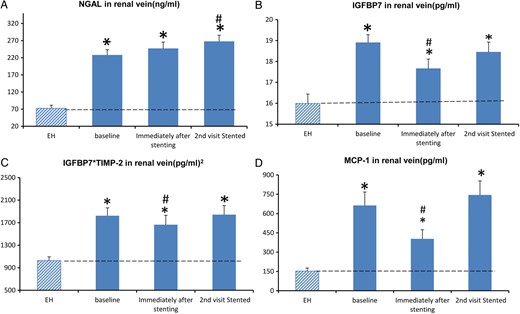
(A) The measurements (mean ± SE) of renal vein NGAL before (baseline) and immediately after renal artery stenting in patients with high-grade renal artery stenosis, then repeated on readmission 3 months later. (B) Renal vein IGFBP7 at baseline, immediately and 3 months after renal revascularization. (C) Product of IGBP7*TIMP-2. (D) MCP-1. *P-value <0.05 versus EH. #P-value ≤0.05 versus baseline.
DISCUSSION
The current study delineates for the first time baseline and acute changes of renal injury and inflammatory biomarkers after imaging and stent revascularization in ARAS. Preprocedure biomarker levels from the renal veins were universally elevated before any intervention, consistent with the concept that renovascular occlusive disease is associated with ongoing injury, as seen in experimental models [18]. Prolonged renal hypoperfusion contributes to activation of inflammatory signals and oxidative stress, thereby accelerating intrarenal injury and fibrosis in both experimental and human studies [2]. Our present data demonstrate that imaging and restoration of vessel patency are associated with transiently increased circulating markers of cell cycle arrest (TIMP-2 and IGFBP7) and reductions of circulating NGAL. We interpret these observations as suggesting that cell stress associated with contrast and instrumentation further activates tissue responses consistent with ‘biologic memory’, which can condition responses to future insults, or what has sometimes been designated ‘ischemic preconditioning’ [19].
We focused on acute changes after the procedure of vascular stenting, particularly considering the putative risks associated with contrast imaging and endovascular procedures in ARAS patients. Numerous experimental studies indicate that iodinated contrast injection transiently reduces renal blood flow [20], hypoxia of the renal medulla and release of renal free radicals via postischemic oxidative stress [21]. This group of patients was characterized by multiple risk factors for contrast nephropathy (including older age, diminished renal function, drug exposure and preexisting inflammation). Not surprisingly, multiple transient changes in kidney-associated biomarkers were induced over the subsequent 27 h in peripheral blood. Unexpectedly however, there was divergence between circulating NGAL, which fell and remained lower for at least 24 h, and TIMP-2 and IGFBP7, which demonstrated a transient decrease then remained at baseline or above baseline for the next 18 h.
IGFBP7 and TIMP-2 have been proposed as markers in the early diagnosis and prognostic prediction in AKI [8, 11]. Both molecules participate in G1 cell cycle arrest. When exposed to cellular stress, renal tubular cells may produce and release IGFBP7 and TIMP-2. IGFBP7 directly increases the expression of p53 and p21, and TIMP-2 stimulates p27 expression. These p proteins block the effect of cyclin-dependent protein kinase complexes (CyclD-CDK4 and CyclE-CDK2) on cell cycle promotion, thereby resulting in transient cell cycle arrest [22]. This process happens during early cell stress and may help cells maintain energy balance, prevent further DNA damage and provide cells with an opportunity to regain function when insults are past [23]. In our study, we found that baseline circulating IGFBP7 and TIMP-2 were slightly lower in ARAS than EH and did not correlate with eGFR in ARAS patients. However, baseline renal levels in ARAS were higher than in EH. These data are consistent with preexistent, possibly repetitive, kidney-specific injury evident in human subjects with ARAS.
Imaging and stenting procedures did affect these kidneys and induced temporary changes in biomarkers. Essentially all changes returned to baseline levels 3 months later. IGFBP7 and TIMP-2 changed earlier than other markers. IGFBP7*TIMP-2 at every time point after stenting correlated positively with the serum creatinine change observed 1 day later, consistent with the premise that cellular stress is reflected by cell cycle arrest after these procedures [24]. These observations generally support the concept that early detection of these two markers in peripheral blood may predict impending kidney injury, with the goal to ‘prompt closer patient monitoring and help prevent permanent kidney damage or death’ [25]. We speculate that the increase in IGFBP7 and TIMP-2 after the transient decrease in ARAS patients actually may reflect a protective response in the face of contrast and procedural hazards, reflected by an actual decrease in NGAL during the same time period and the remarkable rarity of actual AKI in these high-risk subjects.
It is notable that sustained cell cycle arrest can result in a senescent cell phenotype and lead to fibrosis. It would be desirable for tubular cells to reinitiate the cell cycle after the hemodynamic threat resolves [24]. Our study revealed that IGFBP7*TIMP-2 reached a peak at 9 h, then returned toward baseline 15 h after angiography and stenting. This timely decrease after such an increase might avoid further cellular injury and reduce the opportunity for senescence and fibrosis. Separately, TIMP-2 showed an increase in earlier and longer time than IGFBP7. TIMP-2 is not only involved in cell cycle arrest, but also inflammation, the pathophysiology of ischemia-reperfusion injury, early tubule interstitial injury and tubular regeneration after injury [26]. Increased renal expression of IGFBP7 is observed in experimental AKI induced by uranyl nitrate [27]. IGFBP7 is also associated with the severity and duration of AKI, prolonged hospitalization and mortality [28].
It should be emphasized that poststenotic kidney volume, blood flow and single kidney GFR were modestly higher than baseline 3 months after revascularization in this cohort, as we have observed before [17]. Hence, restoring blood flow was associated with partial recovery of kidney volume and function for this group of patients, but was associated with persistent elevations of injury cytokines (including TNF-α, NGAL, MCP-1 and KIM-1) in addition to the cell cycle arrest markers TIMP-2 and IGFBP7 above levels observed in normal subjects or those with EH. These observations indicate that inflammatory pathways in the poststenotic kidney still exist that were not reversed after restoring blood flow [17]. Adjunctive measures to be implemented during or after endovascular stenting that may modify these pathways are in the process of development for human and experimental renovascular disease in our center, including administration of a mitochondrial-targeted peptide, intra-arterial injection of endothelial progenitor cells and adipose-derived mesenchymal stem/stromal cells (MSCs) [2].
The precise actions and role of NGAL in ARAS remain incompletely understood. While often interpreted as a marker of acute injury, NGAL itself is an anti-inflammatory cytokine that may limit tissue injury. Experimental administration of NGAL provides structural and functional protection in animal models and participates in regeneration and repair processes observed after injury [29]. Remarkably, peripheral levels of NGAL fell after restoration of vessel patency and remained below baseline for 24 h, unlike cell cycle arrest markers (TIMP-2 and IGFBP7), which fell only transiently. Over the subsequent 3 months, all of these markers returned to baseline levels. We interpret these findings to indicate that processes of ongoing tissue injury and inflammation persist.
This study has limitations. It was not a randomized study, but enrolled patients selected for revascularization based on clinical criteria. Our control group was comprised of subjects of a similar age with EH, rather than ‘normal’ individuals. The EH group did include some healthy individuals with normal kidney hemodynamics and function. Individuals with ARAS had lower GFR, although most had relatively preserved function and were limited to serum creatinine levels <2.5 mg/dL.
Taken together, our results demonstrate that contrast imaging and stent revascularization are associated with transient but divergent changes in TIMP-2, IGFBP7 and NGAL over 27 h after the procedure. The absence of sustained AKI in this context may reflect relative resistance to toxicity as an example of ‘ischemic preconditioning’, as has been described using remote temporary vascular occlusion. These changes reverted to baseline by 3 months and were associated with modest increases in blood flow and function in revascularized kidneys that remained below those of EH. Our results demonstrate that elevated inflammatory biomarkers are part of the renovascular phenotype and do not appear to increase the risk of AKI and/or sustained loss of kidney function after intervention. Stent revascularization produced transient but reversible changes in specific markers, but did not lead to long-term changes in renal venous inflammatory signaling. These results further support the need to modify intrarenal vascular and inflammatory pathways to restore renal function in ARAS.
CONFLICT OF INTEREST STATEMENT
No conflicts of interest, financial or otherwise, are declared by all the authors.
ACKNOWLEDGEMENTS
The project described was supported by Award Number PO1HL85307 from the National Heart, Lung and Blood Institute (NHLBI), R01 DK100081 and DK 73608 from the National Institute for Digestive, Diabetic and Kidney Diseases (NIDDK) and National Institutes of Health (NIH)/National Center for Research Resources Clinical and Translational Science Award Grant Number UL1 RR024150 and a clinical study grant from Stealth Biopharmaceuticals. The content is solely the responsibility of the authors and does not necessarily represent the official views of the NHLBI, NIDDK or the NIH.


Comments