


Treatment of iron deficiency with intravenous (i.v.) iron is a first-line strategy to improve anaemia of chronic kidney disease. Previous in vitro experiments demonstrated that different i.v. iron preparations inhibit differentiation of haematopoietic stem cells to monocytes, but their effect on monocyte differentiation to macrophages and mature dendritic cells (mDCs) has not been assessed. We investigated substance-specific effects of iron sucrose (IS), sodium ferric gluconate (SFG), ferric carboxymaltose (FCM) and iron isomaltoside 1000 (IIM) on monocytic differentiation to M1/M2 macrophages and mDCs.
Via flow cytometry and microRNA (miRNA) expression analysis, we morphologically and functionally characterized monocyte differentiation to M1/M2 macrophages and mDCs after monocyte stimulation with IS, SFG, FCM and IIM (0.133, 0.266 and 0.533 mg/mL, respectively). To assess potential clinical implications, we compared monocytic phagocytosis capacity in dialysis patients who received either 500 mg IS or IIM.
Phenotypically, IS and SFG dysregulated the expression of macrophage (e.g. CD40, CD163) and mDC (e.g. CD1c, CD141) surface markers. Functionally, IS and SFG impaired macrophage phagocytosis capacity. Phenotypic and functional alterations were less pronounced with FCM, and virtually absent with IIM. In miRNA expression analysis of mDCs, IS dysregulated miRNAs such as miR-146b-5p and miR-155-5p, which are linked to Toll-like receptor and mitogen-activated protein kinase signalling pathways. In vivo, IS reduced monocytic phagocytosis capacity within 1 h after infusion, while IIM did not.
This study demonstrates that less stable i.v. iron preparations specifically affect monocyte differentiation towards macrophages and mDCs.
INTRODUCTION
Iron deficiency is a common contributor to anaemia of chronic kidney disease (CKD) [1]. Oral iron preparations often fail to replenish iron stores, at least in advanced CKD patients who have chronic micro-inflammation with subsequently high plasma hepcidin levels. In enterocytes, hepcidin leads to internalization and degradation of the central iron transport protein ferroportin, which impedes intestinal absorption of iron salts after oral intake [2, 3]. In contrast, intravenous (i.v.) iron preparations allow effective administration of high iron doses [4], which are generally considered to be well tolerated [5, 6].
In recent years, the clinical use of i.v. iron preparations has substantially increased [7]. In parallel, awareness of their potential systemic side effects has also increased, which may include renal, cardiovascular and immunologic reactions [8–10].
Several i.v. iron preparations are in clinical use, mostly as iron carbohydrate complexes; these iron preparations vary in their carbohydrate ligands and therefore differ in molecular weight, reactivity, thermodynamic stability and half-life [11–13]. We and others have recently proposed that these various i.v. iron preparations may have different safety profiles [14, 15]. In a previous in vitro study, we found that less stable i.v. iron preparations, such as iron sucrose (IS), induce phenotypical and functional monocytic alterations, which may directly be caused by their low stability and their consecutively accelerated uptake by monocytes [14].
Originating from myeloid precursors, monocytes play a central role physiologically in host defence [16] and pathophysiologically in numerous inflammatory diseases [17]. In both scenarios, via growth factor- and cytokine-induced adhesion and transendothelial migration, circulating monocytes are recruited into tissues, where they differentiate into macrophages and dendritic cells (DCs) [18].
Against this background, we now aimed to investigate the impact of different i.v. iron preparations on recruitment of monocytes from the bloodstream into tissues. We further characterized monocytic differentiation into macrophages and DCs by phenotypical and functional assays as well as by analysing microRNA (miRNA) expression profiles in DCs.
MATERIALS AND METHODS
Subjects
For in vitro experiments, we recruited two groups of study participants: (i) healthy control subjects (four to six subjects per experiment) without overt CKD and (ii) patients with severe CKD on haemodialysis (three patients per experiment) without erythropoietin/erythropoiesis-stimulating agent (ESA)/iron treatment.
For our in vivo experiments, we recruited patients with severe CKD on peritoneal dialysis (four to ten subjects per experiment) with iron deficiency anaemia who received a single infusion of 500 mg i.v. iron [either IS (Venofer, Vifor Pharma, Glattbrugg, Switzerland) or iron isomaltoside 1000 (IIM; MonoFer, Pharmacosmos, Holbæk, Denmark)].
All participants gave informed consent. The study protocol was approved by the local ethics committee and was conducted in accordance with the Declaration of Helsinki.
Iron preparations
The following i.v. iron preparations were used in the present study: IS (Venofer), ferric carboxymaltose (FCM; Ferinject) (both from Vifor Pharma), sodium ferric gluconate (SFG; Ferrlecit, Sanofi-Aventis Deutschland, Frankfurt, Germany) and IIM (MonoFer, Pharmacosmos) in three concentrations: 0.133, 0.266 and 0.533 mg/mL, which in a 90-kg individual corresponds to a pharmacological application of ∼400, ∼800 and ∼1600 mg iron. Furthermore, we used 0.266 mg/mL of iron(II) chloride (FeCl2, Sigma-Aldrich, Taufkirchen, Germany).
Monocyte isolation
Peripheral blood mononuclear cells (PBMCs) were isolated from ethylenediaminetetraacetic acid anticoagulated blood by Ficoll-Paque (Lymphocyte Separation Medium; PAA, Cölbe, Germany) gradient-density centrifugation. For differentiation experiments, PBMCs [1 × 10⁶ PBMCs/cm2 for macrophages or 2.5 × 10⁶ PBMCs/cm2 for mature dendritic cells (mDCs)] were incubated in monocyte attachment medium (Promocell, Heidelberg, Germany) at 37°C. After 1 h, non-adherent cells were washed away with RPMI 1640 (Sigma-Aldrich) and adherent monocytes were used for differentiation. For adhesion and transmigration assays, monocytes were isolated with the pan monocyte isolation kit (Miltenyi Biotec, Bergisch Gladbach, Germany) according to the manufacturer's protocol.
Monocytic adhesion assay
To test monocytic adhesion on endothelial cells, isolated monocytes were stimulated with i.v. iron preparations for 3 h at 37°C (3 × 10⁵ monocytes per condition) and then washed with RPMI 1640. Human umbilical vein endothelial cells (HUVECs) were cultured in endothelial cell media (both from PromoCell) in fibronectin-coated 12-well plates. HUVEC monolayers were washed away with RPMI 1640 before iron-stimulated monocytes were added. After 30 min of incubation, non-adherent monocytes were washed away with RPMI 1640 and the number of adherent monocytes was evaluated by phase contrast microscopy (Biozero BZ-8000, Keyence, Neu-Isenburg, Germany) in 10 microscopic fields per sample.
Monocyte transmigration assay
To analyse monocytic migration potential, isolated monocytes were stimulated with i.v. iron preparations for 3 h at 37°C (5 × 10⁵ monocytes per condition), washed twice in RPMI 1640 and labelled with anti-CD45 antibody (Supplementary data, Table S1) for 1 h at 37°C. Cells were seeded into the upper chamber of Millicell hanging inserts (8 µM pore size; Millipore, Schwalbach, Germany), which were placed in 24-well plates. Lower chambers were filled with RPMI 1640 enriched with 50 ng/mL monocyte chemotactic protein-1 (MCP-1; Biolegend, Fell, Germany). After 60 min at 37°C, the number of transmigrated cells was evaluated by fluorescence microscopy in 10 microscopic fields per sample.
In vitro differentiation of monocytes into mDCs
For mDC differentiation, monocytes were incubated in DC Generation Medium (provided with Cytokine Mix A/B; PromoCell, Heidelberg, Germany), enriched with Cytokine Mix A and supplemented with iron preparations, at 37°C and 5% CO2. The medium was changed after 3 days. On Day 6, Cytokine Mix B was added to induce maturation of DCs; experiments were performed on Day 8.
In vitro differentiation of monocytes into macrophages
Macrophages were generated according to Martinez et al. [19]. Isolated monocytes were incubated in RPMI 1640, enriched with 100 ng/mL macrophage colony-stimulating factor and 20% fetal bovine serum (FBS; Life Technologies, Darmstadt, Germany) and supplemented with iron preparations for 7 days at 37°C and 5% CO2. For polarization into M1/M2 macrophages, cells were incubated for 18 h in RPMI 1640 with 5% FBS, supplemented with iron preparations and 100 ng/mL lipopolysaccharide (LPS) and 20 ng/mL IFN-γ for M1 polarization or with 20 ng/mL IL-4 for M2 polarization (Biolegend). For experiments, macrophages were detached with macrophage detachment solution (PromoCell).
Flow-cytometric analyses
Expression of mDC markers (CD1c, CD141, CD80, CD83, CD86, CD1a, CD40, HLA-DR and HLA-A,B,C) and macrophage markers (CD14, CD16, CD32, CD40, CD64, CD80, CD86, CD163, CD206, CD68, IFN-γR, ICAM-1 and HLA-DR) were quantified by flow cytometry (FACS Canto II with FACSDiva Software; BD Biosciences, Heidelberg, Germany) as median fluorescence intensity (MFI). Cells were stained with the appropriate antibodies (Supplementary data, Table S1) for 15 min at 4°C, washed and fixed with paraformaldehyde (1%) (Sigma-Aldrich). For intracellular measurement of CD68, macrophages were fixed with paraformaldehyde (4%), washed with buffer containing 0.1% saponin (Sigma-Aldrich), stained with anti-CD68 PE for 45 min at room temperature, then washed and fixed with paraformaldehyde (1%).
Monocyte subsets in whole blood from dialysis patients before and after infusion of 500 mg of Venofer or MonoFer were identified by flow cytometry according to our standardized and validated gating strategy [20]. In brief, after staining for CD14, CD16 and CD86 (Supplementary data, Table S1) and lysis, cells were washed and fixed with paraformaldehyde (1%). Using a side scatter/CD86 dot plot, monocytes were detected as CD86-positive cells with monocytic scatter properties. Subsequently, the three monocyte subsets classical, intermediate and non-classical monocytes were gated based on their surface expression pattern of CD14 (LPS receptor) and CD16 (FcγIII receptor).
Iron uptake
For measurement of macrophage iron uptake, cells were incubated with calcein acetoxymethyl ester (Biomol, Hamburg, Germany) in a final concentration of 0.2 µM for 15 min at 4°C, washed and fixed with paraformaldehyde (1%). For in vivo analysis, 150 μL of Li-hep anticoagulated blood was incubated with antibodies against CD14, CD16 and CD86 as well as with calcein acetoxymethyl ester in a final concentration of 0.2 μM.
Calcein fluorescence was quantified flow cytometrically as MFI, based on the ability of iron to bind calcein and to quench its fluorescence.
Phagocytosis assay
The phagocytosis capacity of macrophages was assessed using Fluoresbrite yellow green carboxylate microspheres (0.75 µm, Polysciences, Eppelheim, Germany). Microspheres were opsonized with heterologous serum (adjusted to 108 particles/mL with Krebs-Ringer solution) and gentle shaking for 30 min at 37°C. For in vitro experiments, 20 µL opsonized particles were added to 100 µL of macrophage cell suspension and incubated for 30 min at 37°C with mild shaking. For in vivo analysis, 50 µL opsonized particles were added to 150 µL citrate anticoagulated blood, mixed with 300 µL RPMI 1640 and incubated for 30 min at 37°C with mild shaking and stained with antibodies against CD14, CD16 and CD86 as described above. Phagocytosis capacity was determined flow cytometrically as counts of fluorescein isothiocyanate (FITC)-positive cells.
This protocol considers all microspheres that were either attached to the cell surface or taken up by the cell as phagocytosed, taking into account that phagocytosis involves several processes including binding to the cell surface and subsequent uptake by the cell. Non-specifically adsorbed microspheres were removed by intensively washing cell suspensions in a bovine serum albumin containing washing buffer, with subsequent centrifugation.
miRNA isolation and miRNA expression analysis
Genome-wide miRNA expression analysis in mDCs was performed with small RNA-Seq at GenXPRO as described previously [21]. Briefly, RNA was isolated with the miRNeasy mini kit (Qiagen, Hilden, Germany) according to the manufacturer's protocol. For each condition, samples of three different subjects were pooled. For quantification of miRNA expression, small RNA-Seq libraries were analysed with omiRas [22]. Data processing started with 3′ adaptor clipping by local alignment of the adaptor sequence to each read. Illumina's marked quality region was removed and reads were summarized to UniTags. After singletons were removed, the remaining tags were mapped to human genome (hg19) with bowtie [23] and annotated with various models of coding and non-coding RNAs retrieved from the UCSC Table Browser. Tags mapping to exonic regions of coding genes were excluded and non-coding RNAs were quantified in each library. For tags mapping to multiple genomic loci, the number of reads corresponding to the tag was divided by the number of mapping loci. To account for differences in sequencing depth, tag counts were normalized [tags per million (tpm)] and differential expression was detected with DEGseq bioconductor package [24]. A P-value <10−10 was considered statistically significant.
Statistics
Categorical variables are presented as counts (percentages) and continuous variables as mean ± SEM. Statistical analysis was performed for each iron preparation as indicated using one-way analysis of variance (ANOVA), followed by Dunnett's test as a post hoc test, or paired/unpaired Student's t-test. A P-value <0.05 was considered statistically significant.
RESULTS
Impact of iron preparations on monocytic adhesion and transmigration
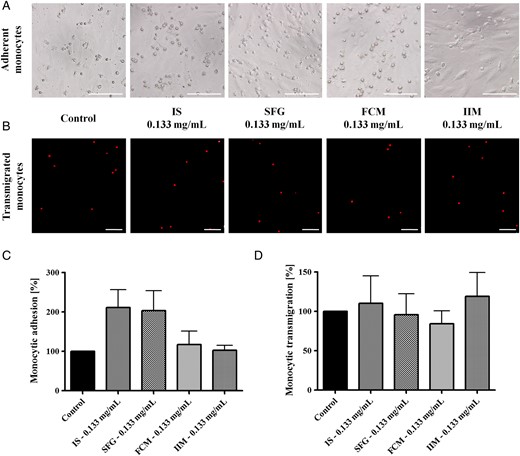
Monocytic adhesion on activated HUVECs and transmigration through 8 µM cell culture inserts (after CD45 labelling and in the presence of 50 ng/mL MCP-1) after stimulation with 0.133 mg/mL IS, SFG, FCM or IIM. Blood was collected from control subjects and evaluated by phase contrast microscopy (adhesion) and by fluorescence microscopy (transmigration). Numerical analyses were evaluated in 10 microscopic fields per approach. Representative examples of (A) monocytic adhesion and (B) transmigration; bar scales 100 µm for all images. Mean ± SEM of four independent experiments for (C) adhesion and (D) transmigration; controls (in the absence of iron) are defined as 100%. Statistical analysis was performed using ANOVA followed by Dunnett's multiple comparison test as post hoc test.
Effect of iron preparations on monocyte differentiation into macrophages
In order to test whether iron preparations affect macrophage differentiation, we in vitro differentiated monocytes into M1 and M2 macrophages under iron stimulation. Macrophages were characterized phenotypically by their expression of specific surface markers [CD68 (M1/M2 marker); CD40, CD64, CD80, CD86 (M1 markers); CD14, CD16, CD32, CD163, CD206 (M2 markers)] and functionally by their phagocytosis capacity.
IS significantly down-regulated the expression of CD40, CD80 and CD86 on M1 macrophages. SFG reduced the expression of these markers as well, albeit to a lesser degree. Likewise, IS and SFG impaired expression of CD68, CD16 and CD206 on M2 macrophages. In contrast, FCM and IIM did not significantly affect expression of M1 and M2 markers. Iron uptake measured by means of a calcein assay showed that all iron preparations were equally taken up by macrophages, accounting for the specific role of macrophages in iron uptake and retention (Table 1).
Expression of CD68 (M1/M2 marker), CD40, CD64, CD80, CD86 (M1 markers), CD14, CD16, CD32, CD163, CD206 (M2 markers) on macrophages and calcein fluorescence intensity of M1/M2 macrophages after in vitro differentiation of monocytes under stimulation with IS, SFG, FCM and IIM
| Control | IS (mg/mL) | SFG (mg/mL) | FCM (mg/mL) | IIM (mg/mL) | |||||||||
|---|---|---|---|---|---|---|---|---|---|---|---|---|---|
| 0.133 | 0.266 | 0.533 | 0.133 | 0.266 | 0.533 | 0.133 | 0.266 | 0.533 | 0.133 | 0.266 | 0.533 | ||
| M1 macrophages | |||||||||||||
| CD68 | 6421 ± 754 | 8932 ± 798 | 9016 ± 770 | 6599 ± 633 | 9194 ± 1066 | 7413 ± 837 | 8675 ± 956 | 6145 ± 1081 | 6716 ± 384 | 6807 ± 438 | 6016 ± 579 | 6601 ± 692 | 7032 ± 539 |
| CD40 | 21 013 ± 2754 | 17 786 ± 1693 | 15 861 ± 1360 | 7122 ± 984** | 16 660 ± 1296 | 12785 ± 1439** | 11241 ± 889** | 16 496 ± 3145 | 18 066 ± 2640 | 16 887 ± 2232 | 19 804 ± 4041 | 19 658 ± 2956 | 20 154 ± 2921 |
| CD64 | 720 ± 92 | 785 ± 71 | 820 ± 59 | 540 ± 42 | 715 ± 58 | 615 ± 74 | 575 ± 50 | 642 ± 61 | 685 ± 64 | 727 ± 81 | 705 ± 122 | 676 ± 88 | 749 ± 96 |
| CD80 | 288 ± 36 | 268 ± 16 | 268 ± 15 | 198 ± 18* | 275 ± 16 | 246 ± 21 | 274 ± 18 | 238 ± 15 | 251 ± 28 | 252 ± 20 | 276 ± 45 | 267 ± 35 | 274 ± 31 |
| CD86 | 898 ± 94 | 742 ± 81 | 744 ± 66 | 454 ± 36* | 699 ± 71 | 640 ± 57 | 523 ± 37 | 742 ± 169 | 810 ± 150 | 746 ± 104 | 960 ± 112 | 901 ± 163 | 848 ± 151 |
| Calcein | 4413 ± 366 | 1595 ± 199** | 1723 ± 214** | 1233 ± 182** | 1407 ± 206** | 1233 ± 131** | 1499 ± 138** | 1385 ± 288** | 1078 ± 91** | 1426 ± 176** | 2136 ± 223** | 2034 ± 253** | 1704 ± 165** |
| M2 macrophages | |||||||||||||
| CD68 | 5031 ± 593 | 7989 ± 796** | 8712 ± 681** | 7472 ± 407* | 8157 ± 842 | 7883 ± 1362 | 8745 ± 1583* | 6361 ± 341 | 5997 ± 754 | 6693 ± 1158 | 5875 ± 468 | 5979 ± 146 | 6447 ± 501 |
| CD14 | 461 ± 294 | 34 ± 6 | 30 ± 7 | 31 ± 10 | 76 ± 31 | 21 ± 5 | 24 ± 3 | 415 ± 230 | 263 ± 149 | 74 ± 26 | 345 ± 213 | 413 ± 229 | 312 ± 182 |
| CD16 | 2073 ± 928 | 333 ± 72* | 272 ± 46* | 259 ± 46* | 429 ± 134 | 362 ± 135* | 373 ± 82 | 2194 ± 904 | 1570 ± 725 | 799 ± 334 | 2027 ± 955 | 2334 ± 1090 | 1620 ± 746 |
| CD32 | 18 849 ± 8129 | 5096 ± 773 | 4435 ± 806 | 4318 ± 717 | 8273 ± 1750 | 5080 ± 883 | 4421 ± 667 | 15 693 ± 5657 | 11 668 ± 4840 | 7847 ± 1957 | 15 349 ± 5999 | 16 057 ± 5522 | 12 808 ± 5142 |
| CD163 | 14 222 ± 7952 | 2280 ± 248 | 2398 ± 243 | 2387 ± 252 | 2620 ± 316 | 2930 ± 507 | 3170 ± 517 | 13 730 ± 5374 | 8016 ± 3015 | 4378 ± 1212 | 11 972 ± 5403 | 14 704 ± 7033 | 9979 ± 4165 |
| CD206 | 6379 ± 700 | 5035 ± 715 | 4675 ± 532 | 3342 ± 469** | 4535 ± 557 | 5044 ± 506 | 3713 ± 228** | 8069 ± 1302 | 6854 ± 1966 | 6292 ± 1397 | 5823 ± 857 | 6450 ± 1212 | 6329 ± 1242 |
| Calcein | 10 248 ± 606 | 2200 ± 192** | 2320 ± 309** | 1461 ± 172** | 1904 ± 219** | 1860 ± 372** | 1775 ± 336** | 2788 ± 251** | 2376 ± 202** | 2287 ± 510** | 2977 ± 293** | 2639 ± 292** | 2109 ± 342** |
Indicated is MFI ± SEM; 4 ≤ n ≤ 6. Significant changes are presented in bold. *P < 0.05, **P < 0.01.
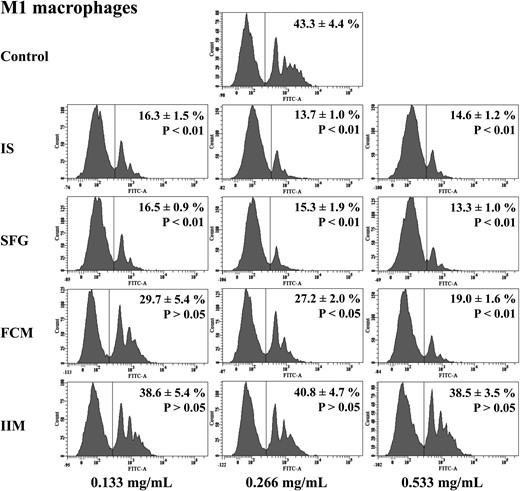
Capacity of M1 macrophages to phagocyte opsonized carboxylate microspheres within 30 min. Macrophages were in vitro differentiated from monocytes under stimulation with three different concentrations (0.133, 0.266 and 0.533 mg/mL) of IS, SFG, FCM or IIM. Blood was collected from control subjects. Counts of FITC-positive cells as phagocytosing macrophages (shown on the right-hand side of each histogram) were determined flow cytometrically. Histograms depict representative examples from a single individual and mean ± SEM of at least five independent experiments. Statistical analysis was performed using ANOVA and the Dunnett's multiple comparison test as a post hoc test.
Impact of iron preparations on monocyte differentiation into mDCs
Next, we tested the effects of i.v. iron preparations on DC differentiation in vitro. Therefore, we differentiated isolated monocytes into mature DCs (mDCs) under iron stimulation and analysed phenotypical characteristics of mDCs (expression of CD1c, CD141, CD80, CD83, CD86, CD1a, CD40 and HLA-DR).
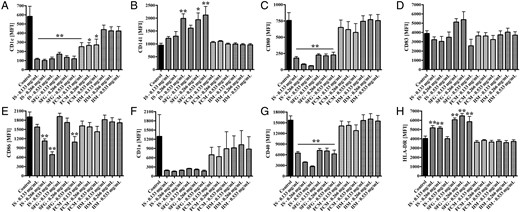
Phenotypical analysis of mDCs that were in vitro differentiated from monocytes under stimulation with IS, SFG, FCM or IIM (0.133, 0.266 and 0.533 mg/mL). Blood was collected from control subjects. Statistical analysis was performed using ANOVA and the Dunnett's multiple comparison test as a post hoc test; data of five independent experiments are presented as mean ± SEM. *P < 0.05, **P < 0.01. Protein expression analysis of mDC surface markers (A) CD1c, (B) CD141, (C) CD80, (D) CD83, (E) CD86, (F) CD1a, (G) CD40 and (H) HLA-DR were measured as MFI by flow cytometry.
Impact of IS and IIM on miRNA expression in mDCs
As miRNAs regulate the expression of genes that are involved in immune system processes and iron homeostasis [25, 26], we further aimed to analyse whether the iron preparations substance-specifically induced changes in miRNA expression. Therefore, we performed ultra-deep miRNA sequencing with pooled small RNAs from mDCs differentiated under control conditions, under stimulation with 0.266 mg/mL IS and with 0.266 mg/mL IIM, thus yielding three independent miRNA expression libraries (‘control’, ‘IS’ and ‘IIM’).
After eliminating low-quality reads and tags that were detected only once, the total number of reads was 21 165 607, which allowed us to analyse 631 different miRNAs across the three libraries (Supplementary data, Table S2). The most differentially expressed miRNAs are listed in Table 2 (control versus IS), Table 3 (control versus IIM) and Supplementary data, Table S3 (IIM versus IS).
miRNA analysis of monocyte-derived mDCs after IS stimulation
| miRNA | Control (tpm) | IS (0.266 mg/mL, tpm) | Log2 (fold change) | P-value |
|---|---|---|---|---|
| hsa-miR-146a-5p | 18 913 | 24 992 | −0.40 | 0 |
| hsa-miR-142-5p | 16 923 | 8986 | 0.91 | 0 |
| hsa-miR-19b-3p | 14 993 | 9102 | 0.72 | 0 |
| hsa-miR-29a-3p | 30 909 | 21 275 | 0.54 | 0 |
| hsa-let-7g-5p | 12 486 | 7140 | 0.81 | 0 |
| hsa-let-7i-5p | 10 423 | 5092 | 1.03 | 0 |
| hsa-miR-23b-3p | 3403 | 455 | 2.90 | 0 |
| hsa-miR-210 | 5033 | 412 | 3.61 | 0 |
| hsa-miR-146b-5p | 30 093 | 16 402 | 0.88 | 0 |
| hsa-miR-103a-3p | 13 309 | 7088 | 0.91 | 0 |
| hsa-miR-21-5p | 421 617 | 523 388 | −0.31 | 0 |
| hsa-miR-155-5p | 30 697 | 7440 | 2.04 | 0 |
| hsa-miR-340-5p | 3013 | 5596 | −0.89 | 8.39 × 10−284 |
| hsa-miR-378c | 1335 | 299 | 2.16 | 1.43 × 10−254 |
| hsa-miR-101-3p | 26 845 | 21 223 | 0.34 | 7.17 × 10−243 |
| hsa-miR-223-3p | 4400 | 7086 | −0.69 | 1.83 × 10−229 |
| hsa-miR-374a-5p | 6200 | 9308 | −0.59 | 1.82 × 10−227 |
| hsa-miR-191-5p | 7835 | 5059 | 0.63 | 2.54 × 10−218 |
| hsa-miR-320a | 1661 | 539 | 1.62 | 6.30 × 10−216 |
| hsa-miR-148b-3p | 2302 | 4205 | −0.87 | 3.98 × 10−204 |
P = 0 for P < 9.99 × 10−307.
miRNA expression analysis of monocyte-derived mDCs after IIM stimulation
| miRNA | Control (tpm) | IIM (0.266 mg/mL, tpm) | Log2 (fold change) | P-value |
|---|---|---|---|---|
| hsa-miR-142-3p | 58 843 | 67 993 | −0.21 | 0 |
| hsa-miR-155-5p | 30 697 | 26 222 | 0.23 | 7.47 × 10−195 |
| hsa-miR-210 | 5033 | 3487 | 0.53 | 1.01 × 10−152 |
| hsa-miR-29a-3p | 30 909 | 27 629 | 0.16 | 9.47 × 10−103 |
| hsa-miR-103a-3p | 13 309 | 11 242 | 0.24 | 7.24 × 10−96 |
| hsa-let-7g-5p | 12 486 | 10 526 | 0.25 | 5.43 × 10−92 |
| hsa-miR-21-5p | 421 617 | 430 105 | −0.03 | 2.18 × 10−80 |
| hsa-miR-146a-5p | 18 913 | 16 694 | 0.18 | 6.74 × 10−77 |
| hsa-miR-27a-3p | 8077 | 9519 | −0.24 | 1.81 × 10−65 |
| hsa-miR-24-3p | 9987 | 11 457 | −0.20 | 3.51 × 10−56 |
| hsa-miR-30e-5p | 14 552 | 16 267 | −0.16 | 1.51 × 10−53 |
| hsa-miR-3676-5p | 53 | 151 | −1.51 | 4.91 × 10⁻²⁸ |
| hsa-miR-101-3p | 26 845 | 28 415 | −0.08 | 3.17 × 10⁻²⁶ |
| hsa-miR-221-3p | 5844 | 5172 | 0.18 | 1.05 × 10⁻²³ |
| hsa-miR-93-3p | 1488 | 1163 | 0.36 | 5.10 × 10⁻²³ |
| hsa-miR-92a-3p | 3370 | 2905 | 0.21 | 3.72 × 10⁻²⁰ |
| hsa-miR-29b-3p | 7721 | 8465 | −0.13 | 4.01 × 10⁻²⁰ |
| hsa-miR-3676-3p | 120 | 226 | −0.91 | 3.71 × 10⁻¹⁹ |
| hsa-miR-25-3p | 1553 | 1257 | 0.31 | 1.89 × 10⁻¹⁸ |
| hsa-miR-7-5p | 937 | 717 | 0.39 | 2.56 × 10⁻¹⁷ |
P = 0 for P < 9.99 × 10−307.
![miRNA expression analysis (small RNA-Seq and omiRas [22]) of mDCs in vitro differentiated from monocytes under stimulation with 0.266 mg/mL IS and IIM. Statistical analysis of miRNA expression was performed with the DEGseq bioconductor package [24]. A P-value <10−10 was considered statistically significant. (A) Presented scatter plots show tpm of 631 analysed miRNAs in IS-stimulated mDCs compared with control approach as well as in IIM-stimulated mDCs compared with control. (B) Presentation of significantly different expressed miRNAs between the three approaches: control, IS and IIM.](https://oup.silverchair-cdn.com/oup/backfile/Content_public/Journal/ndt/31/11/10.1093_ndt_gfw045/2/m_gfw04504.jpeg?Expires=1748019535&Signature=FZPoutJhKPPfdKLNt280LY2IG6oBos9~u1EmteyTim7FOHqt976hYC3HgRIljJjQzqMQ0RAufsOCY-9XHdW38uc3WP-bd4TAyKMKIckDk6kGWYM1pfRLTwa9BXnmCrq2XfNE~WSKTahkLxupKBdaJZySA9yXDYsBZ66eSYTn7B1HyhnVKTbiDpqohSQyIIeCL84N3iGP~BivJ7092lUxfQO-pMmbcrvxmS-ZNECJp57mHfS7d7-N-u6tehGIY4IlEZtPZ~D~w9BXnQNBc8m5n-bLBUaom0HWRx4Jmrrh-PX06P0vbCMrBIE~I4k0bDjMlylyph7olxgTZqbp4jwYZg__&Key-Pair-Id=APKAIE5G5CRDK6RD3PGA)
miRNA expression analysis (small RNA-Seq and omiRas [22]) of mDCs in vitro differentiated from monocytes under stimulation with 0.266 mg/mL IS and IIM. Statistical analysis of miRNA expression was performed with the DEGseq bioconductor package [24]. A P-value <10−10 was considered statistically significant. (A) Presented scatter plots show tpm of 631 analysed miRNAs in IS-stimulated mDCs compared with control approach as well as in IIM-stimulated mDCs compared with control. (B) Presentation of significantly different expressed miRNAs between the three approaches: control, IS and IIM.
In a pathway analysis [27, 28], these 25 miRNAs could be linked to specific cellular pathways, such as the Toll-like receptor signalling pathway, the MAPK signalling pathway and the regulation of cell cycle (e.g. miR-146b-5p, miR-155-5p and miR-26a-5p). In contrast, miRNAs that were specifically dysregulated after IS stimulation, but not after IIM stimulation, could be linked to the chemokine signalling pathway or the Jak-STAT signalling pathway (e.g. miR-126-3p, miR-148b-3p and miR-26b-5p). Finally, we identified several miRNAs differentially expressed after IS stimulation (miR-34c, let-7c, miR-671 and miR-137) that could be linked to appropriate changes in surface protein expression (CD141, HLA-DR and CD83) on IS-stimulated mDCs.
Impact of iron preparations and iron salt on macrophage and DC differentiation of monocytes from CKD patients
To better understand the implications of substance-specific immunologic effects of i.v. iron preparations in the context of CKD, we analysed (i) whether our findings could be transferred from individuals without overt CKD to haemodialysis patients and (ii) whether these observed effects may be mimicked by direct stimulation with the iron salt iron(II) chloride (FeCl2). Thereby, we additionally characterized macrophages by their expression of IFN-γR, ICAM-1, HLA-DR and mDCs by their expression of HLA-A,B,C.
In line with our findings obtained in cells from healthy donors, we found that IS, SFG and—albeit to a lesser extent—FCM strongly down-regulated the expression of CD40, CD64, CD80 and CD86 on M1 macrophages and CD14, CD16, CD32 and CD206 on M2 macrophages, whereas IS and SFG additionally upregulated CD68 expression on M2 macrophages. IIM did not significantly affect expression of M1 and M2 markers. FeCl2 had similar effects as less stable i.v. iron preparations. Furthermore IS, SFG and FeCl2 decreased the expression of ICAM-1 and HLA-DR on M1 and M2 macrophages, whereas FCM had less and IIM no effect (Supplementary data, Table S2).
Additional analyses in these cells collected from haemodialysis patients reconfirmed an iron preparation independent macrophage iron uptake via calcein assay (Supplementary data, Table S2); in functional analysis, IS, SFG, FCM and FeCl2—but not IIM—tended to reduce the phagocytosis capacity of M1 macrophages (Supplementary data, Figure S3).
In the phenotypical characterization of mDCs differentiated from monocytes obtained from haemodialysis patients, we found that IS, SFG, FCM and FeCl2 down-regulated the surface expression of CD1c, CD80, CD1a and CD40, whereas IIM only decreased CD1c expression. Furthermore, FeCl2 and FCM down-regulated the expression of HLA-A,B,C (with FeCl2 also reducing HLA-DR expression), while IS and SFG tended to increase the expression of HLA-A,B,C (Supplementary data, Figure S4).
Impact of IS and IIM on monocyte subsets in vivo
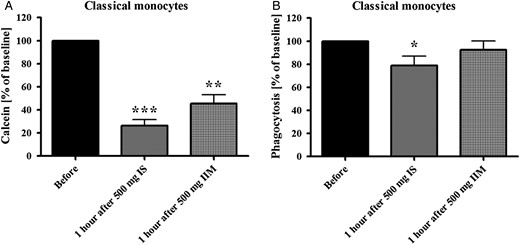
(A) Flow-cytometric calcein assay for the analysis of the iron uptake in classical monocytes. As iron intracellularly binds calcein and quenches its fluorescence, lower fluorescence intensity represents higher iron uptake. (B) Analysis of capacity of classical monocytes to phagocyte opsonized carboxylate microspheres within 30 min. Counts of FITC-positive cells were determined flow cytometrically. Blood was collected from peritoneal dialysis patients before and 1 h after infusion of 500 mg IS or 500 mg IIM. Statistical analysis was performed for each iron preparation using unpaired Student's t-test; controls (in the absence of iron) are defined as 100%. Data of three independent experiments were measured as MFI and presented as percentages of baseline ± SEM. *P < 0.05, **P < 0.01, ***P < 0.001.
DISCUSSION
Anaemia of CKD substantially contributes to extrarenal comorbidity in patients with impaired renal function [29, 30]. Since low haemoglobin predicts adverse outcome among CKD patients [31], anaemia treatment with ESAs had been a cornerstone of nephrological care for two decades. However, after several randomized trials failed to demonstrate a prognostic benefit of ESA treatment in CKD [32–34], the safety of this treatment strategy came into question. This led to significantly reduced prescription rates for ESA since 2008 and a subsequent decrease in mean haemoglobin levels among CKD patients [7], rendering alternative treatment strategies for anaemia of CKD mandatory.
Against this background, the use of iron preparations regained popularity in the last decade [7]. Since there is a broad consensus that oral iron preparations are poorly absorbed least in patients with advanced CKD, current guidelines recommend early application of i.v. iron preparations [35]. With its increasing clinical use, potential toxicological side effects of i.v. iron preparations, which may comprise untoward renal, cardiovascular and immunological reactions [32, 36, 37], gained broad interest in recent years [8–10]. It is still uncertain whether these toxicological side effects are drug-class effects or preparation-specific effects.
We recently investigated the impact of different i.v. iron preparations on monocyte development and biology in vitro and found substance-specific immunological effects. We found that less stable iron preparations such as IS were rapidly taken up by cells and dose-dependently impaired differentiation of haematopoietic stem cells towards monocytes [13]. Moreover, they reduced the phagocytosis capacity of mature monocytes [14].
Of note, innate immune regulation requires a close interplay of monocytes with their macrophage and DC progeny. Monocytes circulate for a few days in the peripheral blood; thereafter, via endothelial attachment and subsequent transendothelial migration, they may be recruited into tissues where they differentiate into macrophages and mDCs [18].
Against this background we aimed to compare the impact of less stable IS and SFG and more stable FCM and IIM i.v. iron preparations on this transition of monocytes into macrophages and mDCs.
In our experiments, we first analysed the two initial steps of differentiation, i.e. monocyte endothelial adhesion and migration. In general, more stable i.v. iron preparations—FCM and IIM—neither affected adhesion nor migration substantially. Instead, less stable i.v. iron preparations—IS and SFG—numerically increased monocytic adhesion, which is in line with recent experimental data from others: Kuo et al. [38] demonstrated that IS increased the expression of intracellular cell adhesion molecule-1 (ICAM-1) and vascular cell adhesion molecule-1 (VCAM-1) in a nuclear factor κB–dependent pathway. The authors underscored the biological impact of their findings in murine models in which IS accelerated early atherogenesis. Kartikasari et al. [39] found that iron loading of endothelial cells and monocytes promotes firm adhesion of human monocytes to the endothelium. In partial disagreement, Oexle et al. [40] reported that iron chloride reduced the IFN-γ inducible mRNA expression of ICAM-1 and HLA-DR and their subsequent protein expression on monocytes. Our macrophage data confirm these observations for macrophages, as FeCl2 and less stable iron preparations reduced ICAM-1 and HLA-DR expression without affecting IFN-γR expression. Interestingly, these inhibitory effects were weaker after FCM stimulation and least pronounced after IIM. In line with these earlier data from Oexle et al. [40], it may be hypothesized that iron may indirectly affect M1/M2 differentiation by inhibiting intracellular IFN-γ signalling pathways.
In vivo, adhesion and transmigration of monocytes is followed by their differentiation into either macrophages or DCs. There is a general consensus that defence against pathogens such as bacteria, protozoa and viruses are mediated by M1 macrophages, whereas M2 macrophages exert anti-inflammatory functions and regulate wound healing [41]. Therefore, we next differentiated monocytes towards classically activated (M1) macrophages, alternatively activated (M2) macrophages or mDCs under stimulation with the different i.v. iron preparations. To characterize M1 and M2 phenotypically, we assessed the expression of central surface markers, such as CD40 and the costimulatory molecules CD80 and CD86 for M1 macrophages, as well as Fcγ receptors CD16 and CD32, scavenger receptor CD163 and mannose receptor CD206 for M2 macrophages. The expression of these surface proteins, which have crucial roles in pathogen recognition, T-cell stimulation and/or phagocytosis [42–44], was reduced by IS and SFG. Likewise, in functional assays, macrophage phagocytosis capacity was substantially reduced after stimulation with IS and SFG, but not with more stable i.v. iron preparations. Comparably, earlier in vitro studies reported a reduced phagocytosis capacity of polymorphonuclear leucocytes and monocytes after IS stimulation [14, 45].
Similarly, we found substance-specific effects of i.v. iron preparations on mDCs: again, less stable preparations—IS, SFG—affected the phenotype of mDCs, as they down-regulated the surface expression of CD1c, CD80, CD83, CD86, CD40 and CD1a and up-regulated CD141 and HLA-DR expression. FCM and IIM have less pronounced effects.
While the existence of macrophage subtypes is generally acknowledged, the definition of DCs—particularly of myeloid mDCs—is less straightforward. It has been suggested that two phenotypically and functionally distinct types of myeloid mDCs may exist in blood and tissues, which have been defined as CD1c+ and CD141+ DCs [46, 47]. These cells are differentiated by a particular pattern of surface proteins: CD80, CD83, CD86, CD40 and CD1a are highly expressed on CD1c+ DCs, but not on CD141+ DCs, which themselves overexpress HLA-DR [48, 49]. Functionally, CD141+ and CD1c+ mDCs differ in their capacity to cross-present antigens to naive T cells, as CD141+ DCs show an increased ability to stimulate CD8+ T cells [48]. Based on our expression analyses, we hypothesize that IS and SFG stimulation may induce major shifts in myeloid DC subtype distribution towards CD141+ DCs when analysing mDCs from healthy volunteers. These shifts were less evident when analysing mDCs from haemodialysis patients, which might be explained by the substantial effects of uraemia on immunological function. However, we admittedly cannot provide firm proof for this hypothesis.
Interestingly, most other immunological effects that have been observed in blood samples collected from healthy volunteers could be reproduced among haemodialysis patients, supporting the robustness of our findings.
To analyse the underlying pathophysiological pathways of the observed immunological effects, we performed genome-wide miRNA expression analysis. miRNAs regulate the expression of many genes implicated in iron uptake, storage and utilization [25].
Interestingly, IS had larger effects on miRNAs than IIM. First, this comprises dysregulation of miRNAs that are linked to surface protein expression [50]. Next, IS down-regulated miR-let-7d, which has central functions in iron absorption and utilization [51], and several miRNAs that are strongly involved in inflammation, comprising miR-32, which is crucial for viral defence [26], miR-132, miR-146 and miR-155, which regulate central inflammatory pathways such as the Toll-like receptor pathway [52].
Of note, several other miRNAs linked to iron uptake and metabolism were dysregulated after stimulation with both IS and IIM, such as miR-320 [53] and miR-210 [54, 55].
Our observations underscore the notion that different i.v. iron preparations may substance-specifically affect functions of mononuclear cells and confer compound-specific side effects, since less stable i.v. iron preparations induced more pronounced immunologic effects. It could be shown earlier that i.v. iron preparations like IS and SFG have the lowest molecular weight and stability and the shortest half-life, which affect the amount and kinetics of free iron release [13, 56]. In contrast, more stable i.v. iron preparations like FCM and IIM release less free iron and are mainly taken up as complex by phagocytosis [57]. These findings are in line with our previous data on monocyte biology [14] and with our present data on immunologic effects induced by FeCl2, illustrating the effects of iron that is not sheltered by a carbohydrate shell.
We assume that these effects result from pharmacokinetic differences between i.v. iron preparations, which differ in their carbohydrate ligands, their structural build-up and therefore in their stability. Collectively, these factors determine ferrokinetics, with more pronounced free iron release from IS and SFG than from FCM and IIM [11, 13, 14].
Our study has several limitations. We deliberately focussed our analysis on myeloid differentiation of monocytes towards M1/M2 macrophages and mDCs and did not analyse further subtypes of DCs or other leucocyte subpopulations. One intention of our in vitro study was to define assays for iron toxicity, which may be applied later in clinical studies; we, therefore, aimed to circumscribe the assays' complexity. Next, we did not use deferiprone or other iron chelators in our calcein assays, which would have allowed quantifying the absolute amount of intracellular labile iron. Instead, we only analysed relative changes in iron uptake after stimulation with different iron preparations. Unfortunately, stimulation with deferiprone induces phenotypic changes in monocyte subsets, which hinders their proper flow-cytometric identification (unpublished data).
As a potential strength of our study, we provide the first human data on potential substance-specific immunological effects after iron treatment with different i.v. preparations, as IS reduced monocytic phagocytosis capacity, while IIM did not. Because of the small number of patients analysed, and the non-randomized study design, these findings need confirmation in adequately designed prospective clinical trials.
In conclusion, our in vitro studies demonstrate that less stable i.v. iron preparations such as IS and SFG have a higher potential to modulate monocytes, macrophages and mDCs than more stable preparations such as FCM and particularly IIM. These findings are of interest, as numerous CKD patients presently receive repeated infusions of less stable iron preparations, which have been associated with a high burden of infectious complications [58]. As a next major step, we feel an imminent need to initiate randomized clinical trials that compare the effects of different i.v. iron preparations on laboratory surrogates of immune regulation, and subsequently on manifest clinical events.
CONFLICT OF INTEREST STATEMENT
Study design, laboratory work and data presentation were performed by the authors. We declare that the results presented in this paper have not been published previously in whole or part, except in abstract format.
ACKNOWLEDGEMENTS
Organizational skills of Marie-Theres Blinn and laboratory assistance of Kathrin Untersteller are deeply appreciated. The study was supported by a grant from Pharmacosmos (Holbæk, Denmark) and HOMFOR (Saarland University Medical Center, Homburg, Germany).
REFERENCES
Author notes
Both authors contributed equally.


Comments
Sir,
We first like to thank Dr. Burckhardt and her colleagues for their kind interest in our recent NDT paper upon different immunological effects of distinct i.v. iron preparations.
We first agree that findings from in vitro study should never uncritically be transferred into clinical practice, since interventional studies are definitely needed to prove the clinical relevance of experimental observations. To meet that aim, we are currently drafting a randomised clinical trial.
Nevertheless, we did our best to design an in vitro study which aimed to mimic in vivo condition as close as possible. We analysed a wide dosage spectrum for i.v. iron compounds, ranging from concentrations that should mimic the injection of low dosages of i.v. iron, which are licensed both for less stable and for more stable preparations, up to concentrations that should mimic the injection of high dosages of i.v. iron, which are licensed only for stable preparations.
Currently, pharmacokinetic knowledge upon the in vivo stability of the different i.v. iron compounds and upon the kinetics of their cellular uptake by macrophages, monocytes and hepatocyte is limited. Moreover, to our best knowledge, no solid data are available on the quantitative contribution of these different cell types to the uptake of i.v. iron compounds. Thus, in our in vitro experiment, incubation time of immune cells with i.v. iron compounds may have exceeded the in vivo plasma half- lives. We are however not aware of any in vitro model which has been validated to reflect in vivo pharmacokinetics of i. v. iron compounds more closely than the model chosen by us.
We agree that our experimental design did not allow us to distinguish the effects induced by iron release from the degraded complexes and those triggered by the intact complexes, and that the dissociation of so-called labile iron may partly contribute to our finding. However, in our opinion, this does minimise not the main message of our study, namely the existence of distinct immunological effects exerted by different i.v. iron compounds. Degradation and cell cellular uptake of i.v. iron compounds, as well as dissociation of "labile iron" occur both in vitro as well as in vivo.
The use of FeCl2 rather than ferric ammonium citrate in our studies followed the Reviewers' suggestions.
Finally, in our clinical trial, we decided to compare a less stable i.v. iron compound and a stable compound, rather than to compare two stable iron compounds, in order to grasp the maximal clinical implications of our in vitro studies. The two compounds compared in our clinical trial are both frequently used in nephrology, and their administration followed the drugs' prescribing information.
In summary, we are positive that our in vitro findings point towards distinct immunological effects of different i.v. iron preparations, which may have substantial clinical implication. We agree with Dr. Burckhardt and her colleagues that interventional trials have to confirm the clinical relevance of our findings before changing therapeutic pathways in nephrology.
Conflict of Interest:
Dr. Heine and Dr. Fell received Research grants from Pharmocosmos.
Susanna Burckhardt and Felix Funk, Global Medical Affairs, Vifor Pharma Ltd., Glattbrugg, Switzerland
We read with interest the study by Fell and colleagues [1], supporting the concept that different intravenous (i.v.) iron preparations interact in a substance-specific way with blood components and, thus, efficacy and tolerability data cannot be extrapolated from one preparation to another. Nevertheless, we would like to mentions several limitations, that make it difficult to assess the clinical relevance of these findings.
The unique, substance-specific properties of each i.v. iron complex are reflected in different maximal recommended iron doses [62.5-125mg for sodium ferric gluconate (SFG), 200-500mg for iron sucrose (IS), 1'000mg for ferric carboxymaltose (FCM), 20mg Fe/kg bodyweight for iron isomaltoside 1000 (IIM)], infusion times (for a 500 mg Fe dose, 3.5h for IS, 6min for FCM, 15min for IIM) and in distinct plasma half-lives (spanning from 1.42h for SFG to 20-23h for IIM) [2,3]. Moreover, the carbohydrate shell of the dextran-based IIM will remain unmodified before the complex is taken up by the mononuclear phagocyte system, whereas carboxymaltose may be degraded by amylase, and the weak ligands sucrose and gluconate will largely dissociate [4].
These remarkable differences among the complexes imply that in vitro experiments carried out with the same iron concentrations and incubation times do not reflect the clinical setting. Moreover, the iron concentrations used by Fell et al. correspond to clinical doses that are significantly higher than the recommended maximal iron dose (ca.500- 2'000mg for a 70kg person), in particular for the weaker complexes SFG and IS. Incubation time for the various assays was also significantly longer than the plasma half-life of some of the studied preparations (from 3h up to 7 days) and the weaker complexes (SFG and IS) will have largely been decomposed. Unexpectedly, some of the observed results (e.g. monocyte adhesion, macrophage iron uptake, phenotypical analysis of mature dendritic cells) were concentration-independent. Thus, these experiments do not allow distinguishing between the effects induced by iron released from the degraded complexes and those triggered by the intact complexes.
Furthermore, the weaker complexes contain larger amounts of labile iron [5], which may also have induced some of the observed effects. In most of the assays, no control or FeCl2 were used to address this important question. However, the appropriate control would have been a soluble iron(III) species, e.g. ferric ammonium citrate, and not FeCl2, an iron(II) salt that will rapidly autoxidize and precipitate under the assay conditions.
Finally, the in vivo experiments are very interesting but comparison of the two stable complexes, FCM and IIM, would have been more suitable. No information is given on the rate of administration of IS and IIM (see above for recommendations in the labels), which most likely was very different, rendering the blood samples collected 1h after the i.v. infusion non-comparable due to the significantly different half-lives of IS and IIM. We conclude, further research is needed to address the important question of the clinically-relevant immunological effects of different i.v. iron preparations.
References 1. Fell LH, Seiler-Mussler S, Sellier AB, Rotter B, Winter P et al. Impact of individual intravenous iron preparations on the differentiation of monocytes towards macrophages and dendritic cells Nephrol. Dial. Transplant. 2016; 0: gfw045v1-45. 2. Macdougall IC, Geisser P. Use of intravenous iron supplementation in chronic kidney disease: an update. Iran J. Kidney Dis. 2013; 7:9-22. 3. Neiser S, Rentsch D, Dippon U, Kappler A, Weidler PG, et al. Physico- chemical properties of the new generation IV iron preparations ferumoxytol, iron isomaltoside 1000 and ferric carboxymaltose. Biometals 2015; 28: 615-635. 4. Koskenkorva-Frank TS, Weiss G, Koppenol WH, Burckhardt S. The complex interplay of iron metabolism, reactive oxygen and reactive nitrogen species: Insights into the potential of different iron therapies to induce oxidative and nitrosative stress. Free Radic Biol Med 2013;65:1174-94. 5. Jahn MR, Andreasen HB, Fuetterer S, Nawroth T, Schuenemann V et al. A comparative study of the physicochemical properties of iron isomaltoside 1000 (Monofer), a new intravenous iron preparation and its clinical implications. Eur J Pharm Biopharm 2011; 78: 480-491.
Conflict of Interest:
Susanna Burckhardt and Felix Funk are employees of Vifor Pharma Ltd.