


Abstract
MicroRNAs (miRNAs) are small noncoding RNAs that regulate gene expression by base-pairing to complementary sites in messenger RNAs (mRNAs). The primary element for site recognition is the seed region (nucleotides 2–8 in the miRNA), but for a minority of sites pairing outside the seed increases efficiency, with the supplementary region (nucleotides 13–16) typically having the greatest impact. However, the structural determinants of effective pairing outside the seed are not fully understood. Here, we use abasic modified nucleotides to disrupt pairing to residues 13 and 14 of miR-34a and measure the effect of this modification compared to wild-type miR-34a on the cellular transcriptome and proteome using RNA-seq and mass spectrometry. We find that a subset of sites with predicted supplementary pairing are affected by miRNA transfection, with up to two-fold decreases in site repression at the mRNA level. We show that miR-34a 3′-pairing is sensitive to GU wobble pairs in a position-specific manner and favors bulges in the miRNA over the target. These results were validated with luciferase reporter assays. Overall, this study demonstrates a novel methodological approach for elucidating the role of specific miRNA residues in target site selection, advancing our understanding of miRNA-mediated gene regulation.

Introduction
MicroRNAs (miRNAs) are short noncoding RNAs (around 22 nucleotides), which regulate gene expression through base-pairing to complementary sites in messenger RNAs (mRNAs). MiRNAs bind Argonaute (Ago) proteins to form the RNA-induced silencing complex (RISC). Binding of a miRNA to an mRNA target site typically results in lowered expression of the gene product, either by translational repression or mRNA degradation. Some Ago proteins are catalytically active and can cleave target sites with high sequence complementarity [1], but this is not thought to be the primary mechanism of action in human cells [2, 3]. More than half of human mRNAs contain at least one conserved predicted binding site for a miRNA, usually located in the 3′ untranslated region (3′-UTR) [4], suggesting widespread regulatory impact.
The primary element of target site recognition for animal miRNAs is the seed region, which comprises nucleotides 2–8 of the guide RNA (referred to as g2–g8) [5, 6]. MiRNAs with the same seed region are grouped into families and share a subset of their target genes [3]. Pairing to the seed initiates the interaction between a miRNA and a binding site [7, 8] and is frequently sufficient for target gene downregulation [9]. However, in some cases pairing to miRNA residues outside the seed (referred to here as 3′-pairing) can substantially increase the degree of repression mediated by the target site [10–12]. The g12–g17 residues of the miRNA has been recognized as the most consequential region outside the seed for site efficiency [12] and binding affinity [13]. Crystal structures of target-RISC complexes show that the binding to the seed induces a conformational change in Ago, exposing residues g13–g16 to enable additional pairing [14, 15].
The sequence determinants and functional impact of pairing beyond the seed has previously been studied by transcriptomics [12], crosslinking immunoprecipitation [16, 17], and high-throughput binding assays [18, 19]. However, the association of RISC with an mRNA as determined by crosslinking does not always represent a functional binding site [20, 21] and in vitro assays to measure binding strength do not provide any direct information about the relative abilities of sites to downregulate target genes in the cell.
Furthermore, the impact of 3′-pairing is not independent of other factors affecting target site efficiency. For example, downregulation of a target gene is affected by the structural accessibility of the miRNA binding site within the mRNA [22–24] and 3′-pairing can compensate for less accessible seed-binding sites, allowing repression of target sites which would otherwise be nonfunctional [25]. Consequently, the most influential 3′-pairing sites cannot necessarily be inferred solely from examining the most strongly repressed genes in a transcriptomics dataset. Due to the above factors, it is still not fully understood how large the specific effect of 3′-pairing on miRNA-mediated gene regulation in cells can be, nor what fraction of predicted 3′-pairing sites are functional in vivo.
Here, we modify the conserved miR-34a with abasic nucleotides to remove the possibility of base pairing to residues g13–g14 and thus limit the impact of pairing beyond the seed. This approach surgically disrupts pairing to a specific region of the miRNA without introducing new pairing possibilities, enabling us to assess the impact of the modified nucleotides on the degree of repression of target genes. We measured the effect of the modified miR-34a relative to the wild-type form on the transcriptome and proteome of HEK293T cells using RNA-sequencing (RNA-seq) and tandem mass tag (TMT) mass spectrometry (MS). Comparing the relative impacts of wild-type and modified miR-34a on mRNA expression 24 h after transfection, we find an up to two-fold decrease in downregulation of several genes with target sites for which predicted wild-type pairing outside the seed is disrupted by the modifications. The impact of the modifications on protein expression 48 h after transfection was smaller, although largely correlated with the same structural features. We found that miR-34a 3′-pairing is sensitive to GU wobble pairs in a position-specific manner and favors bulges in the miRNA over the target, confirming a recent biophysical study [26]. Our results demonstrate that abasic modifications of miRNAs is a simple and promising approach for resolving the impact of specific miRNA nucleotides on regulation of gene expression.
Materials and methods
Cell culture
HEK293T cells (ATCC) were cultured in Dulbecco’s modified essential medium (DMEM; Gibco) supplemented with 10% fetal bovine serum (FBS; Gibco). The cells were tested for mycoplasma contamination (Mycoplasmacheck, Eurofins), and were mycoplasma-free.
Preparation of RNA oligos
The wild-type miR-34a guide strand (miR-34a-WT) (5′-UGGCA GUGUC UUAGC UGGUU GU), modified guide strand (miR-34a-RS) (5′-UGGCA GUGUC UU/rS/rS/C UGGUU GU, where /rS/ designates an rSpacer abasic residue) and passenger strand (5′-CAAUC AGCAA GUAUA CUGCC CU) were purchased from Integrated DNA Technologies (IDT), resuspended in nuclease-free duplex buffer (30 mM HEPES, pH 7.5; 100 mM potassium acetate) (IDT, #11-01-03-01) and annealed by heating to 95°C for 2 min followed by incubation at room temperature. Guide strands were ordered with 5′-phosphorylation. AllStars Negative Control siRNA was ordered from Qiagen (#1027280).
Plasmid cloning
For dual luciferase reporter assays, plasmids were cloned carrying different target sites for miR-34a or a scrambled control site. The target sites were cloned into a psiCHECK2 vector between the XhoI and NotI restriction sites, as previously described in [25]. Correct insertions were verified by Sanger sequencing (LightRun, Eurofins). The psiCHECK2 vector was a gift from J. Weidhaas (Addgene plasmid #78258; RRID:Addgene_78258). Sequences of all cloned target sites are listed in Supplementary Table S1.
Luciferase reporter assays
HEK293T cells were seeded in 24-well plates coated with poly-L-lysine (Sigma–Aldrich, P5899). At 80–90% confluency after 24 h incubation, cells were transfected with either 0.8 μg plasmid and 30 nM miR-34a-WT or miR-34a-RS duplex, or 0.8 μg plasmid and either 30 nM AllStars negative control or water as control (as indicated in figure legends), using Lipofectamine 2000 (Invitrogen) in Opti-MEM (Gibco) according to the manufacturer’s protocol. Samples were incubated for 24 h. Cells were then washed once with 0.1 ml phosphate-buffered saline (PBS) and luciferase activity was measured with the Dual Luciferase Reporter Assay System (Promega, E1910) according to the manufacturer’s protocol. The measurements were made on a Promega GloMax 96 luminometer with 1 s delay and 10 s integration time. For each sample, the signal from Renilla luciferase (carrying the miR target site) was divided by the signal from Firefly luciferase to obtain the R/F ratio. For each plasmid, the R/F ratio of the sample transfected with a miRNA (wild-type or mutant) was normalized to the R/F ratio of the control sample (water or AllStars control siRNA, as indicated in the respective figure legends). Raw and processed data from luciferase assays are included in Supplementary File 1.
Sample collection for RNA-seq and proteomics
HEK293T cells were seeded on six-well plates coated with poly-L-lysine (Sigma–Aldrich, P5899) at a density of ∼400 000 cells per well, in 2.5 ml DMEM supplemented with 10% FBS. Two plates were seeded from the same cell suspension for each replicate: one for RNA-seq and one for mass spectrometry, with a total of five replicates per condition. There was a total of five experimental replicates per condition, seeded on different days. After 24 h, cells were supplied with 2.5 ml fresh media (same as above) and transfected with either miR-34a-WT, miR-34a-RS or AllStars negative control. Each well was transfected with 9 μl oligo stock solution (10 μM) and 7 μl Lipofectamine RNAiMAX (Invitrogen) in 484 μl Opti-MEM (Gibco), resulting in a final oligo concentration of 30 nM. Samples for RNA-seq were collected 24 h post-transfection and samples for mass spectrometry 48 h post-transfection. The medium was aspirated, and the cells washed with PBS, followed by addition of 1 ml TrypLE (Gibco) and 5 min incubation at 37°C. The detached cells were transferred to tubes containing 4 ml DMEM and spun down at 200 × g for 4 min. The cell pellets were resuspended in 1 ml PBS and spun down again. The cell pellets were resuspended a second time in 1 ml PBS, transferred to 1.5 ml Eppendorf tubes, and spun down in a microcentrifuge. The PBS was aspirated, and the dry cell pellets were immediately snap-frozen on dry ice and transferred to −80°C storage.
RNA-seq
Total RNA was isolated from frozen cell samples with the GeneJET RNA Purification Kit (Thermo Scientific, K0731). After RNA isolation, possible residual genomic DNA was removed with the RapidOut DNA Removal Kit (Thermo Scientific, K2981). The quality of the isolated RNA was checked on an Agilent 2100 BioAnalyzer with the RNA 6000 Nano Kit. RNA integrity numbers were between 9.3 and 10. Sequencing libraries were prepared with the TruSeq RNA Sample Preparation v2 kit (Illumina, RS-122-2001/RS-122-2002), according to the manufacturer’s protocol. The quality of the complementary DNA libraries was checked on the BioAnalyzer with the DNA 1000 Kit. The libraries were sequenced on an Illumina NextSeq 550 with a NextSeq 500/550 High Output Kit v2.5 (Illumina, 20024906) (single reads, 75 cycles). The RNA-seq data have been deposited in NCBI’s Gene Expression Omnibus and are accessible through GEO Series accession number GSE271495 (https://www.ncbi.nlm.nih.gov/geo/query/acc.cgi?acc=GSE271495).
Analysis of RNA-seq data
Raw reads were aligned to the Ensembl reference genome (GRCh38) with STAR (version 2.7.11a) [27]. One sample (transfected with miR-34a-RS) was excluded from subsequent analysis due to high amounts of ribosomal RNA, confirmed by SortMeRNA [28]. The average number of reads across all samples uniquely mapped to exonic regions was 31 106 898 (minimum 22 275 133; maximum 36 367 271). Reads mapped to gene exons were counted with featureCounts (subread package, version 2.0.3) [29] and differential gene expression analysis was carried out with edgeR (version 3.42.4) [30]. Processed RNA-seq data are presented in Supplementary File 2.
Mass spectrometry
Protein samples were lysed in 4% SDS lysis buffer and prepared for mass spectrometry analysis using a modified version of the SP3 protein clean-up and digestion protocol [31]. Peptides were labelled with TMT16-plex reagent (Thermo Scientific) according to the manufacturer’s protocol and separated by immobilized pH gradient–isoelectric focusing (IPG–IEF) on 3–10 strips as previously described [32]. Extracted peptide fractions from the IPG-IEF were separated using an online 3000 RSLCnano system coupled to a Thermo Scientific Q Exactive-HF. Mass spectrometry spectra were matched to the UniProt Homo sapiens database with MSGF + and Percolator on the Galaxy platform [33]. Differential gene expression analysis was performed with DEqMS [34]. The mass spectrometry proteomics data have been deposited to the ProteomeXchange Consortium via the PRIDE partner repository with the dataset identifier PXD059550 (https://www.ebi.ac.uk/pride/archive/projects/PXD059550). Processed proteomics data are presented in Supplementary File 2.
Prediction of miRNA binding sites
The RNA-seq dataset comprised 13 740 Ensembl Gene IDs listed as protein-coding, while the mass spectrometry dataset comprised 10 139 UniProt IDs (SwissProt/TrEMBL) of which 8742 could be unambiguously mapped to an Ensembl Gene ID, based on mappings downloaded from Ensembl BioMart. We obtained differential gene expression data on both the mRNA and protein levels for 8628 genes. For prediction of miRNA binding sites, we used representative transcript sequences from the TargetScan database [20]. For Gene IDs with no transcript in the TargetScan database, we used the canonical Ensembl transcript sequence (Ensembl Genes 112, GRCh38.p14). The 3′-UTR sequences were searched for the presence of canonical seed-binding sites (8mer, 7mer-m8, 7mer-a1, and 6mer) for miR-34a.
RNA structure predictions
Modules from the ViennaRNA package [35] were used for predictions. We predicted the minimum free energy (MFE) structure (disallowing lone pairs) of each target–miRNA pair and the structure of the seed-only complex with RNAsubopt. Pairing to the first base of the miRNA was disallowed as this residue does not participate in base pairing interactions [36, 37]. We then calculated the difference in binding energy between the MFE and seed-only structures for each target–miRNA pair and predicted the full set of suboptimal structures within this energy range with RNAsubopt. The set of predicted structures for each target-miR complex was then analyzed with respect to the number of pairs in the 3′-pairing helix, the offset between the seed and the 3′-pairing helices (defined as the difference in the number of unpaired nucleotides between the seed and 3′-pairing helices on the miRNA and target sides of the complex), the presence of GU wobble pairs and the presence of mismatches within the 3′-pairing helix. The MFE structure meeting a certain set of constraints was chosen as the representative structure of a target–miRNA pair, with the constraints varied according to the purpose of the analysis (e.g. allowing or disallowing GU pairs). Structures featuring self-pairing within the target or miRNA were excluded from the analysis.
Results
MiR-34a with abasic modifications distinguishes sites with and without 3′-pairing
The binding of miRNAs to their mRNA target sites is primarily mediated by the seed region, which comprises nucleotides g2–g8 of the miRNA (numbered from the 5′-end, with the g prefix standing for guide) (Fig. 1A). The canonical seed-binding sites, which feature full complementarity to residues g2–g7 of the miRNA, are thought to mediate most of the regulatory impact of miRNAs [12]. These are typically divided into the following four types, in ascending order of average efficiency: 6mer (complementarity to g2–g7), 7mer-A1 (complementarity to g2–g7 with an adenosine opposite g1), 7mer-m8 (complementarity to g2–g8), and 8mer (complementarity to g2–g8 with an adenosine opposite g1) (Fig. 1A).
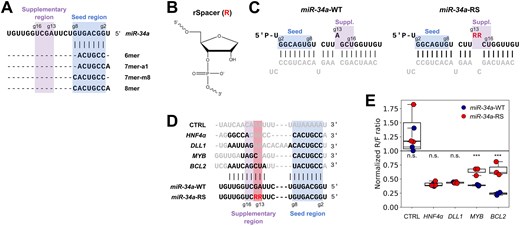
MiR-34a with abasic modifications distinguishes sites with and without 3′-pairing. (A) Binding regions and canonical seed-binding types of miR-34a. (B) The rSpacer abasic nucleotide modification. (C) Wild-type and modified miR-34a duplexes used for transfections. The guide strand is shown in black and the passenger strand in gray. Modified residues are in red. R denotes an rSpacer residue. (D) Sequences of four miR-34a target sites, with varying amounts of supplementary pairing, and a scrambled control. Nucleotides in black are predicted to pair with the miRNA. (E) MiR-34a regulation of dual luciferase reporters after 24 h with the target sites in panel (D), transfected into HEK293T cells. Each datapoint represents an independent experiment (n = 3). Results are normalized to a water control. (n.s. = not significant, *** P < .005. Significance testing was performed by independent two-sided t-test.)
Pairing to the supplementary region of the miRNA, comprising residues g13–g16, is generally the most consequential form of 3′-pairing [12], and we have previously shown this to be the case for miR-34a in particular [25]. We designed a miR-34a mutant in which residues g13A and g14G were replaced by rSpacer abasic (RS) nucleotides (Fig. 1B), which are unable to form base pairs to the target sites of the mRNA. This allowed us to disrupt all potential pairing to two consecutive residues in the supplementary region while minimally affecting the stability of the guide-passenger duplex, to which only a single additional mismatch was introduced. From here, we will refer to the wild-type miRNA as miR-34a-WT and the modified variant as miR-34a-RS (Fig. 1C).
In order to test the effects of these modifications in the miRNA on its capacity to bind and downregulate its targets, we cloned dual luciferase reporter plasmids carrying previously validated miR-34a target sites from BCL2 apoptosis regulator (BCL2) [38], MYB proto-oncogene (MYB) [39], hepatocyte nuclear factor 4 alpha (HNF4α) [40], and delta-like canonical Notch ligand 1 (DLL1) [41]. The four sites feature varying amounts of potential pairing to the supplementary region, and should consequently respond differently to miR-34a-RS (Fig. 1D). The plasmids were co-transfected with either miR-34a-WT or miR-34a-RS duplex in HEK293T cells to determine the repression of the target sites after 24 h, in three independent experiments. The two target sites with no predicted pairing to g13 or g14, DLL1 and HNF4α, were equally strongly repressed by miR-34a-WT and miR-34a-RS (Fig. 1E), and thus insensitive to the abasic modifications. By contrast, MYB and BCL2, both of which are able to form substantial pairing outside the seed involving at least one of the two modified residues, were significantly less repressed by miR-34a-RS, indicating that inability of the modified miRNA to form these putative base pairs impacts site efficiency, as predicted. These results demonstrate that the abasic modifcations we introduced in the sequence of miR-34a specifically disrupt pairing outside the seed region without notably affecting the overall capacity of the miRNA to repress its target genes, enabling high-throughput screening of sites for effective 3′-pairing.
Effects of miR-34a transfection on the cellular transcriptome and proteome
In order to identify which miR-34a target sites are affected by supplementary pairing to g13–g14, and the extent to which removing this pairing impacts the amount of repression of the gene product, we next compared the effects of excess amounts of miR-34a-WT and miR-34a-RS on the global transcriptome and proteome in HEK293T cells. To this end, cells were transfected with either miR-34a-WT, miR-34a-RS, or a control siRNA, followed by collection of total cellular RNA after 24 h and protein at 48 h (Fig. 2A). Differential gene expression between the conditions was then assessed by bulk RNA-seq and TMT mass spectrometry. Five experimental replicates were included for each condition (seeded on different days), although one sample transfected with miR-34a-RS had to be excluded from the transcriptomic analysis due to ribosomal RNA contamination.
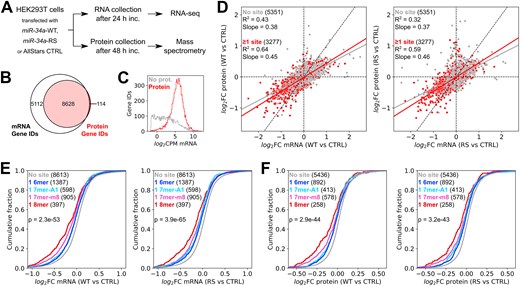
Effects of miR-34a transfection on the cellular transcriptome. (A) Schematic workflow of the experiment. (B) Overlap of Gene IDs present in the RNA-seq and mass spectrometry datasets. (C) mRNA expression levels in log2 counts per million of Gene ID records in the RNA-seq dataset with and without a matching record in the mass spectrometry dataset. (D) Correlation between changes in gene expression at the mRNA and protein levels in HEK293T cells transfected with miR-34a-WT (left panel) or miR-34a-RS (right panel), relative to a negative control. (E) Response at the mRNA level of genes with one canonical seed-binding site to wild-type and modified miR-34a, relative to a negative control. (F) Response at the protein level of genes with one canonical seed-binding site to wild-type and modified miR-34a, relative to a negative control. Significance testing in panels (E) and (F) was performed by one-way analysis of variance (ANOVA).
The transcriptomic dataset comprised 13 740 Ensembl Gene IDs listed as protein-coding, while the proteomic dataset comprised 10 139 UniProt IDs of which 8742 could be unambiguously mapped to an Ensembl Gene ID. If a UniProt ID mapped to more than one Gene ID, or if multiple UniProt IDs mapped to a single Gene ID, they were excluded from downstream analyses. We obtained differential gene expression data on both the mRNA and protein levels for 8628 genes (Fig. 2B). Genes present in the RNA-seq dataset with no matching record in the mass spectrometry dataset were predominantly transcripts with comparatively low expression levels (Fig. 2C).
As expected, there were significant changes in mRNA and protein levels relative to the negative control after transfecting miR-34a-WT or miR-34a-RS. The correlation between changes in mRNA and protein expression was stronger for genes whose 3′-UTRs contain one or more canonical seed-binding site for miR-34a (R2= 0.64 for miR-34a-WT, R2= 0.59 for miR-34a-RS) than for genes with no site (R2= 0.43 for miR-34a-WT, R2= 0.32 for miR-34a-RS) (Fig. 2D). The strength of the correlation is consistent with prior experiments comparing global changes in mRNA and protein expression following miRNA perturbation in cultured cells [42]. The magnitude of fold changes on the protein level were generally smaller than on the mRNA level, as shown by the slope of the regression lines (Fig. 2D).
Both variants repressed genes with a canonical seed-binding site more than genes with no site at both the mRNA and protein levels (Fig. 2E). Consistent with prior data [12], 8mer sites were most strongly repressed, followed by 7mer-m8 sites. Notably, there was little difference in efficiency between 7mer-A1 and 6mer sites for either miR-34a variant. Overall, transfection of miR-34a-WT and miR-34a-RS had similar effects on the transcriptome and proteome, demonstrating that the modified variant behaves like a functional miRNA despite the nucleotide modifications in the supplementary region.
MiR-34a-RS specifically affects target sites with supplementary pairing
We next investigated the impact of supplementary pairing on site repression, by examining the differential impact on the transcriptome and proteome of miR-34a-WT and miR-34a-RS. There was a strong correlation between the impact of miR-34a-WT and miR-34a-RS relative to the control on mRNA and protein expression for genes with one or more canonical seed-binding site (R2= 0.86 for mRNA, R2= 0.89 for protein) and genes with no site (R2= 0.84 for mRNA, R2= 0.82 for protein) (Fig. 3A). The slopes of the regression lines for mRNA and protein (0.86 and 0.93, respectively, for genes with one or more target site) indicate that miR-34a-RS generally has a slightly weaker effect than the wild-type, possibly reflecting less efficient loading into Ago. However, the strong correlation suggests that the relative effect is similar for most genes, implying that the majority of target genes are not specifically affected by disruption of pairing to g13 and g14.
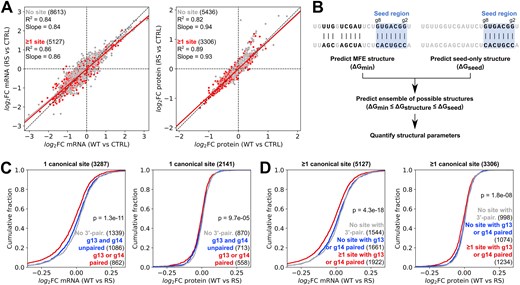
MiR-34a-RS specifically affects target sites with supplementary pairing. (A) Correlation between changes in mRNA expression (left panel) or protein expression (right panel) in HEK293T cells after transfection of miR-34a-WT or miR-34a-RS. (B) Outline of the miRNA–target structure prediction pipeline. (C, D) Differential response of target genes with predicted pairing to g13 or g14, pairing to other miRNA residues outside the seed, or no 3′-pairing. (Significance testing was done by one-way ANOVA.)
To analyze the impact of the modified miRNA on repression of target sites, we designed a structure prediction pipeline to assess possible pairing outside the seed for a given target–miRNA pair (Fig. 3B). We first predicted the MFE structure of the target-miR complex, including any 3′-pairing, and the structure of the seed-only complex with RNAsubopt from the ViennaRNA package [35]. Pairing to residue g1 was disallowed in the predictions as this residue does not participate in base pairing interactions [36, 37] and consequently is not expected to affect the binding energy in a predictable manner. After this, we calculated the difference in binding energy between the MFE and seed-only structures and predicted the full set of suboptimal structures within this energy range with RNAsubopt. The differences in predicted binding energy between the MFE and seed-only structures ranged from 0 to 21.1 kcal/mol, while the number of predicted structures varied between 1 and 22 757.
The set of predicted structures for each target-miR complex was then analyzed with respect to the number of pairs in the 3′-pairing helix, the offset between the seed and the 3′-pairing helices (defined as the difference in the number of unpaired nucleotides between the seed and 3′-pairing helices on the miRNA and target sides of the complex), the presence of GU wobble pairs and the presence of mismatches within the 3′-pairing helix. The MFE structure meeting a certain set of constraints could then be chosen for each target–miRNA pair, allowing us to assess the impact of different structural parameters on site repression. Structures featuring self-pairing within the target or miRNA were excluded from the analysis, as the former does not contribute to the target–miRNA intermolecular binding energy, and the latter is prohibited by the Ago protein in RISC.
To validate that the nucleotide modifications in miR-34a-RS had the predicted effect on targeting, we first tested whether sites with some degree of potential pairing to the modified g13 or g14 residues were differentially affected by miR-34a-RS relative to miR-34a-WT in the dataset as a whole. For genes with a single seed-binding site, we used a two-step prediction approach in which sites were first tested for potential pairing to g13, g14, or both (with a minimal 3′-pairing defined as three contiguous Watson–Crick base pairs and an offset of ±4 nucleotides between the seed and 3′-pairing helices). If no structure with such 3′-pairing was present in the ensemble, sites were tested for 3′-pairing not involving g13 or g14.
We found that sites with at least one pair to the g13–g14 region were significantly more affected by the RS modification than sites with 3′-pairing to other miRNA residues, or no predicted 3′-pairing at all, at both the mRNA and protein level, although the differential effect on protein expression was notably smaller (Fig. 3C, statistical analysis in Supplementary Fig. S1A). No significant difference was seen between sites with 3′-pairing not involving g13 or g14 and sites with no 3′-pairing. When we carried out the same analysis on the set of genes with one or more canonical sites, and found that genes with at least one site with pairing to g13 or g14 were more affected by the RS modification than genes with no such site (Fig. 3D, statistical analysis in Supplementary Fig. S1B). Overall, these results demonstrate that compared to the wild-type, miR-34a-RS disproportionately affects sites with potential pairing to the modified residues in the miRNA, particularly at the transcriptomic level, enabling us to investigate and compare the structural properties of affected and nonaffected binding sites.
Characteristics of consequential miR-34a 3′-pairing
To understand the 3′-pairing preferences of miR-34a, we analyzed the target sites in the genes most affected by the RS modification. We focused on genes significantly downregulated by miR-34a-WT (adj. P < .05). Compared to miR-34a-RS, miR-34a-WT conferred stronger repression by ∼15% or more for 78 genes (log2 fold change < −0.25, adj. P < .05) and by ∼30% or more for 21 genes (log2 fold change < −0.5, adj. P < .05) (Fig. 4A and B, left panels). Changes in protein repression were smaller: only 12 genes had a log2 fold change < −0.25 (miR-34a-WT relative to miR-34a-RS, adj. P < .05) (Fig. 4A and B, right panels). Although the magnitude of the effect of supplementary pairing differed at the mRNA and protein levels, the correlation between changes at the two levels were moderately strong (Fig. 4C). Nevertheless, it is clear that a large decrease in mRNA repression caused by removal of supplementary pairing is not consistently linked to a comparable decrease in protein repression.
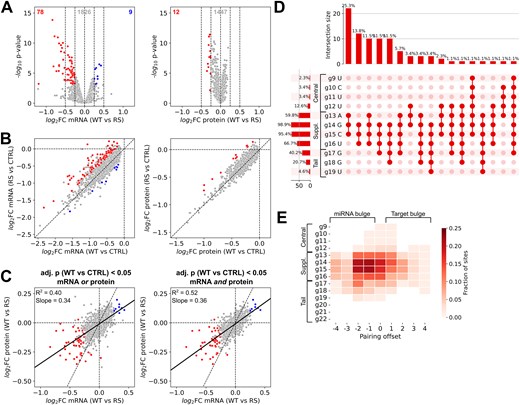
Characteristics of consequential miR-34a 3′-pairing. (A) Response of miR-34a target genes to miR-34a-WT, relative to miR-34a-RS. Genes with log2 fold changes above 0.25 or below −0.25 with an adj. P-value < 0.05 are marked as significantly upregulated or downregulated. Numbers at the top indicate the number of genes in each category. (B) Correlation between changes in mRNA and protein expression of the genes in panel (A) after transfection of miR-34a-WT or miR-34a-RS. (C) Correlation between responses of miR-34a target genes to miR-34a-WT relative to miR-34a-RS at the mRNA and protein levels. (D) Upset plot of predicted binding in miR-34a target sites on genes in red in panels (A) and (B). Horizontal bars show the percentage of 3′-pairing sites in which each miR-34a residue is paired, vertical bars show the frequency of each range of paired residues. (E) Fraction of 3′-pairing offsets for each miR-34a residue outside the seed in the same structure predictions as panel (D). Negative offsets indicate bulges on the miRNA side, positive offsets indicate bulges on the target side.
To identify structural features correlated with effective 3′-pairing, we analyzed the 85 genes more repressed by miR-34a-WT relative to miR-34a-RS with a log2 fold cutoff of −0.25, at either the mRNA and protein level. Using the structure prediction pipeline described above, we assessed these genes for the predicted presence of at least three contiguous canonical Watson–Crick pairs, including at least one pair to the g13–g14 region, with a maximum offset of ±4. Out of 155 canonical sites, 87 had a possible structure with 3′-pairing matching these criteria (56%), with 66 of 85 genes (78%) having at least one such target site.
The majority of these 87 sites featured pairing to three or more residues in the supplementary region (g13–g16) (95%) (Fig. 4D). Of the two modified residues in miR-34a-RS, pairing to g14 was present in nearly all sites (99%), while g13 was paired in a bit over half the sites (60%), suggesting that the latter is less consequential for miR-34a targeting (Fig. 4D). Outside of the supplementary region, residues g17 (40%) and g18 (21%) were most frequently paired, and pairing to the tail region of the miRNA (g17–g22) was more common than pairing to the central region (g9–g12). This possibly reflects the greater potential contribution to helical stability of GC pairs to positions g17 and g18 of miR-34a compared to AU pairs to positions g11 and g12. Considering the position of 3′-pairing relative to the seed, we found that most structures were either symmetrical (zero offset) or slightly bulged on the miRNA side (negative offset) (Fig. 4E). The most frequently paired nucleotide, g14, was bound to target residues 12–13 (numbered from the 3′-end) in 44% of the predicted structures, compared to 22% for residues 15–16. This indicates that targets which pair to miR-34a with bulges on the miRNA side are particularly sensitive to removing g13–g14 pairing capacity.
Additionally, we were interested in the effect of the RS modification on previously characterized miR-34a target genes. To this end, we examined validated target genes from MiRTarBase [43]. There were 81 validated miR-34a target genes present in our RNA-seq dataset, of which 44 were also present in the mass spectrometry dataset. The correlation between changes in mRNA and protein levels after transfection with miR-34a-WT, relative to a negative control, was higher for the 44 validated targets than for the full set of predicted targets (R2= 0.90, Supplementary Fig. S2A, cf. Fig. 2D), likely reflecting a lower proportion of false positives. Supplementary Fig. S2B and C show the differential response of the validated target genes to miR-34a-WT and miR-34a-RS, with genes from Figs 1E and 4A highlighted, at the RNA and protein level, respectively.
GU wobble pairs to residue g14 of miR-34a are unfavorable
As the response of different predicted 3′-pairing sites to the modified miR-34a varied, we wanted to identify structural features of target–miRNA complexes that are especially sensitive to supplementary pairing. As above, we predicted structures with at least three contiguous pairs, including at least one pair to the g13–g14 region, with a maximum offset of ±4. Again, we analyzed genes which were significantly downregulated by miR-34a-WT (adj. P < .05) but this time we limited our analysis to genes with one target site, in order to isolate the impact of particular features of sites.
GU wobble pairs are strongly disfavored in the seed helix of target–miRNA complexes [12]. In the supplementary region, canonical Watson–Crick base-pairs are generally preferred [11], but it is not clear if all wobble pairs are equally unfavorable. Although the binding strength of a GU base pair is similar to an AU base pair, they distort the shape of A-form RNA helices [44] and consequently their impact may vary depending on the structural context. We predicted target-miR structures with the same constraints as above but allowed for GU pairing in the supplementary region (g13–g16), which for miR-34a contains two possible GU pairs (to g14 and g16). At the mRNA level, wobble pairing to g14G, which is possible for miR-34a-WT but not miR-34a-RS, did not improve repression compared to sites without any predicted 3′-pairing (Fig. 5A, left panel, statistical analysis in Supplementary Fig. S3A). Sites with GU pairs to both g14 and g16 had a similar distribution as sites with GU pairing to g14 alone. By contrast, repression of sites with a wobble pair to g16U were compromised by miR-34a-RS to a similar extent as sites with only canonical Watson–Crick base pairs in the 3′-pairing helix, suggesting wobble pairing to g16U is well tolerated and can improve repression efficiency compared to sites without any predicted 3′-pairing. However, these differences were not clearly observed in the proteomics data (Fig. 5A, right panel, statistical analysis in Supplementary Fig. S3A).
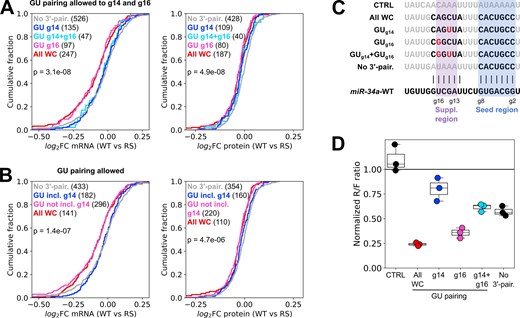
GU wobble pairs to residue g14 of miR-34a are unfavorable. (A, B) Differential mRNA and protein response to the RS modification for sites with different numbers of GU wobble pairs in the supplementary region. GU pairs were allowed only in the supplementary region (A) or anywhere in the miRNA–target complex (B). (C) Sequences of designed target sites with varying GU pairing in the supplementary region. Nucleotides in black are predicted to pair with the miRNA. (D) MiR-34a regulation of dual luciferase reporters after 24 h with the target sites in panel (C), transfected into HEK293T cells. Each datapoint in the luciferase plot represents an independent experiment (n = 3). Results are normalized to an AllStars negative control siRNA, same as the RNA-seq data. The analysis in panels (A) and (B) was performed on genes which were significantly downregulated by miR-34a-WT relative to the negative control (adj. P < .05). Significance testing between groups was done by one-way ANOVA.
We next predicted structures allowing GU pairs at any position in miR-34a outside the seed, and found that at the mRNA level sites with predicted GU pairs to miR-34a residues other than g14 were similarly affected by the RS modification as sites with no predicted GU pairing (Fig. 5B, left panel, statistical analysis in Supplementary Fig. S3B). On the other hand, sites with a GU pair at g14 behaved like sites without 3′-pairing regardless of the presence or absence of GU pairing to other miRNA residues, indicating that a GU pair at g14 is detrimental to effective pairing to the supplementary region. Again, the results were less pronounced at the protein level, although sites with a predicted GU pair at g14 were somewhat less affected by the RS modification than genes with GU pairs elsewhere or no GU pairs at all (Fig. 5B, right panel, statistical analysis in Supplementary Fig. S3B).
To orthogonally validate our finding that g14 and g16 may differ in their sensitivity to GU wobbles, we designed luciferase reporter plasmids carrying target sites with either full canonical g12–g17 pairing or GU wobble pairs to g14, g16 or both, as well as a seed-only target (Fig. 5C). In agreement with our findings from the transcriptomic analysis, sites with a GU pair to g14 did not mediate more repression than the seed by itself, regardless of whether g16 formed a canonical pair or not (Fig. 5D). By contrast, a g16 GU pair by itself resulted in a moderate decrease in repression compared to full canonical pairing, but substantially improved repression compared to seed-only repression, or a structure with GU wobbles at both g14 and g16. These results demonstrate that the impact of GU pairs on 3′-pairing efficiency varies with the position in the miRNA, with wobble pairs to g14 being specifically disfavored by miR-34a.
MiR-34a is more efficient with miRNA bulges than with target bulges
Finally, we investigated the impact of the offset between the seed and 3′-pairing helices, defined as difference between the number of unpaired miRNA and target nucleotides bridging the two helices. Negative and positive offsets represent bulges on the miRNA and target sides of the complex, respectively, while a zero offset represents a structure in which the miRNA and target residues are perfectly aligned. For genes significantly downregulated by miR-34a-WT (adj. P < .05) with a single canonical seed-binding site, we predicted structures with at least three contiguous canonical Watson–Crick pairs, including at least one pair to the g13–g14 region, with a maximum offset of ±4.
The results were consistent with the earlier observation (Fig. 4E) that miR-34a prefers bulges on the miRNA side over the target side, also seen by Sweetapple et al. [26]. Target sites with negative offsets behaved similarly to those with zero offset and were markedly more downregulated by miR-34a-WT relative to miR-34a-RS at both the mRNA and protein levels (Fig. 6A, statistical analysis in Supplementary Fig. S4A). By contrast, sites with positive offsets, as a group, were essentially indistinguishable from sites with no 3′-pairing at all. Consistent with previous observations (Fig. 4E), offsets between −2 and 0 were most strongly favoured (Fig. 6B).
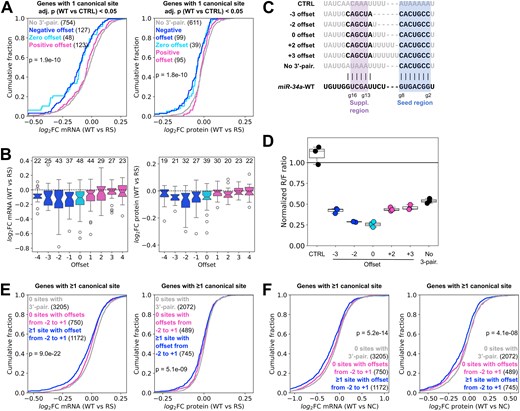
MiR-34a is more efficient with miRNA bulges than with target bulges. (A) Differential mRNA and protein response to the RS modification for sites with negative, zero or positive offsets between the seed and 3′-pairing helices. (B) Response to the RS modification of sites with different offsets, for the same predicted structures as in panel (A). The numbers above the boxes indicate the number of sites. (C) Sequences of designed target sites with varying offsets. Nucleotides in black are predicted to pair with the miRNA. (D) MiR-34a regulation of the target sites in panel (C), assessed with dual luciferase reporters after 24 h in HEK293T cells. (E) Response to the RS modification of genes with one or more sites with predicted offsets between −2 and 1, compared to genes with no such sites or no predicted 3′-pairing sites at all. (F) Response to miR-34a-WT relative to a negative control for the groups in panel (E). Each datapoint in the luciferase plot represents an independent experiment (n = 3). Results are normalized to an AllStars negative control siRNA, same as the RNA-seq data. Significance testing between groups in panels (A), (E), and (F) was performed by one-way ANOVA.
We validated this finding with luciferase reporter assays, using artificial target sites with full 12–17 pairing and offsets of −3, −2, 0, +2, and +3 (Fig. 6C). We found that sites with offsets of −2 or 0 were strongly downregulated, to roughly the same degree, but that the other offsets only mediated slightly more repression than a site without 3′-pairing (Fig. 6D). This confirms that single nucleotide differences in bulge sizes within a target-miR complex can substantially impact the contribution of 3′-pairing to the overall degree of downregulation.
Because sites with offsets of −3, +2, and +3 were only slightly more downregulated than a seed-only site in the luciferase assay (Fig. 6D), while those with offsets between −2 and +1 were most strongly affected by the abasic modifications at g13 and g14 (Figs 4D and 6B), we hypothesized that this range of offsets is ideal for miR-34a 3′-pairing. To test this hypothesis, we used a two-step prediction approach for all genes with one or more canonical miR-34a target sites. We first tested each site for the ability to bind miR-34a with offsets between −2 and +1, then for the possibility of binding with other offsets in the −4 to +4 range (as above). Genes were then divided into three groups: genes with one or more sites with offsets in the −2 to +1 range, genes with other 3′-pairing sites, and genes with no predicted 3′-pairing at all.
We found that genes with one or more sites with offsets from −2 to +1 were significantly more downregulated by miR-34a-WT than miR-34a-RS at both the mRNA and protein levels, suggesting that they are sensitive to the disruption of g13–g14 pairing (Fig. 6E, statistical analysis in Supplementary Fig. S4B). By contrast, genes with sites forming miRNA–target complexes with other offsets were comparable to genes for which no sites featured predicted 3′-pairing. This is consistent with the hypothesis that structures with offsets in the −2 to +1 range are especially favorable for effective miR-34a 3′-pairing. Notably, genes with at least one such site were generally more strongly downregulated by miR-34a-WT relative to a negative control than other genes, most notably the mRNA level, suggesting that the predicted 3′-pairing also confers greater gene repression overall (Fig. 6F, statistical analysis in Supplementary Fig. S4C).
Discussion
While the importance of miRNA pairing outside the seed for certain target sites is recognized, identifying the precise structural determinants for effective 3′-pairing is challenging. Here, we compared the effects on the transcriptome and proteome of HEK293T cells of transfecting miR-34a in either its wild-type form or with abasic modifications at positions g13 and g14, disrupting pairing to the most consequential binding region outside the seed of this miRNA [25]. We found that several genes with potential 3′-pairing were more weakly repressed by the modified miRNA at the mRNA level at 24 h after transfection. Analysis of predicted 3′-pairing patterns in differentially regulated target sites revealed that miR-34a has pairing preferences that are distinct from those established for certain other miRNAs [19]. These findings were validated with designed target sites in luciferase reporter assays.
Structural determinants of effective pairing beyond the seed
We found that GU wobble pairs to the guanidine at position g14 in miR-34a are highly unfavorable. At the mRNA level, such sites behaved indistinguishably from sites without possible supplementary pairing regardless of the presence or absence of GU pairs at other positions. When g14 formed a canonical base pair, GU pairs elsewhere were tolerated. This was also supported by luciferase reporter assays, where sites with GU pairing to g14 achieved seed-only downregulation at best, while a site with GU pairing to g16 was more strongly repressed, although still less than a site with the same number of canonical base pairs. This shows that the impact of GU pairs depends on the position in the miRNA, likely related to steric constraints imposed by the interaction with Ago or the RNA structural environment.
Crystal structures of RISC in complex with target RNAs show that binding to the seed causes a conformational shift in the protein and miRNA, resulting in stacking of residues g12–g16 in a A-form helix [14, 15]. This region has consequently been hypothesized to play a crucial role in the nucleation of the 3′-pairing helix [3, 14], which may be the reason why wobble pairs distorting the geometry of the helix are especially deleterious there. We note that miR-34a contains a guanidine at g14 and a uridine at g16; it is not known if the relative impact of wobble pairs to these bases would be different if the orientation of the pair was reversed (e.g. if a target guanidine paired to a uridine at g14).
For miR-34a sites affected by disrupted pairing to g13–g14, we found a clear preference of miRNA-side bulges (negative 3′-pairing offset) over target-side bulges (positive offset), consistent with the findings of Sweetapple et al. [26]. In particular, offsets from –2 to 0 were favored. This finding was further supported by luciferase assays using designed target sites with variable offsets, indicating that it is not an artefact resulting from the structural properties of the abasic modification itself. A prior study employing high-throughput binding assays to characterize effective miRNA 3′-pairing hypothesized that some miRNAs display two distinct binding modes depending on the starting position of the 3′-pairing helix [19]. For pairing starting at position 12, offsets of 0 or +1 were found to be optimal (the zero-offset mode), while offsets greater than +1 were preferred when pairing started at positions 10 or 11 (the positive-offset mode). Our results indicate that predicted miR-34a 3′-pairing mostly starting at positions 12–14 (with a small number of sites starting at 9–11), reflecting the proposed zero-offset binding mode, prefers small offsets of −2 and −1 over +1, although some sites with offsets of +1 or more are affected by the disruption of g13–g14 pairing. This finding underlines the miRNA-specific nature of 3′-pairing preferences, raising the question of whether particular miRNA sequence features confer a preference for one type of offset over the other.
Of the two residues modified in our miR-34a-RS construct, g14 was more frequently involved in consequential 3′-pairing than g13. We also observed that the 3′-pairing helix more often extended into the tail region than the central region, which likely reflects the greater potential binding energy of the G residues at positions g17 and g18 compared to the U residues at g11 and g12. Notably, a recent study of factors affecting the kinetics of RISC-mediated slicing of bound targets found that the importance of pairing to the miRNA beyond g16 increases with decreasing binding strength in the central region [45]. It is interesting to note that let-7a has two G residues at positions g11 and g12 in the central region but an A and a U at positions g17 and g18. Consequently, thermodynamically favorable binding outside the seed is shifted towards the central region in let-7a and towards the tail region in miR-34a. In light of the apparent differences in the impact of target and miRNA bulges discussed above, this raises the question of whether differences in binding strength of regions outside the seed could affect offset preferences as well as slicing kinetics.
For miR-34a, prediction of 3′-pairing sites with three or more contiguous canonical Watson–Crick basepairs and offsets in a range from −2 to +1 was sufficient to account for most of the response to the abasic modifications (Fig. 6E and F). This is not to say that miR-34a 3′-pairing sites with other properties are never effective, but for purposes of predicting effective pairing outside the seed, offsets in this range might be assigned a higher probability of being functional. Unfortunately, it is not straightforward to determine the ideal range of each individual miRNA, unless offset preferences can be mechanistically tied to some feature of miRNA sequences. It should also be noted that the changes in gene expression observed upon disrupting pairing to g13 and g14 does not necessarily reflect all the effects of pairing outside the seed of miR-34a, as pairing to other residues may be consequential in some cases.
Finally, we note that the effects on targeting of abasic miRNA modification may depend on which Ago paralog loads the miRNA. In humans, there are four Ago paralogs which mostly load similar populations of miRNAs [46]. The paralogs have structural differences which affect their targeting and catalytic capacity (reviewed in [47]). We thus cannot rule out that the determinants of 3′-pairing elucidated here may differ between cell types depending on their Ago paralog distribution. However, a prior study demonstrated that AGO2 has a larger effect on miRNA-mediated regulation in HEK293T cells than other paralogs [48]. In the light of this, we can reasonably suppose that the majority of the observed effects of the disruption of 3′-pairing in our study stems from altering the behavior of the miR-34a:AGO2 complex.
Differential impact of 3′-pairing on mRNA and protein expression
One striking finding of our study was that the changes in mRNA expression caused by disruption of miR-34a supplementary pairing typically did not result in equivalent changes in protein expression (measured 24 h later). The correlation between mRNA and protein changes was moderately strong (Fig. 4C) and the preference for negative offsets was observed at both levels (Fig. 6A and B), suggesting that the changes are not completely unlinked. Nevertheless, the differential impact of miR-34a-WT relative to miR-34a-RS was notably smaller at the protein level than at the mRNA level.
In the absence of Ago-catalyzed slicing, which is not a common mode of regulation in human cells [3], miRNAs cause gene repression via a combination of translational repression and mRNA degradation, which can be mediated by independent pathways (reviewed in [2]). Speculatively, some of the response to miR-34a transfection observed at the protein level may be caused by translational repression mechanisms not directly linked to mRNA degradation. If effective pairing outside the seed serves to stabilize the target–miRNA interaction, allowing time for the mRNA degradation pathway to operate, this could result in the observed partial unlinking of the responses to disruption of supplementary pairing at the mRNA and protein levels. Still, even in this scenario it would be expected that decreased translation due to lower mRNA levels would eventually result in a more proportionate overall response to the RS modification at the protein level.
Overall, the fold changes observed for miR-34a-WT relative to miR-34a-RS, reflecting the impact of disrupting supplementary pairing, were modest, raising questions about the potential physiological relevance of 3′-pairing. The same question has been debated about miRNAs in general, as the degree of repression they confer, even when overexpressed, is frequently within the functional concentration range of the target gene product (see [3] and references therein). It is important to note that measurements at a single time point do not necessarily capture the full magnitude of expression changes for a given gene, as the half-lives of proteins vary considerably. Physiologically relevant effects of a miRNA acting on a target gene, and consequently the impact of 3′-pairing, may depend on the kinetics of the interaction as well as the absolute repression achieved. This would have to be evaluated individually for miRNA–target pairs of interest. Finally, we note that further experiments which directly measure the impact of 3′-pairing on miRNA-mediated repression in cells will be necessary to get a more complete picture.
Concluding remarks
Our results demonstrate that abasic nucleotide modification is a viable approach for high-throughput screening of miRNA pairing preferences in cells. Comparison of our findings with prior studies supports the idea that the nature of optimal 3′-pairing is to some extent specific to each miRNA, indicating that new approaches are required to better understand the molecular mechanisms involved in the binding process.
Acknowledgements
Mass spectrometry analysis was performed by the Clinical Proteomics Mass Spectrometry facility, Karolinska Institutet/Karolinska University Hospital/Science for Life Laboratory. The computations for RNA-seq data analysis were enabled by resources in project NAISS 2023/22-1083 provided by the National Academic Infrastructure for Supercomputing in Sweden (NAISS) at UPPMAX, funded by the Swedish Research Council through grant agreement no. 2022-06725. We thank Dr Björn Högberg and Dr Anna Teixeira for use of the Illumina NextSeq 550 and Dr Igor Baars for assistance with sequencing runs. We thank members of the Andersson and Petzold labs for discussion.
Author contributions: David M. Kosek (Conceptualization, Formal analysis, Investigation, Methodology, Software, Validation, Visualization, Writing—original draft, Writing—review & editing), Katja Petzold (Conceptualization, Formal analysis, Funding acquisition, Investigation, Project administration, Resources, Supervision, Writing—review & editing), Emma R. Andersson (Conceptualization, Formal analysis, Funding acquisition, Investigation, Project administration, Resources, Supervision, Writing—review & editing)
Supplementary data
Supplementary data is available at NAR online.
Conflict of interest
None declared.
Funding
This work was supported by a Knut and Alice Wallenberg Foundation collaborative project grant (KAW 2016.0087, to K.P. and E.R.A.). K.P. further acknowledges support from Karolinska Institutet (KI Career Ladder positions), Cancerfonden (21 1770 Pj), and Stiftelsen för Strategisk Forskning (SSF FFL15-0178). E.R.A. further acknowledges support from Karolinska Institutet (KI Career Ladder positions). Funding to pay the Open Access publication charges for this article was provided by Knut and Alice Wallenberg Foundation (grant no. KAW 2016.0087).
Data availability
Raw data from luciferase assays are presented in Supplementary File 1. The RNA-seq data have been deposited in NCBI’s Gene Expression Omnibus and are accessible through GEO Series accession number GSE271495 (https://www.ncbi.nlm.nih.gov/geo/query/acc.cgi?acc=GSE271495). The mass spectrometry proteomics data have been deposited to the ProteomeXchange Consortium via the PRIDE partner repository with the dataset identifier PXD059550 (https://www.ebi.ac.uk/pride/archive/projects/PXD059550). Processed data are presented in Supplementary File 2. Analysis code is available on Zenodo: https://doi.org/10.5281/zenodo.14884019.

Comments