


Abstract
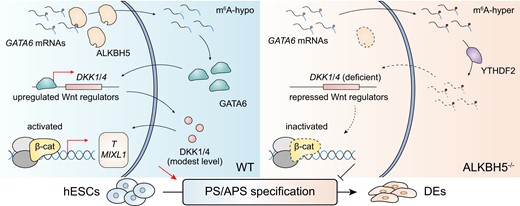
N6-methyladenonsine (m6A) is ubiquitously distributed in mammalian mRNA. However, the precise involvement of m6A in early development has yet to be fully elucidated. Here, we report that deletion of the m6A demethylase ALKBH5 in human embryonic stem cells (hESCs) severely impairs definitive endoderm (DE) differentiation. ALKBH5−/− hESCs fail to undergo the primitive streak (PS) intermediate transition that precedes endoderm specification. Mechanistically, we show that ALKBH5 deficiency induces m6A hypermethylation around the 3′ untranslated region (3′UTR) of GATA6 transcripts and destabilizes GATA6 mRNA in a YTHDF2-dependent manner. Moreover, GATA6 binds to the promoters of critical regulatory genes involved in Wnt/β-catenin signaling transduction, including the canonical Wnt antagonist DKK1 and DKK4, which are unexpectedly repressed upon the dysregulation of GATA6 mRNA metabolism. Remarkably, DKK1 and DKK4 both exhibit a pleiotropic effect in modulating the Wnt/β-catenin cascade and guard the endogenous signaling activation underlying DE formation as potential downstream targets of the ALKBH5-GATA6 regulation. Here, we unravel a role of ALKBH5 in human endoderm formation in vitro by modulating the canonical Wnt signaling logic through the previously unrecognized functions of DKK1/4, thus capturing a more comprehensive role of m6A in early human embryogenesis.
Introduction
The reversible mRNA modification m6A is mediated by a METTL3/METTL14 heterodimer (1), removed by FTO and ALKBH5 (2,3), and recognized by its readers, such as YTH domain and IGF2BP proteins (4,5), to regulate post-transcriptionally gene activity (6). These m6A effectors have been implicated in cellular processes during development and pathological conditions (6–8). However, distinct functions of m6A effectors in many biological processes need to be carefully interpreted due to the context-complexities, such as external stimuli, localization of the effectors and especially cell-type-specific responses(9).
ALKBH5 is a recently discovered m6A demethylase3. Unlike the better-known demethylase FTO, ALKBH5 has no catalytic activity towards N6-2′-O-dimethyladenosine (m6Am) (10). Interestingly, ALKBH5 seems to be dispensable for normal development because its knockout or KO mice are normal in development and physiology, except for a mild defect in spermatogenesis (3). In contrast, ALKBH5 dysregulation has been reported in diverse disease contexts, such as glioblastoma, pancreatic cancer, breast cancer, diabetes and reproductive system diseases (11). It was not until several years ago that broad interest in the biological functions of ALKBH5 resurged in stem cell fields, such as cardiac lineage commitment of hESCs (12), pancreatic differentiation and islet organogenesis (13) and hematopoietic stem cell self-renewal (14,15). Nevertheless, the advance in the understanding of ALKBH5 functions during early embryonic development still lags far behind that of the other m6A effectors, even including FTO (6). It requires more investigations to systematically dissect the biological significance of ALKBH5 in ontogenesis and early cell fate decisions.
The commitment of the DE germ layer during gastrulation is one of the most representative events in early cell fate specification (16,17). In mouse embryogenesis, the pluripotent epiblast cells (E5.5) ingress through the primitive streak and subsequently undergo an epithelial-to-mesenchymal transition (EMT) to become mesoderm or definitive endoderm (E7.0–7.5), which is a prerequisite for further differentiating into mature endodermal organs, including the thyroid, thymus, lungs, liver and pancreas (18,19). In the past few years, multiple hESC-based differentiation methods towards DE have been stably established (20–23), which furnish feasible and tunable platforms for investigating early human embryogenesis and development in vitro. Moreover, prompted by the booming of gene-editing strategies and high-throughput analyses, DE formation has been well-characterized to be orchestrated by the crosstalk of specific transcription factors, epigenetic regulators and signaling pathways (23). Although functional studies of the SMAD2/3 interactome and mutation assessments via base editors have reported the relationship between human endoderm differentiation and loss of m6A modification (24,25), it still lacks evidence to explain the biological significance of m6A hypermethylation state in human early endoderm fate. Until now, there are few mechanistic links connecting m6A-demethylase activities to DE differentiation.
Here, we report that ALKBH5 is required for DE formation in an in vitro human ESC model. Specifically, GATA6 mRNA acts as a potential target of ALKBH5, being destabilized by the m6A reader YTHDF2 underlying PS specification. We further demonstrate that ALKBH5 deficiency suppresses the proper expression level of DKK1 and DKK4 through the aberrant GATA6 mRNA degradation, thereby disrupting the Wnt/β-catenin signaling pathway and underlying the developmental defects. Together, our data support the notion that the ALKBH5–GATA6–DKK1/DKK4–Wnt/β–catenin regulatory pathway modulates human in vitro DE induction, and we propose that the distinct role of m6A regulators in early human embryogenesis should be analyzed in greater detail with the available hESC/iPSC models.
Materials and methods
Cell culture
Human ESC (hESC) lines H9 and their derivate knockout cell lines were maintained in mTeSR1 (STEMCELL Technologies, 85850) on Matrigel (Corning, 354230)-coated plates. hESCs were from Wi Cell and provided from Guangzhou Institute of Biomedicine and Health (GIBH). Human embryonic kidney 293T (HEK293T) cells were cultured in Dulbecco's modified Eagle's medium (DMEM)/high glucose (Hyclone, SH30243.01) supplemented with 10% fetal bovine serum (FBS) (NATOCOR), 1% GlutaMax (Invitrogen, 35050061), 1% nonessential amino acids (NEAA, Invitrogen, 11140050) and 1× penicillin/streptomycin (Thermo Fisher Scientific, 15140122). HEK293T were from ATCC. All cells were maintained at 37°C and 5% CO2.
Generation of knockout cell lines
For depletion of ALKBH5 and DKK4, the corresponding sgRNAs were designed online (https://crispr.cos.uni-heidelberg.de) to target their first exons and inserted into the plasmid pX330. The knockout strategy for them was based on homologous recombination as previously described (26). The right arm and left homologous arm fused with designed stop codons for ALKBH5 and DKK4 were amplified from the genomic DNA of wild-type H9 hESCs via PCR and inserted into the donor plasmids. A PGK-puromycin cassette flanked by LoxP sequences located between the insertion sites of left and right homologous arms. After constructed, hESCs were electroporated with 4 μg donor-plasmids and 4 μg sgRNA-plasmids for ALKBH5 and DKK4, respectively. Then the electroporated hESCs were seeded onto Matrigel-coated plates with the treatment of Y-27632 (10 μM, TargetMol, T1725) for 1 day. Positive clones were selected with 1μg/ml puromycin (Gibco, A1113803) in mTeSR1. The knockout of GATA6 and DKK1 were based on lentiviral infection and non-homologous end-joining (NHEJ). The corresponding sgRNAs of GATA6 and DKK1 were designed online (https://crispr.cos.uni-heidelberg.de) to target their first exons and inserted into the lentiviral plasmid LentiCas9-v2. The sgRNA-containing lentiviruses were produced in HEK293T cells using polyethylenimine (PEI, Proteintech, B600070)-mediated transfection. hESCs were introduced with lentiviruses expressing sgRNAs towards the corresponding genes and the negative control sgNT. The infected cells were selected with 2 μg/ml puromycin (Gibco, A1113803). The identification for knockout cell lines was performed by genotyping or western blot analysis. All primer sequences for the indicated sgRNAs and homologous arms were listed at Supplementary Table S1.
Commercial trilineage differentiation from hESCs
To initially assess the ability of WT and the established hESC to differentiate into the three germ layers: ectoderm, mesoderm, and endoderm, we performed parallel and specialized induction assays using the STEMdiff™ Trilineage Differentiation Kit (STEMCELL Technologies, 05230). Cells were feeding daily with lineage-specific medium and were collected for further identification at the endpoint of each assay. All experiments were performed with three independent replicates.
Chemically defined neuroectoderm differentiation from hESCs
WT and ALKBH5−/− hESCs at 95–100% cell confluence were seeded onto Matrigel-coated 12-well plates in mTeSR1 medium. We initiated neurodifferentiation the next day and cultured the cells in N2B27 medium (50% DMEM/F12 medium (Gibco, 10565018), 50% neurobasal medium (Gibco, 21103049), 0.5% N2 (Gibco, 17502048), 1% B27 (Gibco, 17504044), 1% nonessential amino acids (NEAA, Invitrogen, 11140050), 1% GlutaMax (Invitrogen, 35050061), 5 μg/ml insulin (Selleck, S6955), 1 μg/ml heparin (Sigma, H3149)) supplemented with 5 μM SB431542 (Selleck, S1067) and 5 μM dorsomorphin (Selleck, S7840). The medium was changed every 2 days. After 8 days of induction, the cells were sampled for further identification. All experiments were performed with three independent replicates.
Chemically defined mesoderm differentiation from hESCs
To initiate early mesoderm differentiation, cells were cultured in RPMI-B27 medium (RPMI1640 (Gibco, C11875500BT), 2% B27 (Gibco, 17504044)) supplemented with 100 ng/ml Activin A (Peprotech, 120-14) and 10 ng/ml BMP4 (R&D Systems, 314-BP-500) for 3 days. The medium was changed every day. After 3-day induction, the cells were collected for further identification. All experiments were performed with three independent replicates.
Chemically defined DE differentiation from hESCs
To initiate DE differentiation, hESCs were cultured for 3 days in RPMI1640 (Gibco, C11875500BT)/B27 (Insulin minus, Gibco, A1895601) medium supplemented with 100 ng/ml Activin A (Peprotech, 120-14) on Matrigel (Corning, 354230)-coated plates (21). These cells were collected at different timepoint for further experiments according to the corresponding experimental designs. In the Chir99021-rescued DE differentiation, hESCs were treated with 3 μM Chir99021 for the first 24 h under our DE differentiation strategy. All experiments were performed with three independent replicates.
Genotyping for knockout cell lines
Genomic DNA of wild-type H9 and its derivate knockout cells was extracted with TIANamp Genomic DNA Kit (Tiangen, DP304-03) for PCR identification. Phanta Max Master Mix (Vazyme, P525-03) were used in all PCR reactions. Primer set of each gene including F1 and R1 was used to amplify a 2.5–3.5 kb product for identifying the targeted integration. Primer set of each gene including F2 and R2 was used to amplify a 2.1–3.0 kb product for identifying whether random integration occurred. All primer sequences were listed in Supplementary Table S1.
Flow cytometry analysis
Cells were dissociated with Accutase (STEMCELL Technologies, 7920) for 8 min at 37°C and fixed with 4% paraformaldehyde for 20 min at RT. After washed twice, the cell samples were blocked and permeabilized using PBS (Gibco, C10010500BT) supplemented with 10% FBS (NATOCOR) and 0.3% Trition X-100 for 20 min at 4°C. After washed twice, cells were incubated with primary antibodies and isotype controls for 30 min at 37°C. After washed, cells were incubated with secondary antibodies for 30 min at 37°C. The cells were washed twice and then analyzed using the CytoFLEX flow cytometer (BD Biosciences). All experiments were performed with three independent replicates. All antibodies used in this analysis were listed in Supplementary Table S2.
RNA extraction and quantitative real-time (qRT)-PCR
Total RNA was isolated utilizing FastPure Cell/Tissue Total RNA Isolation Kit V2 (Vazyme, RC112-01) according to the manufacturer's instructions and quantified by Multiskan SkyHigh Microplate Spectrophotometer (Thermo Fisher Scientific). The isolated RNA samples were reverse transcribed employing HiScript II Q RT SuperMix for qPCR (Vazyme, R222-01) according to the manufacturer's instructions. Then qRT-PCR were performed using ChamQ Universal SYBR qPCR Master Mix (Vazyme, Q711-03) by CFX96 Touch Real-Time PCR Detection system (Bio-Rad). All experiments were performed with three independent replicates. All primer sequences were listed in Supplementary Table S3.
Western blot analysis
Cells were lysed on ice in RIPA buffer (Sigma, V900854). The whole cell extracts were separated by SDS-PAGE and transferred onto the PVDF membrane (Millipore, IPVH00010). After blocked with 5% skimmed milk powder (PSAITONG, S10191) for 2 h at RT, membranes were then stained with primary antibodies overnight at 4°C and incubated with secondary antibodies for 1.5 h at RT. After washed thrice, membranes were detected using BeyoECL Plus kit by ChemiDoc Imaging System (Bio-Rad). All experiments were performed with three independent replicates. The antibodies and their dilutions were listed in Supplementary Table S2. The quantitative analysis of western blots is based on the gray value of the indicated proteins normalized to the loading controls. The gray value of each lane is measured by ImageJ.
Immunofluorescence assay
Cells were fixed with 4% paraformaldehyde (BBI, E672002-0500) for 30 min at RT. After washed thrice, the cell samples were blocked and permeabilized using PBS (Gibco, C10010500BT) supplemented with 3% BSA (Sigma, V900933) and 0.2% Triton X-100 (Sigma, X100) for 40 min at RT. After washed thrice, cells were then incubated with primary antibodies overnight at 4°C and with secondary antibodies for 1 h at RT. Images were captured with Axio Vert.A1 Microscope (Zeiss) or Confocal Microscope LSM 900 (Zeiss). All experiments were performed with three independent replicates. All antibodies and their dilutions were listed at Supplementary Table S2. The quantitative analysis of IF images is based on the fluorescence intensity of the indicated proteins measured by ImageJ. Two-sided Wilcoxon test adjusted for multiple comparisons.
AP staining
Wild-type H9 and ALKBH5−/− hESCs were cultured on Matrigel-coated plates for alkaline phosphatase (ALP) assay. The cell samples were fixed with 4% paraformaldehyde (BBI, E672002-0500) for 20 min at room temperature. After washed thrice with 1× TBST, the cells were staining with BCIP/NBI working buffer (Beyotime, C3206) supplemented with BCIP solution (Beyotime, C3206) and NBT solution (Beyotime, C3206) for 20 min. The processed samples were washed once and used for further detection. The AP staining was conducted according to the manufacturer's instructions. All experiments were performed with three independent replicates.
Teratoma formation
The experiments involving animal research for teratoma formation has been reviewed and approved by IACUC at Westlake University (AP#23-109-PDQ). In our experiments, the culturing wild-type H9 and ALKBH5−/− hESCs were digested by Accutase (STEMCELL Technologies, 7920) for 7 min at 37°C and resuspended in DMEM/F12 (Hyclone, SH30023.01) with 50% Matrigel (Corning, 354230), and then injected subcutaneously into immuno-deficient mice. The mice used here (male, 5–6 weeks, NCG) were purchased from GemPharmatech. The animal manipulations were performed according to the applicable guidelines and regulations of Westlake University, Hangzhou, China. Teratomas were detected after 6–8 weeks and fixed in 4% paraformaldehyde, and then stained with hematoxylin/eosin (H&E). The sizes of tumors were all within 2.2 × 2.2 cm. All experiments were performed with three independent replicates.
Rescue experiments
The rescue experiments were based on lentiviral infection. The designed lentiviruses were produced in HEK293T cells using polyethylenimine (PEI, Proteintech, B600070)-mediated transfection. For ordinary rescue experiments, cells were infected with lentiviruses expressing the CDS cassettes of the corresponding genes and the indicated controls described above. For inducible rescue experiments, cells were infected with lentiviruses expressing the CDS cassettes of the corresponding genes and the indicated controls, the expression of which were switched by the treatment of 1 μg/ml doxycycline (DOX, MCE, HY-N0565B)(27). After 2 days, the infected cells were selected with 1 μg/ml puromycin or 10 μg/ml blasticidin S according to the experiment designs. For inducible systems for DKK1/DKK4 rescue experiments, cells were treated with different doses of DOX (1 μg/ml DOX, 0.1 μg/ml DOX, DOX-free) to achieve different levels of DKK1/DKK4 expression. All primer sequences of the CDS cassettes and controls were listed at Supplementary Table S1.
Generation of knockdown cell lines
The generation of knockdown cell lines was based on lentiviral infection. The construction of the designed lentiviruses was conducted as described above. hESCs were introduced with lentiviruses expressing shRNAs towards the corresponding genes and the negative control shScramble. After two days, the infected cells were selected with 1 μg/ml puromycin (Gibco, A1113803) or 10 μg/ml blasticidin S (Beyotime, ST018) according to the experiment designs. All sequences of shRNAs and controls were listed at Supplementary Table S1.
RNA stability assays
Wild-type H9 and ALKBH5−/− cells were treated with 10 μg/ml transcription inhibitor Actinomycin D (MCE, HY-17559) at 36h of DE differentiation and collected at different timepoints (0, 1, 2 and 3 h). The total RNA extraction, RNA reverse transcription and qRT-PCR analyses were manipulated as described above. The data analyses were conducted according to a previously published paper(28). Specifically, the Ct average of each timepoint were normalized to the Ct average of t = 0 to obtain ΔCt value (ΔCt = average Ct of each time point – average Ct of t = 0). The relative mRNA abundance of each timepoint was calculated and shown as the value of 2(–ΔCt). The mRNA decay rates were determined by non-linear regression curve fitting (one-phase decay) using GraphPad Prism. The primer sequences were listed in Supplementary Table S4. All assays were performed with three independent experiments.
Global m6A quantification
The total RNA extraction of the collected cell samples was conducted as described above. The quantification of RNA concentration was performed by Qubit 4.0 Flourometer (Thermo Fisher Scientific). After that, the quantification of m6A RNA methylation level in RNA samples was performed by an enzyme-linked immunosorbent assay (ELISA)-based colorimetric assay utilizing EpiQuik™ m6A RNA Methylation Quantification Kit (Colorimetric, Epigentek, P-9005) according to the manufacturer's instructions. In brief, RNA samples were bound to strip well with binding solution for 90 min at RT. After washed, each well was incubated sequentially with capture antibody, detection antibody, and enhancer solution. Then color developing solution was added and absorbance was measured in 450 nm. Finally, to determine the relative m6A RNA methylation status, a calculation for the percentage of m6A in the total RNA was carried out using the following formula:
S is the amount of input sample RNA in ng.
P is the amount of input positive control in ng.
MeRIP-qPCR
The total RNA extraction of the collected cell samples was conducted as described above. The quantification of RNA concentration was performed by Qubit 4.0 Flourometer (Thermo Fisher Scientific). The m6A RNA enrichment of all prepared RNA samples were conducted using EpiQuik CUT&RUN m6A RNA enrichment Kit (Epigentek, P-9018) according to the manufacturer's instructions. Briefly, a certain amount of RNA was firstly separated from the extracted RNA as Input and m6A-containing RNA was then immunocaptured from the remaining total RNA as IP. The input samples were cleaved for RNA release, while the IP samples were under sequential cleavage and protein digestion. The input and IP samples were released and recovered using the RNA purification solution and RNA binding beads. The final eluted RNA was prepared for the following reverse transcription and qRT-PCR, which were conducted as described above. All experiments were performed with three independent replicates. All primer sequences used in this assay were listed at Supplementary Table S4.
YTHDF2-RIP-qPCR
The RIP in this experiment was performed using EZ-Manga RIP Kit (Merck, 17–701) according to the manufacturer's instructions. Briefly, about 1 × 10⁷ cells at 36 h of DE differentiation were harvested and lysed in RIP lysis buffer. A certain amount of samples was separated from the lysed samples as Input and the remaining samples were immunoprecipitated with the antibody against YTHDF2 (Proteintech, 24744-1-AP) by protein A/G magnetic beads. Then the bound complexes were immobilized with magnet and washed for several times. Finally, RNA from Input and IP samples were purified and prepared for reverse transcription and qRT-PCR analyses, which were conducted as described above. All experiments were performed with three independent replicates. All primer sequences and antibodies used in this assay were listed at Supplementary Tables S2 and S4.
Luciferase reporter assay
To establish the designed luciferase reporter system, the Firefly luciferase cassette of pmirGLO luciferase vector (miaolingbio) was fused with the wild-type or mutated GATA6-3′UTR, respectively. Then we cotransfected the constructed luciferase vectors with the PLKO.1 vector expressing shRNAs against ALKBH5 or the negative control shScramble into 293T cells. The mutated GATA6-3′UTR is synthesized by GenScript. To infer the differences in mRNA stability among the experimental groups, we measured the mRNA abundance of the Firefly luciferase at 48h by qPCR analysis, while the mRNA abundance of Renilla luciferase served as controls for normalization. All primer sequences used in this assay were listed at Supplementary Table S4.
RNA-seq library construction and data analysis
Total RNA was extracted from cells using FastPure Cell/Tissue Total RNA Isolation Kit V2 (Vazyme, RC112-01) following the manufacturer's instructions. For RNA-seq, at least 500 ng of RNA was used for sequencing library construction and was sequenced on an Illumina Novaseq PE150 platform. The construction of RNA-seq libraries and sequencing were conducted by Novogene. For data analysis, the RNA-seq reads were aligned to the gencode (hg38) transcriptome using Bowtie2 (v2.2.5) and RSEM (v1.3.0). mRNA level was calculated using EDASeq (v2.4.1). The differentially expressed genes were identified by DESeq2 (v1.42.0).
MeRIP-seq library construction and data analysis
The total RNA extraction of the collected cell samples was conducted as described above. The quantification of RNA concentration was performed by Qubit 4.0 Flourometer (Thermo Fisher Scientific). Briefly, mRNAs were fragmented into about 100-nt fragments and immunoprecipitated with 4–5 μg m6A antibody, both input and IP products were subjected to library construction (Illumina). The construction of MeRIP-seq libraries and the following sequencing were conducted by Novogene. For analysis, the MeRIP-seq raw data were trimmed for adapters using the TrimGalore v.0.6.6. Trimmed reads were aligned to human gene with STAR aligner with reference human genome hg38. Peaks were called using exomePeak2 software with the default parameters and annotated by ChIPseeker software.
CUT&Tag library construction and data analysis
CUT&Tag library construction was performed using Hyperactive Universal CUT&Tag Assay Kit for Illumina (Vazyme, TD903). For each experiment, around 10 000 living cells were obtained and mixed with activated Concanavalin A beads, followed by sequential incubation with primary and secondary antibodies. After washed, the beads were resuspended in pA(G)-Tn5 buffer supplemented with 10 mM MgCl2 for DNA fagmentation. Next, DNA fragments were indexed using TruePrep Index Kit V2 for Illumina (Vazyme, TD202) and amplified by PCR. After purified by VAHTS DNA Clean Beads (Vazyme, N411-01), the libraries were subjected to Illumina Novaseq instruments for sequencing. All antibodies used in this study were listed in Supplementary Table S2. The CUT&Tag reads were mapped to the hg38 reference genome using bowtie2 (v2.4.5). SAMtools (v1.16.1) was used to remove the repetitive, low sequencing quality (mapq < 30) and the mitochondrial DNA mapped reads in the total mapped reads. The value was further compressed into a binary format for downstream analysis and data visualization. Peak calling was performed using MACS3 (3.0.0b1) and the binding motif enrichment were analyzed by Homer.
Statistical analysis
The statistical analysis was done using Prism v8.3.0 software. Two-tailed unpaired Student's t-test is used to determine the significance between two groups. Results were presented as mean ± SD calculated by GraphPad Prism at least three biological repeats. P< 0.05 is considered to indicate a statistically significant value. *P < 0.05, **P < 0.01, ***P < 0.001, ****P < 0.0001. No statistical method was used to predetermine sample size. No specific randomization or blinding protocols were used.
Results
ALKBH5 is essential for human DE differentiation
m6A modifications have been implicated in many disease processes and biological systems. Notably, recent studies have underscored multifaceted and tunable features of m6A functions under different methylation levels (9,29,30), posing a requirement to refine their distinct effects with more concerns on the methylation status. We propose that m6A may play a systematic role in cell fate decisions. To test this idea and avoid the possible interference by m6Am which could be mediated by the m6A demethylase FTO, we focused on another demethylase ALKBH5 with m6A as its only-known substrate to investigate the function of m6A hypermethylation in early embryonic development. To begin with, we knocked out ALKBH5 by gene-editing via CRISPR/Cas9 system(26) and analyzed its role in early embryonic development (Supplementary Figure S1A) in hESC H9. The PCR genotyping, q-RT PCR quantification and western blot analysis indicate ALKBH5 is indeed deficient in the resulting ALKBH5−/− hESCs (Supplementary Figure S1B, C; Figure 1A). We selected two colonies (ALKBH5−/−-1 and ALKBH5−/−-2) for the further investigation. Interestingly, ALKBH5−/- hESCs appear to be morphologically indistinguishable from wild-type (WT) hESCs and maintain high mRNA and protein levels of pluripotency markers based on qRT-PCR, immunofluorescence, and alkaline phosphatase (AP) staining (Supplementary Figure S1D–G). Additionally, the cell-cycle and teratoma formation analysis indicate that ALKBH5−/- hESCs retain similar cell-cycle distribution and in vivo three germ-layer differentiation propensities to WT hESCs (Supplementary Figure S1H, I).
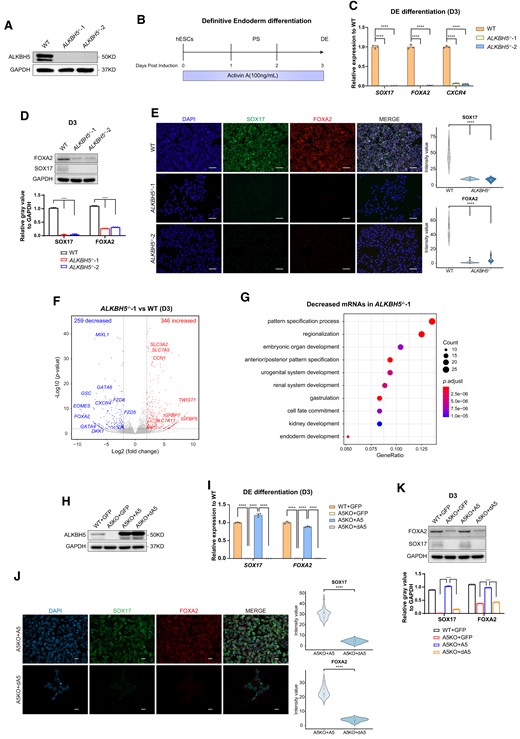
ALKBH5 depletion impairs DE differentiation from hESCs. (A) Detection on the expression levels of ALKBH5 proteins in WT and ALKBH5−/− hESCs by western blot analysis. The images are representative of three independent replicates. GAPDH serves as a loading control. (B) Overview of the Activin A-mediated, chemically defined DE differentiation strategy for hESCs. hESCs maintained in mTesR1 medium under monolayer conditions (D0) were fed by RPMI1640/B27 medium supplemented with Activin A (100 ng/ml) for 3 days. At the endpoint of this differentiation (D3), the samples were collected for further identification. PS specification occurs from 24 to 48 h according to previous studies (50). See ‘Material and Methods’ sections for more details. (C) qRT-PCR analysis on the mRNA levels of DE-specific markers in WT and ALKBH5−/− cells (D3) under DE induction. Data are mean ± SD (standard deviation), two-sided, unpaired t test; n = 3 independent experiments. ****P < 0.0001. WT cells serve as controls. (D) Western blot analysis on the protein levels of SOX17 and FOXA2 in WT and ALKBH5−/− cells at day 3 of DE differentiation (upper panel). The images are representative of three independent replicates. GAPDH serves as a loading control. The histogram at the bottom panel shows the quantitative analysis on western blots of SOX17 and FOXA2, based on the relative gray value normalized to GAPDH. Data are mean ± SD (standard deviation), two-sided, unpaired t test; n = 3 independent experiments. ****P < 0.0001. (E) Immunostaining for the DE-specific markers SOX17 and FOXA2 in ALKBH5 depleted cells at day 3 of DE differentiation. Wild-type H9 (WT) derivates serve as controls. The images are representative of three independent replicates. Scale bar, 100 μm. The violin plots on the right panel show the quantitative analysis on fluorescence intensity of the indicated proteins within random nuclei. n = 20 nuclei, from three biologically triplicated experiments. Two-sided Wilcoxon test adjusted for multiple comparisons. ****P < 0.0001. (F) Volcano plot of transcriptome analyses between WT and ALKBH5−/−-1 samples collected at day 3 of DE formation. WT cells serve as controls. Every single point represents a transcript. ‘P= 0.01’ and ‘fold change = 4’ are used as threshold. Red, increased transcripts (P < 0.01, fold change > 4); blue, decreased transcripts (P < 0.01, fold change < 0.25). (G) GO analysis of transcripts with at 4-fold decrease in ALKBH5−/−-1 cells (D3) versus WT cells (D3) under DE differentiation. (H) Western blot analysis on ALKBH5 protein levels of ALKBH5- and dALKBH5-restored A5KO cells after 3-day DE induction. A5, ALKBH5; dA5, inactive ALKBH5 (dALKBH5). WT + GFP and A5KO + GFP serve as vector controls. The images are representative of three independent replicates. GAPDH serves as a loading control. (I) Transcriptional analysis on the mRNA abundance of DE-specific markers SOX17 and FOXA2 by qRT-PCR among the indicated groups (D3) in the rescue experiments under DE induction. WT + GFP and A5KO + GFP serve as vector controls. Data are mean ± SD, two-sided, unpaired t test; n = 3 independent experiments. ****P < 0.0001. (J) Immunostaining analysis on the protein levels of SOX17 and FOXA2 in ALKBH5- and dALKBH5-restored A5KO cells after 3-day DE differentiation. The images are representative of three independent replicates. Scale bar, 20 μm. The quantitative analysis (the right panel) is based on the fluorescence intensity of the indicated proteins within random nuclei. n = 20 nuclei, from at least three biologically triplicated experiments. Two-sided Wilcoxon test adjusted for multiple comparisons. ****P < 0.0001. (K) The protein expression levels of SOX17 and FOXA2 in A5KO cells upon ALKBH5 and dALKBH5 restoration after 3-day DE induction. The images are representative of three independent replicates. WT + GFP and A5KO + GFP serve as vector controls. GAPDH serves as a loading control. The histogram at the bottom panel shows the quantitative analysis on western blots of SOX17 and FOXA2, based on the relative gray value normalized to GAPDH. Data are mean ± SD (standard deviation), two-sided, unpaired t test; n = 3 independent experiments. ****P < 0.0001.
We next performed a commercially-available trilineage differentiation assay on WT and ALKBH5−/− hESCs (Supplementary Figure S2A). At the endpoint, we observed that loss of ALKBH5 has no remarkable influence on early neuroectoderm and mesoderm differentiation based on the increased mRNA abundance of their lineage-specific markers, but impacts endoderm induction (Supplementary Figure S2B, C). Consistently, the embryonic body (EB) formation assay, which can mimic early embryonic development in vitro and assess the capacity of hESC differentiation(31), reveals that the EB spheres formed by ALKBH5−/− hESC exhibit smaller sizes than those from WT hESCs (Supplementary Figure S2D). The mRNA levels of endodermal specific markers SOX17 and FOXA2 in ALKBH5−/− cells were repressed at the eight-day endpoint while the neuroectodermal and mesodermal markers exhibited a discernible upregulation (Supplementary Figure S2E). Together, these results suggest that ALKBH5 regulates endoderm differentiation specifically in early embryonic development in vitro. To obtain a more comprehensive understanding on the functions of ALKBH5 and its molecular mechanisms, we attempted to utilize chemically defined approaches to examine the influence of ALKBH5 on trilineage differentiation. We then initiated default early-neuroectoderm differentiation from WT and ALKBH5−/− hESCs by dually inhibiting the TGF-β and BMP signaling(32) (Supplementary Figure S2F). For mesoderm induction, BMP4, which has been identified as a specific determinant for mesoderm fate, was employed together with the TGF-β signal Activin-A to generate early mesodermal subtypes(23) (Supplementary Figure S2F). At the endpoint of the assays, we performed RNA-seq on the collected WT and ALKBH5−/− samples. As shown in Supplementary Figure S2G, the mRNA abundance of specific neuroectodermal and mesodermal markers in ALKBH5−/− cells is remarkably decreased in the corresponding induction assays as WT controls, consistent with the outcomes from the commercial assays and EB formation.
It has been reported that the TGF-β signal Activin A alone is sufficient to induce DE differentiation(20,21). To further define the function of ALKBH5 in endoderm formation and eliminate the intrusive external contexts(9), we utilized the Activin A-mediated system (Figure 1B) to differentiate WT and the manipulated hESCs into DEs. Surprisingly, we detected that the diversion of ALKBH5−/− hESCs towards DE are accompanied with a loss of cell viability, and the remaining cells exhibit more flat and mesenchymal-like morphology compared with controls (Supplementary Figure S3A). The mRNA and protein levels of endoderm-specific markers, such as SOX17, FOXA2 and CXCR4, are repressed in ALKBH5−/- hESCs compared to WT cells (Figure 1C–E). Based on current knowledge of mouse embryogenesis, the emergence of anterior primitive streak (APS) (E6.5) is a prerequisite for DE (E7.0–E7.5) generation(18,33). To see if ALKBH5 plays any role in APS, we performed qRT-PCR and immunofluorescence experiments and show that loss of ALKBH5 also fails to activate the expression of APS-specific transcripts and proteins during DE specification (Supplementary Figure S3B, C). We next performed transcriptome analyses on the samples at day 3 by RNA-seq for and identified a total of 346 increased transcripts and 259 decreased transcripts in ALKBH5−/−-1 cells (P< 0.01; fold change > 4) (Figure 1F; Supplementary Figure S3D). The gene-ontology (GO) analysis reveals that these decreased mRNAs are enriched for diverse biological processes, including embryonic organ development, anterior/posterior pattern specification, gastrulation and endoderm development (Figure 1G; Supplementary Figure S3E). In addition, the increased mRNAs are mainly associated with muscle tissue development, lipid metabolic processes and wounding regulation, which might be related to mesodermal development and cell stress responses (Supplementary Figure S3F, G). Combined with the transcriptome analyses on differentiated samples during neuroectoderm and mesoderm induction, we mapped the trajectory of three-germ-layer differentiation (Supplementary Figure S3H). Specifically, ALKBH5 depleted cells are not able to exhibit similar transcriptomic patterns with WT controls under early endoderm differentiation.
To further probe the role of ALKBH5 in APS-DE lineage cell fate decisions, we attempted to rescue the defect in ALKBH5−/- hESCs by lentiviral-infected overexpression. We also introduced Cre in ALKBH5−/−-1 so that we could remove the puromycin cassette for later characterization and designated the manipulated cells as A5KO cells. As controls, we infected WT and A5KO hESCs with the same lentiviral backbone carrying the GFP expression cassette. As another control, we also included demethylase-inactive ALKBH5 (H204) (dA5)(3) (Figure 1H). As expected, restoration by ALKBH5, but not dA5, specifically rescues the ALKBH5−/− defect, as evidenced by analyses on the mRNA abundance and protein expression of endodermal markers, as well as APS markers (Figure 1I–K; Supplementary Figure S3I). Taken together, our consequences suggest that ALKBH5 is required for APS-DE cell fate decisions in hESC-based early development models.
ALKBH5 drives the PS intermediate transition during DE formation
It is commonly known that DE generation necessitates the PS formation and anteriorizing. To define how ALKBH5 regulates the APS-DE determination (16,17), we sampled at intervals of 12 h and show that the mRNA levels of most PS and APS-specific markers in WT cells rise dynamically at 36 h, compared to A5KO cells (Figure 2A; Supplementary Figure S4A), suggesting an underlying role of ALKBH5 in modulating the PS formation at a very early stage. Hence, during the Activin A-mediated DE differentiation (Figure 1B), we collected the WT and A5KO samples at the 36 h timepoint and performed qRT-PCR and immunofluorescence to detect the mRNA and protein levels of typical PS markers T and MIXL1, as well as APS-specific markers, such as GSC, EOMES and LHX1, which demonstrates that they fail to rise under Activin stimulation (Figure 2B, C; Supplementary Figure S4B, C). Further global transcriptome analyses utilizing RNA-seq display that KO of ALKBH5 leads to robust changes between the transcriptomes of WT and A5KO samples at 36 h (P< 0.01, fold change > 4) (Figure 2D), whereby the decreased transcripts include PS/APS and endoderm-specific transcription factors, as well as key regulators of Wnt/β-catenin pathway, implying the possible role of Wnt/β-catenin pathway during PS specification upon ALKBH5 deficiency (Figure 2E). Consistently, GO analysis reveals the decreased transcripts are related to early developmental processes during gastrulation (Figure 2F, left), whereby the reduced mRNAs in the top GO terms are predominantly PS and APS-specific, also indicating the requirement of ALKBH5 for specifying endodermal derivates (Figure 2F, right). The increased transcripts appear to be associated with muscle cell development and filament organization. (Supplementary Figure S4D). These results further reveal that ALKBH5 drives the PS/APS specification during DE differentiation.

ALKBH5 is required for the PS specification during DE formation. (A) Time-course detection on the mRNA abundance of PS and APS-specific genes by qRT-PCR in A5KO derivates during DE formation. WT cells serve as controls. Cells are sampled at the interval of 12 h. T and MIXL1 represent the PS-specific markers while GSC and EOMES are APS-specific. The data represent the mean ± SD (standard deviation) from three independent replicates. (B) qRT-PCR analysis on the relative mRNA abundance of PS/APS-specific markers between WT and A5KO cells at 36 h of DE differentiation. Data are mean ± SD, two-sided, unpaired t test; n = 3 independent experiments. ****P < 0.0001. (C) Detection on the protein levels of PS/APS-specific markers at 36 h of DE induction through immunofluorescence analysis. Wild-type H9 derivates serve as controls. The images are representative of three independent replicates. Scale bar, 20 μm. The violin plots on the right panel show the quantitative analysis on fluorescence intensity of T and FOXA2 within random nuclei. n = 20 nuclei, from three biologically triplicated experiments. Two-sided Wilcoxon test adjusted for multiple comparisons. ****P < 0.0001. (D) Volcano plot of transcriptome analyses in A5KO cells (36 h) versus WT cells (36 h) under DE induction. Every single point represents a transcript. ‘P= 0.01’ and ‘fold change = 4’ are used as threshold. Red, increased transcripts (P < 0.01, fold change > 4); blue, decreased transcripts (P < 0.01, fold change < 0.25). (E) Heatmap visualization for the transcripts with dynamic changes (4-fold, P < 0.01) between WT and ALKBH5−/- cells at PS stage (36 h). The reduced mRNAs in A5KO cells (36 h) include PS/APS/DE-specific markers and Wnt associated regulators. (F) GO analysis of the decreased mRNAs (P < 0.01, fold change < 0.25) in A5KO cells versus WT cells at 36h of DE formation (left panel). The right panel further shows the top GO terms of the decreased transcripts and their corresponding gene-sets in A5KO cells at the 36 h timepoint. The specific markers of primitive streak, anterior primitive streak and definitive endoderm are labeled in purple, blue and red, respectively.
GATA6 mRNA as an ALKBH5 target for m6A demethylation
To define specific targets of ALKBH5, we performed an enzyme-linked immunosorbent assay (ELISA)-based colorimetric assay to detect m6A methylation status on differentiating samples at 36 h, the time point from which dynamic differential expression initiated as shown above. As expected, global m6A methylation level is elevated in ALKBH5 KO cells (Supplementary Figure S5A), compared with controls. We then profiled the m6A methylomes by means of MeRIP-seq on samples at 36h. A total of 13 611 and 10 907 peaks were identified in WT and A5KO samples, respectively, with a common enrichment around coding sequence (CDS), 3′UTR and stop codon. In addition, we observed a similar pattern of m6A peak distribution among WT and A5KO cells, whereas ALKBH5 depletion mainly increased the m6A peak density in CDS (Supplementary Figure S5B). In total, loss of ALKBH5 results in m6A hypermethylation around 2386 transcripts specifically compared to WT cells (fold change > 1.5).
To find out the downstream targets of ALKBH5, we performed an integrative analysis of MeRIP-seq and RNA-seq (Figure 3A). Compared with the increased mRNAs identified by RNA-seq, the 94 decreased mRNAs (P< 0.01, fold change > 2) are more relevant to PS and DE formation. The overlapping of m6A-hypermethylated mRNAs and transcripts with 2-fold reduction eventually reveals 23 putative specific targets of ALKBH5 (Figure 3B), including GATA6, FOXA2, COL6A1 and APCDD1(Figure 3C), which served as critical regulatory factors in lineage commitment and endoderm development based on previously published data (34–37). To narrow down these downstream targets, we performed qPCR analyses on WT and A5KO samples at 36h under DE induction, and finally identified 18 candidates with 2-fold downregulation (Supplementary Figure S5C). Then, we established the doxycycline (DOX)-dependent overexpression system for these candidates individually to test their rescue effect to the endoderm defect under ALKBH5 depletion. However, only GATA6 restoration can fully rescue the aberrant DE differentiation, as evidenced by the elevated mRNA levels of SOX17 and FOXA2 (Supplementary Figure S5C, D). Besides, we performed a combined restoration for four genes (ROR2, SHISAL2B, DAB1, NODAL) which appear to have mild rescue responses on A5KO cells but eventually failed to observe a successful rescue effect by this combined action (Supplementary Figure S5D). For the most potential candidate GATA6, whose mRNA abundance has been identified to be decreased at PS stage (Figure 3D), we further confirmed its m6A-hypermethylated status at the same stage by MeRIP-qPCR (Figure 3E). Thus, we next focus on GATA6 and attempted to figure out whether GATA6 significantly influences DE induction in a m6A-dependent manner.
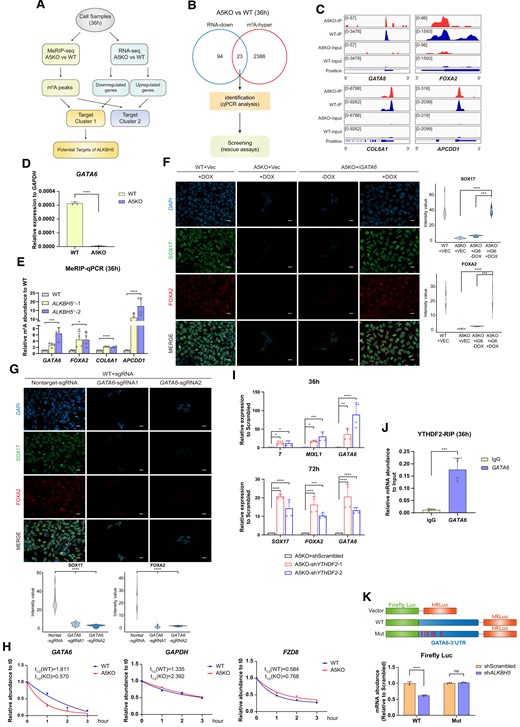
ALKBH5 directly targets GATA6 mRNA and regulates its mRNA metabolism. (A) Workflow of identifying the downstream targets of ALKBH5. The integrative analysis of MeRIP-seq and RNA-seq is performed on WT and A5KO cells at the 36h timepoint of DE formation. The transcripts with m6A-hypermethylation (fold change > 1.5) and 2-fold decrease at mRNA level are screened as potential targets of ALKBH5 from this joint analysis for further identification. (B) Venn diagram shows the overlapped transcripts identified by MeRIP-seq (m6A-hyper, fold change > 1.5) and RNA-seq (2-fold downregulation at mRNA abundance). These candidates are further validated by qPCR analyses and the following rescue assays. (C) Normalized m6A read density levels of the four representative candidates (GATA6, FOXA2, COL6A1 and APCDD1) are shown as blue (WT) and red (A5KO). (D) Identification of GATA6 mRNA abundance in A5KO cells at 36 h of DE induction by qRT-PCR. Wild-type H9 derivates serve as controls. Data are mean ± SD, two-sided, unpaired t test; n = 3 independent experiments. ****P < 0.0001. (E) MeRIP-qPCR analysis of the m6A enrichment around the MeRIP-seq-identified regions in the transcripts of four representative candidates (GATA6, FOXA2, COL6A1 and APCDD1). Data are mean ± SD, two-sided, unpaired t test; n = 4 independent experiments. *P < 0.05, ***P < 0.001, ****P < 0.0001. (F) The protein expression levels of lineage-specific markers SOX17 and FOXA2 in the A5KO cells with GATA6 restoration at day 3 of DE differentiation. WT + Vec and A5KO + Vec serve as vector controls. iGATA6, inducible overexpression of GATA6; +DOX, with DOX treatment; -DOX, without DOX. The images are representative of three independent replicates. Scale bar, 20 μm. The violin plots on the right panel show the quantitative analysis on fluorescence intensity of the indicated proteins within random nuclei. n = 20 nuclei, from three biologically triplicated experiments. Two-sided Wilcoxon test adjusted for multiple comparisons. ***P < 0.001, ****P < 0.0001. (G) Detection on the protein expression levels of DE-specific markers in GATA6-depleted cells after 3-day DE differentiation via immunofluorescence analysis. WT + Nontarget-sgRNA serves as vector controls. The images are representative of three independent replicates. Scale bar, 20 μm. The quantitative analysis at the bottom panel is based on the fluorescence intensity of SOX17 and FOXA2 within random nuclei. n = 20 nuclei, from three biologically triplicated experiments. Two-sided Wilcoxon test adjusted for multiple comparisons. ****P < 0.0001. (H) Measurement for mRNA decay of GATA6 in WT and A5KO cells during DE induction. Actinomycin D is added at 36 h of DE induction, and in turn the differentiating samples are collected at interval of 1 h. GAPDH and FZD8 mRNAs serve as controls representative of the mRNAs without m6A hypermethylation upon ALKBH5 depletion. The data represent the mean ± SD (standard deviation) from three independent replicates. (I) qRT-PCR analysis on the mRNA levels of PS/APS/DE-specific genes in A5KO differentiated cells upon YTHDF2 knockdown. (upper panel, 36 h, bottom panel, 72 h). A5KO + shScrambled serves as a control. Data are mean ± SD, two-sided, unpaired t test; n = 4 independent experiments. *P < 0.05, **P < 0.01, ***P < 0.001, ****P < 0.0001. (J) RIP-qPCR validates that YTHDF2 binds to GATA6 mRNA. The group IgG serves as the isotype control. The relative mRNA abundance of IP samples is normalized to their corresponding Input samples. Data are mean ± SD, two-sided, unpaired t test; n = 4 independent experiments. ***P < 0.001. (K) The relative mRNA abundance of the wild-type or mutant GATA6 3′UTR-fused Firefly luciferase in 293T cells treated with scrambled or ALKBH5 shRNAs (upper panel, the overview of the WT and mutated luciferase systems; bottom panel, quantitative analysis of the luciferase reporter experiment). The mRNA abundance of Renilla luciferase (hRLuc) serves as control for normalization. Data are mean ± SD, two-sided, unpaired t test; n = 3 independent experiments. ****P < 0.0001; ns, no significance.
GATA6 is a well-characterized pioneer transcription factor and has been implicated in tuning human endoderm development in vivo and in vitro(34,38). However, little is known about the mechanistic links between GATA6 and m6A modification. Upon the inducible restoration of GATA6 by DOX (Supplementary Figure S5E, F), we observed that the mRNA and protein levels of DE-specific markers and APS-specific markers are remarkably upregulated in A5KO cells at day 3 during DE induction (Figure 3F; Supplementary Figure S5G), further confirming GATA6 is capable of rescuing ALKBH5 deficiency. To further verify the regulatory role of GATA6, we introduced GATA6-sgRNAs into WT hESCs by lentiviral infection. Immunofluorescence and western blot analyses confirm the reduction of GATA6 protein level (Supplementary Figure S5H, I) under PS specification, strikingly suppressing the subsequent DE formation (Figure 3G). Taken together, these data demonstrate that GATA6 mRNA is a direct downstream target of ALKBH5.
ALKBH5 depletion destabilizes GATA6 mRNA in a YTHDF2-dependent manner
We ask next how hypermethylated GATA6 is regulated by additional factors. We hypothesize that m6A-mediated RNA decay plays a role in GATA6 function. To this end, we performed DE differentiation on WT and A5KO hESCs and treated the differentiating cells with Actinomycin D at 36h. As expected, the time-course qRT-PCR analysis confirms a faster decay rate of GATA6 mRNA upon ALKBH5 depletion within 3 h, while the degradation of GAPDH and FZD mRNAs without m6A hypermethylation is not accelerated in A5KO cells (Figure 3H). Given that recent studies report the m6A reader YTHDF2 predominantly contributes to the destabilizing effect on m6A (39,40), we knocked down (KD) YTHDF2 in A5KO hESCs (Supplementary Figure S5J) and diverted these manipulated cells towards DEs. As shown in Figure 3I, YTHDF2 KD facilitates lineage-specific markers, especially GATA6, to render resistance against the effect of ALKBH5 deficiency at PS and DE stages. RNA immunoprecipitation (RIP)-qPCR further confirms the binding of GATA6 and YTHDF2 (Figure 3J). It was reported that YTHDF3 and YTHDC2 also involves in mRNA degradation, despite of their canonical roles in modulating the translation effect on m6A. However, knockdown of YTHDF3 or YTHDC2 fails to rescue the DE defect upon ALKBH5 depletion (Supplementary Figure S5K). Since the hypermethylated m6A peaks of GATA6 is primarily located in 3′UTR, we performed the luciferase reporter assay to validate whether the GATA6-3′UTR with the identified m6A sites was specifically modulated by ALKBH5. Transcriptional analyses show that ALKBH5 knockdown confers GATA6-3′UTR mediated degradation of the reporter firefly mRNAs, but not its mutant version devoid of m6A sites (Figure 3K). Besides, we observed that the binding between YTHDF2 and the chimeric RNAs with the wildtype GATA6-3′UTR, is specifically strengthened upon ALKBH5 knockdown, as evidenced by the relative fold enrichments of the YTHDF2-binding mRNAs (Supplementary Figure S5L). Briefly, these results show that YTHDF2 binds to hypermethylated GATA6 mRNA in a m6A-dependent manner for its degradation and stability.
DKK1 and DKK4 both exert a pleiotropic effect in governing DE induction in vitro
GATA6 has been implicated in multiple signaling pathways, including Wnt/β-catenin, TGF-β and Hedgehog pathways (41–43). Given that a cluster of genes related to Wnt/β-catenin regulation is downregulated during DE formation (Figure 2E), we next attempted to dissect whether the ALKBH5-GATA6 regulation has a role in modulating endogenous Wnt/β-catenin pathway. We performed cleavage under targets and tagmentation or CUT&Tag assay on differentiating WT samples at 36h and show that GATA6 binds to the promoters of Wnt regulatory genes, including DKK1, DKK4, FDZ5 and FZD8 (Figure 4A, left), and critical lineage-specific transcription factors (Figure 4A, right), which were also reported as Wnt targets previously. To examine differences in Wnt/β-catenin pathways upon ALKBH5 depletion, we performed western blot analysis on differentiating samples at 36h, and observed a discernible decrease in the protein level of active β-CATENIN, or nonphosphorylated β-CATENIN (Figure 4B). Consistently, we also observed by immunofluorescence a loss of nuclear accumulation of β-CATENIN upon ALKBH5 depletion (Figure 4C).
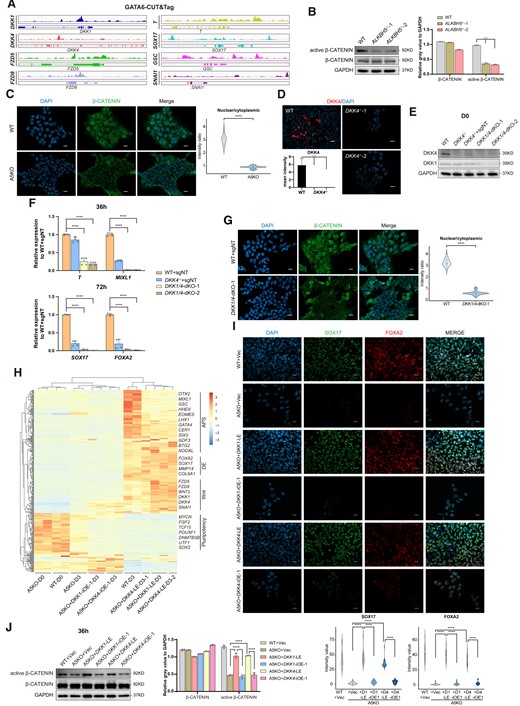
DKK1/DKK4 guard the Wnt/β-catenin cascade through the ALKBH5-GATA6 regulation. (A) Integrated genome viewer captures representative Wnt associated regulators and targets that exhibit GATA6 occupancy. (B) Protein levels of active and global β-CATENIN in differentiated cells (36 h) upon ALKBH5 depletion by the western blot analysis. Wild-type H9 cells (WT) serve as controls. GAPDH serves as a loading control. The images are representative of three independent replicates. The histogram on the right panel shows the quantitative analysis on western blots of active and global β-CATENIN, based on the relative gray value normalized to GAPDH. Data are mean ± SD, two-sided, unpaired t test; n = 3 independent experiments. ***P < 0.001. (C) Immunofluorescence analysis shows decreased nuclear accumulation of β-catenin in A5KO derivates (36 h) under DE induction. WT cells serve as controls. The images are representative of three independent replicates. Scale bar, 20 μm. The quantitative analysis on the right panel is based on the nuclear/cytoplasmic ratio in fluorescence intensity of β-CATENIN. n = 20 nuclei/cytoplasm, from three biologically triplicated experiments. Two-sided Wilcoxon test adjusted for multiple comparisons. ****P < 0.0001. (D) Detection on DKK4 protein level in WT and DKK4−/− hESCs by immunofluorescence analysis. The images are representative of three independent replicates. Scale bar, 20 μm. The histogram about the quantitative analysis is built on the mean intensity of DKK4 in each group from biological triplicated experiments. Data are mean ± SD, two-sided, unpaired t test. ****P < 0.0001. (E) Western blot analysis for DKK1 and DKK4 of the manipulated cells upon DKK4 and DKK4/DKK1 depletion. The images are representative of three independent replicates. (F) qRT-PCR analysis on the mRNA levels of PS and DE-specific genes in hESC-derivates upon DKK4 KO and DKK1/4 double-KO (dKO) during DE induction. WT cells with the nontarget-sgRNA (WT + sgNT) serve as controls. Data are mean ± SD, two-sided, unpaired t test; n = 4 independent experiments. ****P < 0.0001. (G) Immunofluorescence analysis for nuclear accumulation of β-catenin in DKK1/4-dKO derivates (36 h) under DE induction. WT cells with nontarget-sgRNA (WT + sgNT) serve as controls. The images are representative of three independent replicates. Scale bar, 20 μm. The quantitative analysis on the right panel is based on the nuclear/cytoplasmic ratio in fluorescence intensity of β-CATENIN. n = 20 nuclei/cytoplasm, from three biologically triplicated experiments. Two-sided Wilcoxon test adjusted for multiple comparisons. ****P < 0.0001. (H) Heatmap visualization for transcriptomic dynamics by hierarchical clustering among WT controls and ALKBH5−/− cells with different doses of DKK1/DKK4 restoration. (I) Immunofluorescence analysis on the protein levels of DE-specific markers for WT controls and A5KO cells with different doses of DKK1/DKK4 restoration. The images are representative of three independent replicates. Scale bar, 20 μm. The violin plots at the bottom panel show the quantitative analysis on fluorescence intensity of the indicated proteins within random nuclei. n = 20 nuclei, from three biologically triplicated experiments. Two-sided Wilcoxon test adjusted for multiple comparisons. ****P < 0.0001. (J) Detection on the protein levels of active and global β-CATENIN levels by the western blot analysis for WT controls and A5KO cells with DKK1/DKK4 restoration at different levels. GAPDH serves as a loading control. The images are representative of three independent replicates. The histogram on the right panel shows the quantitative analysis on western blots of active and global β-CATENIN, based on the relative gray value normalized to GAPDH. Data are mean ± SD, two-sided, unpaired t test; n = 3 independent experiments. ****P < 0.0001.
qPCR and RNA-seq analyses on the induced samples at 36h reveal that ALKBH5 depletion triggers a remarkable decrease on the mRNA abundance of many Wnt regulators (Supplementary Figure S6A; Figure 2E). Surprisingly, among these regulators we found DKK1 and DKK4, which were previously reported as typical Wnt antagonists, are also remarkably repressed at PS stage (Supplementary Figure S6A). In addition, the motif analysis of GATA6-CUT&Tag demonstrates that the canonical GATA6-binding motif (A/T) GATAAG (A/G/C) are enriched at the promoters of DKK1 and DKK4 (Supplementary Figure S6B). DKK1 and DKK4 are secreted glycoproteins from the Dickkopf (DKK) family and contain a signal peptide with two conserved cysteine-rich domains (44) implicated in cancer progression and tumorigenesis through receptors LRP5/6 to inhibit the canonical Wnt/β-catenin cascade by blocking the Wnt-LRP5/6 interaction (37). In embryogenesis, DKK1 also plays a pivotal role in several developmental events, such as antero-posterior axial patterning and bone formation, by orchestrating the Wnt signaling gradients (44). However, the role of DKK4 in embryonic development has not been widely explored thus far. To evaluate whether DKK4 has the capacity to regulate DE differentiation, we generated DKK4−/− hESCs by CRISPR/Cas9 system (Supplementary Figure S6C, D; Figure 4D). However, DKK4 deficiency merely contributes to a mild repression on the mRNA levels of APS and DE markers under DE differentiation and this defect gradually disappears after several passages of DKK4−/− hESCs (Supplementary Figure S6E). Surprisingly, transcriptomic analyses on WT and DKK4−/− differentiated samples at day 3 detect a striking increase of DKK1 transcripts (Supplementary Figure S6E). Given that DKK1 is structurally and functionally comparable to DKK4 (44), we speculated that DKK1 could compensate DE suppression upon DKK4 depletion through their potential redundancy in modulating Wnt/β-catenin signaling pathway. To verify this hypothesis, we constructed DKK4−/−/DKK1−/− hESCs (DKK1/DKK4-dKO) by an additional introduction of DKK1-sgRNAs into DKK4−/− hESCs (Supplementary Figure S6F; Figure 4E) and discovered a dynamic change on the transcriptome patterns between WT and DKK1/DKK4-dKO cells at PS stage during DE induction (Supplementary Figure S6G). Especially, the mRNA levels of PS and DE-specific markers in DKK4−/− cells at 36h and 72h are remarkably repressed upon DKK1 depletion, respectively (Figure 4F). By immunofluorescence analysis, we show that DKK4/DKK1 depletion leads to the lack of nuclear accumulation of β-CATENIN at 36h during DE differentiation(Figure 4G), suggesting DKK1 and DKK4 could positively regulate the canonical Wnt/β-catenin pathway, which is different from its reported inhibitory effects (37,44).
To clarify whether DKK1 or DKK4 is the downstream target of the ALKBH5-GATA6 regulation, we attempted to restore DKK1 and DKK4 individually by gene-overexpression. However, overexpression of DKK1 and DKK4 both fail to rescue the aberrant endoderm induction caused by ALKBH5 deficiency (Supplementary Figure S6F). Given the canonical roles of DKK1 and DKK4 as Wnt antagonists, we suppose that the overexpressed DKK1 or DKK4, the content of which far outclass that in WT cells (Supplementary Figure S6H), might exert an inhibitory effect on the Wnt/β-catenin signaling pathway as previously reported, thus suppressing DE differentiation. To verify this hypothesis systematically, we utilized several approaches, including constitutive overexpression (cOE) and inducible overexpression (iOE), to restore different doses of DKK1/4 during DE induction (Supplementary Figure S6I). Notably, we also introduced lower DKK1/4 restoration by the DOX-free treatment in the inducible system (Supplementary Figure S6I). As expected, we achieved different mRNA levels of DKK1 or DKK4 via these rescued strategies, among which the restored content of DKK1/4 by leaky expression (LE) from the DOX-free inducible system exhibited the same order of magnitude as their normal levels in WT cells at PS stage during DE formation, compared with other approaches (Supplementary Figure S6J). Additionally, only the restoration by a modest level of DKK1 or DKK4 under LE, which is much closer to their wildtype levels, successfully rescues the DE defect upon ALKBH5 depletion, as evidenced by the mRNA and protein levels of DE-specific markers (Supplementary Figure S6K; Figure 4H, I). However, the mRNA abundance of GATA6 is not to be increased as other lineage-specific genes after DKK1 or DKK4 rescue (Supplementary Figure S6L), implying an upstream regulatory role of GATA6 to DKK1 and DKK4. To validate the influence of DKK1/4 rescue on the Wnt/β-catenin signaling pathway, we performed western blot analysis on WT and rescued samples at the 36h timepoint of DE differentiation. Expectedly, we observed a discernible increase in the protein level of active β-CATENIN upon a modest restoration of DKK1 or DKK4 by LE in A5KO cells (Figure 4J). Combined with the blockade of Wnt/β-catenin pathway triggered by DKK1/4 depletion (Figure 4G), we propose that during DE formation, a proper level of DKK1/4 is required for the transduction of canonical Wnt signaling cascade to support the PS/APS intermediate transition, whereas high-dose or loss of DKK1/4 both exert inhibitory effects on the Wnt/β-catenin pathway, thus thwarting the endoderm development. Collectively, these data uncover a dose-dependent effect of DKK1/4 in regulating the Wnt/β-catenin cascade and suggest a novel role of DKK1/4 as a potential target of the ALKBH5-GATA6 regulation to govern the DE differentiation.
Chir99021 (Chir) is an inhibitor of GSK-3β and serves as a robust agonist of canonical Wnt/β-catenin pathway(23). To further confirm whether the ALKBH5-mediated inhibition on Wnt/β-catenin pathway plays a dominant role in impeding DE development, we introduced Chir99021 (3μM) into DE differentiation of WT and A5KO hESCs from day 0 to day 1 (Figure 5A), and reveal that Chir can almost completely rescue DE induction in A5KO cells. As shown in Figure 5B and C, the A5KO groups with Chir express high mRNA and protein levels of lineage-specific markers at PS and DE stage, similar to controls. Notably, these rescued ALKBH5-depleted cells also exhibit a similar transcriptome pattern to controls (Figure 5D, E). In contrast, we show that the treatment of BMP4 (20 ng/ml), bFGF (20ng/ml) or high-dose Activin A (200 ng/ml) fail to fully rescue ALKBH5 KO defects (Figure 5F). Moreover, by qPCR analyses, we observed that GATA6 mRNA in ALKBH5−/− cells is not as upregulated as the other lineage-specific markers under Chir treatment at PS stage (Figure 5G). Based on our results, we propose that a previously unrecognized ALKBH5-GATA6-DKK1/DKK4 regulatory pathway is upstream of the endogenous Wnt/β-catenin pathway in orchestrating DE development.
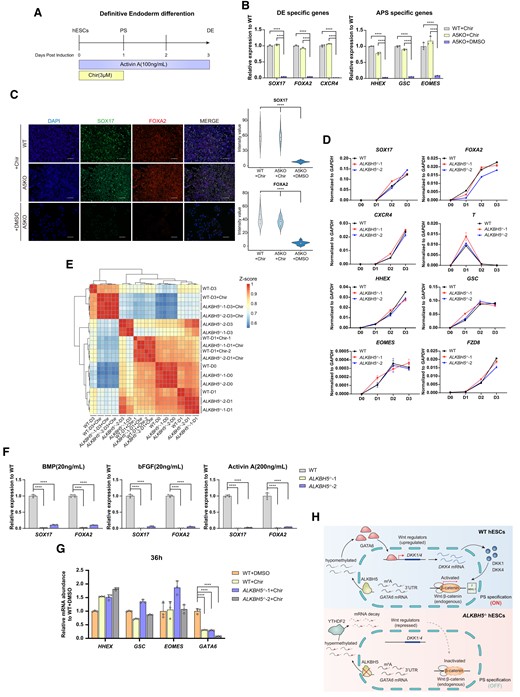
Chir99021 rescues the aberrant DE formation mediated by ALKBH5. (A) Overview of the Chir treatment at the first day of DE differentiation system for hESCs. hESCs maintained in mTesR1 medium under monolayer conditions (D0) were fed by RPMI1640/B27 medium supplemented with Activin A (100 ng/ml) and Chir (3 μM) to initiate DE differentiation. After 1 day, Chir was withdrawn from the induction system, and the differentiating cells were cultured in RPMI1640/B27 medium supplemented with Activin A (100 ng/ml) for the rest 2 days. At the endpoint of this differentiation (D3), the samples were collected for further identification. PS specification occurs at day 1 in this approach(23). See ‘Material and methods’ sections for more details. (B) qRT-PCR analysis on the mRNA levels of DE- (left panel) and APS-specific (right panel) markers in WT and A5KO differentiated cells at day 3 of DE induction upon Chir99021 treatment. The group ‘A5KO + DMSO’ serves as a control. Data are mean ± SD, two-sided, unpaired t test; n = 3 independent experiments. ****P < 0.0001. (C) Protein levels of DE-specific markers SOX17 and FOXA2 in WT and A5KO derivates (D3) under Chir99021 treatment. The images are representative of three independent replicates. Scale bar, 100 μm. The group ‘A5KO + DMSO’ serves as a control. The violin plots on the right panel show the quantitative analysis on fluorescence intensity of SOX17 and FOXA2 within random nuclei. n = 20 nuclei, from three biologically triplicated experiments. Two-sided Wilcoxon test adjusted for multiple comparisons. ****P < 0.0001. (D) Time-course detection for the mRNA abundance of PS/APS/DE-specific genes in WT and A5KO cells upon Chir99021 treatment during DE formation. The data represent the mean ± SD from three independent replicates. SOX17, FOXA2 and CXCR4, DE-specific markers; T, PS-specific markers; HHEX, GSC, EOMES and FZD8, APS-specific markers. (E) Heatmap visualization for transcriptomic dynamics by hierarchy clustering for WT and A5KO cells with or without Chir99021 treatment during DE differentiation. (F) mRNA levels of DE-lineage genes in WT and A5KO cells under the indicated treatment of BMP4 (20 ng/ml), bFGF (20 ng/ml) and Activin A (200 ng/ml). Data are mean ± SD, two-sided, unpaired t test; n = 4 independent experiments. ****P < 0.0001. (G) qPCR analysis on the mRNA level of GATA6 and APS-specific markers in WT and A5KO differentiated cells with or without Chir99021 treatment at 36 h of DE induction. Data are mean ± SD, two-sided, unpaired t test; n = 3 independent experiments. ****P < 0.0001. (H) Schematic representation of a model for the ALKBH5–GATA6–DKK1/4–Wnt/β-catenin regulation pathway in driving PS specification during DE differentiation from hESCs (upper panel). The bottom panel shows the aberrant DE differentiation upon ALKBH5 deficiency. Briefly, during DE differentiation, loss of ALKBH5 induces m6A hypermethylation around the 3′UTR of GATA6 transcripts and accelerates their decay predominantly through YTHDF2-mediated destabilization. The dysregulation of GATA6 mRNA metabolism represses DKK1 and DKK4, both of which at a proper level are required for the Wnt/β-catenin cascade, thus finally thwarting PS specification from hESCs and in turn impeding the PS-APS-DE transition.
Discussion
m6A is emerging as a critical epigenetic modification to regulate mRNA dynamics and impact cellular function in normal and pathological processes. Critical regulators of m6A include writer/eraser/reader involving METTLE3/14, FTO/ALKBH5, YTHDF2 have been well established, while their multifaced roles under different contexts complicates our understanding of the real biology of m6A methylation. In this report, we delineate the molecular mechanism and regulatory pathway linking m6A modification to cell fate decision with hESC-based in vitro model. We propose a previously unrecognized ALKBH5-GATA6-DKK1/DKK4-Wnt/β-catenin regulatory pathway in specifying the early cell fate decisions from pluripotent state to definitive endoderm (Figure 5H). We believe that similar pathways may be established for other cell lineages through similar analyses.
TGF-β/Nodal signaling pathway, which can be emulated by Activin A treatment, is important for DE development (20). Notably, Activin A is the only known morphogen that can induce DE formation alone in vitro, while Chir99021 serves as a Wnt activator in multiple differentiation strategies. It has been reported that Chir99021 helps maximize PS specification and eventually increases the efficiency of DE acquisition (23). However, treatment with or without Chir99021 provides DE induction with 2 different contexts, probably producing distinct results under the same m6A regulation. In our system, we readily observed striking impacts triggered by Wnt inhibition upon ALKBH5 depletion during PS and DE differentiation, whereas ALKBH5−/− hESCs treated with Chir99021 exhibits normal differentiation capacities towards DEs, indistinguishable from WT hESCs. Remarkably, the DE developmental defect upon ALKBH5 depletion is almost entirely rescued by Chir99021 treatment. It should be noted that most of the previous investigations of ALKBH5 on early embryonic development involved Wnt activation (emulated by Chir99021 or other Wnt activators) in their differentiation protocols (12,13). Besides, the intrinsic regulatory network in vivo may immediately rescue the signaling dysregulation caused by ALKBH5 silencing. That is possibly why the role of ALKBH5 in early endoderm development has not been reported until our current work. Our results help to clarify the understanding on the role of ALKBH5 in early endoderm development, and emphasizes the importance of context-complexities in m6A functions.
GATA6 is a critical pioneer transcription factor in modulating multiple developmental processes, especially its role in in vitro DE differentiation (34,45). Significantly, it has been reported that GATA6 is essential for DE formation from human-induced pluripotent cells (hiPSCs) and modulated endoderm fate by controlling chromatin accessibility during differentiation(34). However, few studies have mentioned the relationship between GATA6 and m6A modification in human embryonic development thus far. In our study, we utilized the overlapped analysis of RNA-seq and MeRIP-seq to identify GATA6 as a direct target of ALKBH5. Hyper m6A methylation at 3′UTR upon ALKBH5 deficiency accelerates the mRNA decay of GATA6 in a YTHDF2-dependent manner. In addition, previous studies reported that GATA6 knockdown triggered a loss of endoderm viability and repressed expression of endodermal mRNAs in the absence of Wnt activators. These defects are consistent with the phenotypes described in our research, further confirming the upstream role of ALKBH5 regulation on GATA6 mRNA. More importantly, we reveal an unexpected role of the previously recognized antagonist DKK4/DKK1 in activating Wnt/β-catenin cascade by investigating GATA6 in our models. Here, our study illustrates novel m6A-mediated mechanisms via GATA6 regulation in endoderm development and builds up a bond between GATA6 and m6A-demthylase activities.
There are several interesting issues to be fully clarified in our study. For example, we preferentially focused on downregulated genes upon ALKBH5 depletion in light of their close connections with endoderm induction. However, we also detected a large amount of activated genes under ALKBH5 KO. These genes contain typical regulators involved in cellular metabolism, cell death and stress responses, which probably play unrecognized roles during DE differentiation. In addition, our data reveal that the critical Wnt regulators DKK1 and DKK4 execute different functions in regulating the Wnt/β-catenin pathway in a dose-dependent manner. Previously, DKK4 and DKK1 served as Wnt inhibitors exclusively by their competitive binding with the Wnt coreceptor LRP5/6 (37,44). Moreover, DKK4 and DKK1 has also been identified as Wnt target genes (46–48), engaging in a negative feedback loop to modulate the Wnt/β-catenin cascade. Nonetheless, several studies have reported that DKK2, also a member of the DKK family, could alter its functions according to different conditions and activate the Wnt/β-catenin signaling cascade under a high expression level of LRP5/6 (49). In our study, we propose a possible model for DKK1/4 regulation, in which DKK1/4 serves as the Wnt inhibitors at a high-dose, but maintain the Wnt/β-catenin signaling transduction at a modest, or lower-dose. Besides, loss of DKK1 and DKK4 leads to the disruption of the endogenous signaling cascade. Our findings about the dose-dependent effects of DKK1/DKK4 offer a new perspective for defining their biological functions. Yet, it requires further investigations to explore the molecular mechanisms for the pleiotropic regulations of DKK1/DKK4 to the Wnt/β-catenin pathway.
In conclusion, we first clarify the role of ALKBH5 and its underlying mechanisms during PS specification and DE formation. These findings are conducive to further exploration of ALKBH5 in other aspects of cell differentiation and organ development. Moreover, our refinements on the understanding of ALKBH5 break its ‘nonfunctional’ stereotypes in early embryonic development and provide new enlightenment for future investigations on m6A biology.
Data availability
The RNA-Seq, CUT&Tag and MeRIP-seq data have been deposited in the Gene Expression Omnibus database under the accession code GSE248528.
Supplementary data
Supplementary Data are available at NAR Online.
Acknowledgements
We thank all members of Pei lab in Westlake University for their kindly help. We also thank the supports and platforms provided by Biomedical Research Core Facilities and Laboratory Animal Resource Center in Westlake University .
Author contributions: D.P., J.K. and Z.L. conceived the study and wrote the manuscript. J.K. and Z.L. design the project. Z.L. performed most experiments and result analyses. T.H. and Z.L. conducted the teratoma formation experiments. Z.L., T.H. and W.L. performed the cell culture experiments. Z.M. prepared the reagents for cell culture. K.W., Z.Z. and Y.F. provided reagents and plasmids. Y.F., X.W., Y.Q., B.W. and C.Z. provided helpful suggestions and experimental materials. J.K. performed and supervised the bioinformatic analyses. D.P. supervised the whole study. All authors read and approved the final version.
Funding
National Natural Science Foundation of China [92068201]; National Natural Science Foundation of China [32300639]; Key Research and Development Program of Zhejiang Province [2024SSYS0030]. Funding for open access charge: Research grants to D.P. from the Scientific foundation of Zhejiang Province.
Conflict of interest statement. None declared.

Comments