


Abstract
As compared to eukaryotes, bacteria have a reduced tRNA gene set encoding between 30 and 220 tRNAs. Although in most bacterial phyla tRNA genes are dispersed in the genome, many species from distinct phyla also show genes forming arrays. Here, we show that two types of arrays with distinct evolutionary origins exist. This work focuses on long tRNA gene arrays (L-arrays) that encompass up to 43 genes, which disseminate by horizontal gene transfer and contribute supernumerary tRNA genes to the host. Although in the few cases previously studied these arrays were reported to be poorly transcribed, here we show that the L-array of the model cyanobacterium Anabaena sp. PCC 7120, encoding 23 functional tRNAs, is largely induced upon impairment of the translation machinery. The cellular response to this challenge involves a global reprogramming of the transcriptome in two phases. tRNAs encoded in the array are induced in the second phase of the response, directly contributing to cell survival. Results presented here show that in some bacteria the tRNA gene set may be partitioned between a housekeeping subset, which constantly sustains translation, and an inducible subset that is generally silent but can provide functionality under particular conditions.
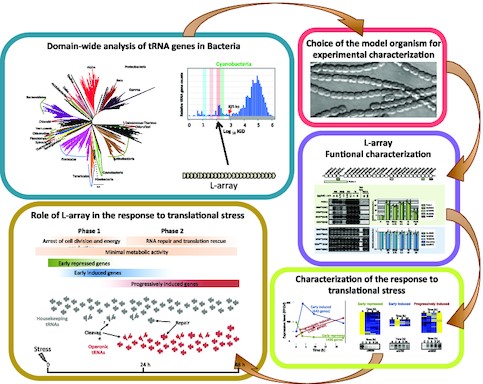
Workflow diagram describing the characterization of the role of the Anabaena tRNA-encoding operon.
INTRODUCTION
The number of tRNA genes per genome displays a wide variability in living organisms (1,2). In the genetic code, the 20 proteinogenic amino acids are encoded by 61 nucleotide triplets. However, it is common that genomes contain a higher or a lower number of tRNA genes, suggesting two opposing phenomena. On the one hand, expansion of the tRNA gene number is favored by horizontal gene transfer (HGT) and gene duplication, which sprinkle genomes with redundant tRNA genes. Such redundancy is particularly common in eukaryotic genomes that contain hundreds to thousands of tRNA genes (1). As an opposing force, wobbling at the ribosome, a phenomenon by which one anticodon can pair with multiple synonymous codons, permits that the 61 sense codons could be theoretically decoded by a minimum of 30 tRNAs (3). Wobbling is enabled by the relaxed pairing specificity of the first nucleotide of the anticodon that is often modified or hypermodified and can establish non-Watson-Crick interactions with nucleotides at the third position of the codon (4). The variety and number of tRNA genes in a genome is ultimately determined by the dynamics of these two opposing forces and by the selection of the optimal gene set to sustain translation.
tRNA abundances within a cell were long deduced from the gene copy number, assuming that all tRNA genes were uniformly transcribed (5–7), which has been validated in some organisms (8,9). However, global tRNA abundance may be modulated and has been observed to decrease in stationary phase or under nutrient starvation (10–14). Increasing evidence also showed that, far from the long-assumed uniform expression of tRNA genes, individual tRNAs can be enriched in particular conditions, tissues or cell types suggesting that their genes could be subjected to differential regulation (15–19). However, the mechanisms for differential regulation of tRNA genes remain largely unknown.
In bacteria, the number and distribution of tRNA genes and the consequences of their organization require investigation and a comprehensive view is still lacking. Two organization patterns were reported: in most of the species inspected so far, genes were dispersed as individual genes or formed short arrays, whereas in species of the Firmicutes phylum, tRNA genes were observed to cluster in few long arrays (20–23). For instance, the 62 tRNA genes in the Bacillus subtilis genome are organized in eight arrays (22). The reasons for these two contrasting organization patterns and their influence on cell function are still unclear. Co-transcription of arrayed tRNA genes in B. subtilis led to the proposal that a reduction of transcriptional units would help coordinate and adjust tRNA expression dependent on growth rate (22,24).
In species outside of the Firmicutes phylum, long tRNA gene arrays encompassing 26–39 tRNA genes were reported (20,25–27). The spotted phylogenetic distribution of these species among phyla and within each phylum (20,25,26) suggested that these long tRNA gene arrays would disseminate by horizontal gene transfer (HGT), a hypothesis that found support in the observation of similar arrays in plasmids, conjugative elements and the genome of bacteriophages, which are known vectors for HGT (20,25,27–29). In line with this is the observation of sister species with high genome identity, similar physiology and lifestyle that differ only (or mostly) in the presence/absence of a tRNA gene array (20,26,30), which raises questions about the function of these arrays and the advantages they may provide to the host. Information on the role of these long tRNA gene arrays is very limited (26,30). The very few studies on this issue have shown that although some tRNAs are potentially functional, the arrays show traits of cryptic genetic elements as they are silent or poorly transcribed and their deletion does not provoke phenotypic alterations in a wide variety of conditions (26,30–32). Many questions on cryptic tRNA gene arrays remain unanswered and require in depth investigation, including (i) whether they are transcribed and if so, in which conditions, (ii) how their expression is controlled, (iii) whether the encoded tRNAs are functional, (iv) whether upon acquisition they add to the original tRNA gene set or replace original genes or (v) how a sudden increase in the number of tRNA genes imposed by an invading array can impact translation.
In this work, we investigated the organization of tRNA genes in major bacterial phyla and show that leaving aside Firmicutes and Tenericutes, individual genes are the most prevalent organization for most other bacterial phyla, although tRNA gene arrays of two types are also observed. These two types of arrays differ in many aspects, including their origin. Long tRNA gene arrays (L-arrays) were observed in species with a sprinkled phylogenetic distribution indicating their dissemination by HGT, which is consistent with previous reports. Functional information on the L-array of the cyanobacterium Anabaena sp. PCC 7120 was obtained. The L-array of this organism is generally silent but becomes largely induced when translation is impaired, a condition here referred to as translational stress. Regulation occurs through direct repeats in the promoter of the array. Similar direct repeats are also present upstream of some co-regulated genes, including rtcB, encoding a ligase likely involved in tRNA repair. tRNAs encoded in the array operate in the context of the response to translational stress, a global response that promotes a thorough re-programming of cell physiology in two phases. The L-array is induced in the second phase and favors cell survival. The role of these tRNAs in the context of the response to translational stress is discussed.
MATERIALS AND METHODS
Oligonucleotides used in this work are listed in Supplementary Table S1. Construction of Anabaena sp. PCC 7120 derivative strains, promoter mapping by 5′-RACE, competition experiments, real-time PCR and detection of mistranslated peptides are described in Extended Materials and Methods in Supplementary File S1.
Analysis of tRNA gene distribution in bacterial genomes
The sequence of Anabaena sp. PCC 7120 tRNA genes is included in Supplementary Dataset S1H.
The tRNA Gene DataBase ‘tRNADB CE’ (Abe et al., 2010) was used to retrieve reliable sequence information of 497099 tRNA genes from complete genomes: 8634 bacterial chromosomes (trna_sequence_cmp_bac_1 data set) plus 466 plasmids (trna_sequence_plasmid_1 dataset), as in November 2019. Dataset information included the positioning of individual tRNA genes in each genome as well as species name, amino acid, anticodon, sequence ID and genome ID. The latter was used to retrieve genome information from NCBI such as genome size, strain name, shape (linear or circular) and Gen Identifier. NCBI and tRNADB-CE database information were merged. When different, NCBI strain names were used over those of tRNADB-CE.
A prospective analysis was performed to identify and remove unpaired plasmids (without the corresponding chromosome), duplicated genomes, genome misannotations, as well as overrepresented species with a common tRNA content and arrangement such as hundreds of Salmonella enterica, Escherichia coli or Campylobacter jejuni. However, as described by Tran et al. (20), closely related strains differing in tRNA gene arrangement were maintained to evidence array differences in short evolutionary distances. The final dataset contained 254131 tRNAs from 4313 organisms mainly related to 22 Phyla/Classes and a miscellaneous assembly of 22 less represented groups (Supplementary Dataset S1A–D).
Excel software was used to merge and analyze data and to generate dynamic tables. Data were sorted according to genome ID and tRNA start position. We identified tRNA array units as those predicted to be organized in operons. Operon predictions were based on intergenic distances (IGD) between same-direction adjacent tRNA pairs. These distances were calculated as start minus end positions of adjacent genes. The maximum IGD for two genes to be considered a cluster was estimated based on IGDs distribution (Figure 1). A putative operon is an ordered series of two or more tRNA genes separated less than this maximum distance between them. Circularity or linearity of genomes was taken into account. We utilized the bacterial phylogenetic tree of Parks et al. (33), which was inferred by applying FastTree to a concatenated alignment of 120 ubiquitous single-copy proteins (Bact120 dataset). Subtrees were selected and pruned using Archaeopteryx tree viewer (34).
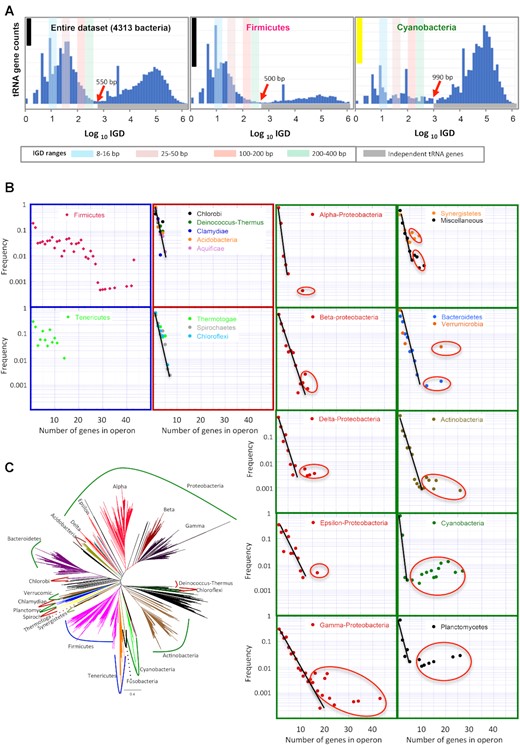
Organization of tRNA genes in bacterial genomes (A) Distribution of intergenic distances (IGD) between adjacent tRNA genes in the entire dataset of 4313 Bacteria, Firmicutes and Cyanobacteria. Histogram bars correspond to logarithmic intervals in the x axis. Ordinate axis represents relative counts (i.e. the frequency of two tRNA genes being separated by a particular distance). Ordinate axis represents gene counts, and the scale is different for each plot. For comparison, scale bars are shown representing 100 genes (yellow bar) and 4000 genes (black bar). Red arrows point the maximum IGD for two adjacent tRNAs to be considered an operonic pair. Colored vertical bars label frequent intervals of the multimodal distribution. Grey horizontal bar (bottom) labels the distribution of independent tRNA genes (i.e. not clustered with other tRNA genes). (B) Plots represent the frequency of individual genes and tRNA arrays in different bacterial Phyla. Plots with the same pattern are enclosed with a color frame. The straight lines correspond to an exponential regression line to the most abundant arrangements and ovals enclose outlier points that do not fit the exponential. (C) Reference tree of the bacterial radiation as reported by (33) is shown to illustrate the phylogenetic relation of bacterial phyla analyzed in this work. Curve lines indicate major bacterial phyla and are colored according to the color code of frames in (B).
Codon usage information for each coding sequence was retrieved from the Kazusa Codon Usage Database (35). The information for the analysis of synteny conservation was obtained from the Integrated Microbial Genome database (36).
Organisms and growth conditions
Anabaena sp. PCC 7120 and derivative strains were cultured at 30ºC under continuous illumination (75 μE m–2 s–1) in BG11 medium (37) bubbled with a mixture of CO2 and air (1% v/v) and in this case supplemented with 10 mM NaHCO3. For carbon deprivation experiments, cultures were not supplemented with NaHCO3 and were aerated with air previously bubbled through a solution of 1N KOH to trap CO2. For the preparation of solid medium 1% (w/v) Difco agar was added to BG11. When indicated, cultures were supplemented with N,N,N',N'-tetrakis(2-pyridilmethyl)ethylenediamine (TPEN) at a final concentration of 20 μM, L-methionine sulfoximine (MSX) at a final concentration 2.5–40 μM, 1,1′-dimethyl-4,4′-bipyridinium dichloride (methyl viologen, MV) at a final concentration 2.2 μM or hydrogen peroxide at a final concentration 200 μM.
The growth rate (μ) was calculated according to the equation μ = (ln(ODf)-ln(ODi))/t, where ODi is the optical density at 750 nm of the culture at the beginning of the experiment, ODf is the optical density of the culture 24 h after, and t is the time between both measurements.
Escherichia coli strain DH5α was used as a recipient for cloning. E. coli was grown in Luria-Bertani medium supplemented with antibiotics at standard concentration when required (38).
RNA preparation and analysis
Total RNA isolation was carried out as described in (39). DNA traces were eliminated by incubation with Turbo DNase (Ambion) following the instructions of the manufacturer.
Small RNA (sRNA) was isolated from 40 ml Anabaena cultures containing 3–6 μg chlorophyll ml–1. Cultures were harvested, washed with 50 mM Tris-HCl, pH 7.5, 100 mM EDTA and resuspended in 1 ml of TRIsure (Bioline) and 200 μl of chloroform. The aqueous phase was recovered after centrifugation at 12000 × g for 15 min at 4ºC and supplemented with 30% isopropanol. After centrifugation for 15 min at 4500 × g, the isopropanol content of the supernatant was adjusted to a final concentration of 60% and centrifuged at 4500 × g for 25 min. The pellet was washed with 70% ethanol and the sRNA was resuspended in 30–50 μl DEPC-H2O.
For northern assays, 5 μg total RNA or 1–2 μg sRNA were transferred to Genescreen Plus membranes (Dupont) and subjected to hybridization with 32P-labeled DNA probes. Labeling was carried out by annealing dsDNA fragments with oligonucleotides of the non-coding strand of the corresponding gene (Supplementary Table S1) and extended with Klenow polymerase in the presence of 32P-α-dCTP. Labeling of probes specific for tRNAs was performed by annealing DNA oligonucleotides encompassing nucleotides 1–73 of each tRNA with 17–20 nt oligonucleotides complementary to the 3′ end of the tRNA (Supplementary Table S1) and extension with Klenow polymerase in the presence of 32P-α-dCTP.
Denaturing polyacrylamide gel electrophoresis for detection of tRNA fragments
About 1 μg sRNA preparations from Anabaena 7120 cultures were resolved in 8 M urea, 10% polyacrylamide gels using TBE (89 mM Tris-borate, 89 mM boric acid, 2 mM EDTA) as running buffer. Nucleic acids were transferred to nylon membranes (Genescreen Plus, Perkin Elmer) and hybridized to 32P-labeled specific probes at 55ºC.
Acid urea polyacrylamide gel electrophoresis
About 1 μg of sRNA purified from 40 ml cultures of Anabaena as described above was loaded on 8 M urea, 6.5% acrylamide gels, electrophoresed as described (40), transferred to Genescreen Plus membranes (Dupont) and hybridized to 32P-labeled probes.
Polysome isolation
Polysomes were isolated following the procedure described by Qin y Fredrick (41) with modifications. About 300 ml Anabaena cultures in exponential phase incubated under culture conditions for 24 h with 0.2 μM methyl viologen were supplemented with 500 μg ml-1 chloramphenicol for 3 min and cells were quickly harvested by filtration through 0.2 μm pore size nitrocelulose filters, briefly washed with cold 50 mM Tris-HCl pH 7.5 y 100 mM EDTA, pH 8, containing 500 μg ml-1 chloramphenicol and frozen in liquid nitrogen. Pellets were resuspended in cold lysis buffer (10 mM Tris-HCl, pH 8, 10 mM MgCl2 and 1 mg ml-1 lysozyme) and incubated for 15 min on ice and subjected to two rounds of freezing-thawing in liquid nitrogen, supplemented with 0.3% sodium desoxycolate (w/v) and centrifuged at 12000 × g for 10 min at 4ºC. The supernatant was applied on 7–50% sucrose gradients and centrifuged at 35000 rpm for 3 h at 4°C in a swinging bucket rotor SW-41 Ti (Beckman). Gradients were fractionated by the use of a pump connected to a UA-6 ultraviolet absorbance detector (Teledyne ISCO). RNA from the fractions was extracted with phenol:chloroform (1:1, v:v), precipitated with ethanol and treated with Turbo DNase (Ambion) to eliminate DNA. About 1 μg RNA from the polysome fraction and, as a control, 1 μg total RNA from Anabaena were subjected in parallel to RT-PCR using Superscript III reverse transcriptase (Invitrogen).
Library preparation for RNA-seq and data analysis
RNA-Seq and NG-sequencing was done at the Genomics Core Facility of Cabimer (Seville, Spain). About 250 ng of total RNA isolated as indicated above was used to prepare libraries compatible with Illumina sequencing. Libraries were prepared using the Zymo-Seq RiboFree™ Total RNA Library Kit (Zymo, Cat. No. R3000) following the instructions of the manufacturer and subjected to Illumina NextSeq 500 sequencing.
Sequencing raw data consisted of fastq files for each sample comprising approximately 5 millions 75 nt long single-end reads. Quality control was performed using FASTQC (https://www.bioinformatics.babraham.ac.uk/projects/fastqc/). Nostoc sp. PCC 7120 genome assembly and annotation ASM970v1, INSDC Assembly GCA_000009705.1 available from Ensembl bacteria (https://bacteria.ensembl.org/Nostoc_sp_pcc_7120) was used as reference genome. Reads were mapped with HISAT2 (42) using default parameters. Transcripts were assembled and their expression level estimated with StringTie (43) using default parameters. The Bioconductor R package Ballgown (44) was used to import data and estimate gene expression as RPKM (Reads Per Kilobase of exon and Million of mapped reads). The Bioconductor R package limma (45) was used to determine differentially expressed genes between the different time points using a fold-change threshold of 2 and a q-value threshold of 0.05. Function implemented in the R package cluster were used to perform hierarchical and partional around medoids clustering. The silhouette criterion was used to determine the best combination of clustering algorithm and number of clusters to represent the underlying structure in our gene expression data. The R script used in this analysis is freely available from the following GitHub repository: https://github.com/fran-romero-campero/nostoc.
Protein quantification
Protein content in Anabaena cultures was estimated using a modified Lowry procedure (46). About 200 μl samples were supplemented with 50 μl 0.5 N NaOH and 750 μl of a solution containing 2% (w/v) Na2CO3, 0.4% (w/v) NaOH, 0.16% (w/v) sodium-potassium tartrate, 1% (w/v) SDS, 0.04% (w/v) SO4Cu·5H2O. After 5 min incubation at 37ºC, samples were supplemented with 75 μl of 50% (v/v) Folin-Ciocalteus reagent and incubated for 5 min at 37ºC and their absorbance at 750 nm was registered. The protein concentration of the samples was determined by carrying out a parallel assay with samples containing known concentrations of bovine serum albumin.
Confocal microscopy
Anabaena filaments expressing GFP were visualized using a HCX PLAM-APO 63 × 1.4 NA oil immersion objective in a Leica TCS SP2 confocal microscope. GFP was excited with 488 nm irradiation from an argon ion laser. Fluorescence emission was monitored across windows of 500–540 nm.
Analysis of sequence motifs
Conserved sequences observed in promoters were annealed using Clustal Omega (https://www.ebi.ac.uk/Tools/msa/clustalo/) and the output was processed by Weblogo software (https://weblogo.berkeley.edu/logo.cgi) to deduce the sequence signature according to the conservation of nucleotides.
For the genome wide identification of gene promoters containing direct repeats, first the 20 nucleotide sequence encompassing the repeats that overlap the -10 box and the transcriptional start site (TSS) from the promoters of the trn operon, all8564, rtcB and dpsA were annealed and a signature sequence was deduced as explained above. Genome wide identification of promoters containing the signature sequence was performed based on available previous TSS identification (47) focusing on a window -18, +12 around the TSS. The function matchPattern form the Bioconductor R package Biostring was used to search for the repeats formalized as the DNA motifs TGTWNWWNWNNWGTANYNWA and TGTWNWWNWNNNWGTANYNWA.
Statistics
Data were displayed using Kaleidagraph (Synergy software). Parametric and non-parametric comparisons of means and medians, respectively, were performed using JASP 0.14 (48).
RESULTS
Number and distribution of tRNA genes in bacterial genomes
The information in the tRNADB-CE database (49,50), a manually curated tRNA database, was used to shed light on the number of tRNA genes and their distribution in bacterial genomes. According to tRNADB-CE, the number of tRNA genes in free-living bacteria averages 59 and ranges from 31 in Pelagibacter ubique to 219 in Tumebacillus avium strain AR23208 (Supplementary Dataset S1B). Bacterial genomes contain stand-alone tRNA genes, but also pairs, triplets or longer clusters. Gene clustering in prokaryotes is informative and, in many cases, genes are co-transcribed forming operons, which entails that they impact cell physiology as a unit. Therefore, it is important to determine how tRNA genes organize. Rather than setting an a priori arbitrary criterion to define potential tRNA gene operons, the intergenic distance (IGD) between same-direction contiguous tRNA genes was analyzed, taking IGD as the most basic informative feature for operon prediction to date, as operonic genes tend to have shorter IGD. Establishing the threshold IGD is the key point in this type of studies and published methods use different threshold values (reviewed in (51)). In the absence of objective criteria, IGD was analyzed in our entire dataset (4313 bacterial genomes) and in major bacterial phyla (Figure 1A and Supplementary Figure S1). Plotting of IGD against the relative number of observations showed a multimodal lognormal distribution with peaks around 10, 50, 200 bp and a wide peak at the right side of the graph with an IGD maximum around 100 000 bp, which corresponds to independent genes separated by long distances. This wide peak starts at the valley indicated by a red arrow, which defines the shortest distance for two genes to be independently transcribed. Based on distribution analysis, this is arguably an objective criterion to set this value as the longest IGD for two adjacent tRNA genes to be considered as potentially operonic (Figure 1A). When this procedure was applied independently to bacterial phyla and classes (Supplementary Figure S1), it was observed that this threshold distance (red arrow) varied, ranging from 200–250 bp to 800–1000 bp, highlighting the need to calculate the threshold IGD in a phylum/class-specific manner to increase prediction accuracy and prevent misannotation of potential operons.
Comparison between bacterial phyla evidenced two contrasting patterns. A first pattern, represented by Firmicutes in Figure 1A and also observed in Tenericutes and Fusobacteria (Supplementary Figure S1), showed a high number of observations toward the left of the plot corresponding to short IGDs, indicative of operonic organization of tRNA genes, and a low wide peak at the right of the plot. Most other bacterial phyla (Supplementary Figure S1) represented by Cyanobacteria in Figure 1A showed a different pattern, where the distribution is biased toward long IGDs. This indicated that tRNA genes are separated by thousands of base pairs, evidencing a disperse distribution in the genome. However, it is important to stress that peaks for distances below the threshold IGD were observed, indicating that potential tRNA gene operons also exist in species of these phyla (Figure 1A and Supplementary Figure S1).
To get a deeper insight, an analysis was conducted to investigate the origin of potential tRNA gene operons. As a starting hypothesis, it was considered that operons would evolve by accretion of genes. This entails that long operons would be less frequent, their frequency decreasing according to an exponential function as new genes are recruited. To test this hypothesis, the frequency of stand-alone tRNA genes, gene pairs, triplets or longer arrays was analyzed in major bacterial phyla. The accretion hypothesis was rejected in two closely related phyla, Firmicutes and Tenericutes, where stand-alone tRNA genes are rare and operons are common, their frequency not fitting to an exponential function (Figure 1B,C), indicating that in these phyla operon evolution is more complex. By contrast, eight phyla (Deinococcus-Thermus, Chlorobi, Chlamydiae, Acidobacteria, Aquificae, Thermotogae, Spirochaetes and Chloroflexi, Figure 1 B,C) showed a pattern where the majority of tRNA genes are stand-alone genes, and the frequency of pairs, triplets and longer arrays decreased exponentially, as expected for arrays that evolved by gene accretion. Therefore, these potential operons, which are of variable size, will be hereafter referred as ‘A-arrays’, from ‘Accretive’. A third pattern was observed in seven phyla (Sinergistetes, Bacteroidetes, Verrucomicrobia, Planctomycetes, Actinobacteria, Cyanobacteria and all classes of Proteobacteria) and the miscellaneous group (Figure 1B,C), where stand-alone genes are by far the most common and two types of arrays were observed: A-arrays (notice the points that fit to the exponential regression line) and long arrays, encompassing up to 43 genes, that occur at anomalous high frequencies, much higher than expected by the accretion of genes (encircled points in Figure1B), indicating a distinct evolutionary origin. These will be hereafter referred as ‘L-arrays’, from ‘Long’. It is important to remark that L-arrays are not widespread, being present only in some species dispersed in the radiation of the above-mentioned phyla (see below and Supplementary Dataset S1B), arguing against a vertical inheritance of these elements.
A-arrays commonly, though not always, showed a repetitive pattern, whereas L-arrays are rarely periodic (Supplementary Dataset S1D). Regarding the propensity of particular tRNA genes to be found in arrays, it was observed that all isoacceptor genes could be found in arrays although frequencies varied, ranging from 0.36 (tRNASer) to 0.93 (tRNAIle). Some of these differences were supported by observations. For instance, the genes for tRNAIle and tRNAAla are arrayed at a high frequency (0.93 and 0.7, respectively), in line with their presence within rRNA operons in most bacteria. Analyses at the phylum level showed a high variability between phyla. For instance, the frequency of tRNAAsp to be found in arrays ranges from 0.22 in Spirochetes to 0.94 in beta-Proteobacteria (Supplementary Dataset S1E, F).
Species that contained L-arrays were found to have a high content of tRNA genes. This became apparent when the number of tRNA genes was represented versus the genome size (Figure 2A). In species with only A-arrays a modest correlation was observed between both parameters (Figure 2A, panels with a grey background, see also Supplementary Figure S2). Importantly, in phyla with A- and L-arrays, lack of correlation was observed (Figure 2A, panels with a white background, see also Supplementary Figure S2) and it was partially due to the anomalously high number of tRNA genes in species with L-arrays, which is higher than expected by their genome size (dark dots in plots on a white background in Figure 2A). This suggested that L-arrays contribute supernumerary genes, increasing the total number of tRNA genes of the host. In line with this is the existence of closely-related species with no L-arrays, whose tRNA gene number fit to that expected by their genome size. This further supports a foreign origin for L-arrays and probable acquisition by HGT. Though L-arrays are associated to a high number of the host tRNA genes, it is worth noting that in most cases, they do not contribute to a higher variability of tRNA isoacceptors (i.e. a higher variability of anticodons) but contribute to isodecoder redundancy (Figure 2B and Supplementary Figure S3).
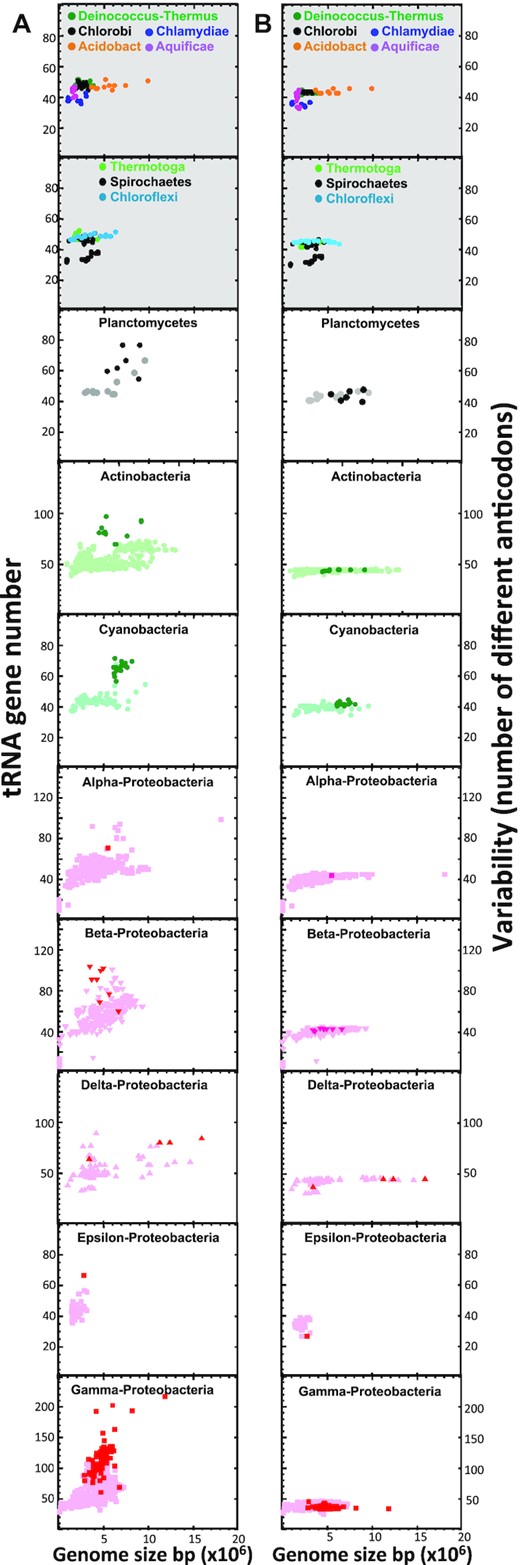
Species with L-operons have a high number of tRNA genes but not a wider variability of anticodons. Plots represent the number of tRNA genes versus the genome size (A) or the number of different anticodons in the tRNA set versus the genome size (B). The top panels on a grey background correspond to phyla with only A-operons. Plots on a white background contain A- and L-operons. Species with L-operons are represented with dark symbols.
Expression of L-arrays
The presence of L-arrays in a wide variety of bacterial species was intriguing and there was little information about their expression or their possible involvement in cellular processes. To gain functional information on L-arrays, we focused on the model cyanobacterium Anabaena sp. PCC 7120 (also known as Nostoc sp. PCC 7120, hereafter referred to as Anabaena 7120), a photosynthetic cyanobacterium amenable to genetic manipulation. Anabaena's genome contains 74 tRNA genes, 48 of them scattered in the chromosome organized as 37 individual genes, 4 pairs and one triplet. In addition, 26 genes in tandem form an L-array in the ∂ plasmid (Figure 3A) (52). Similar arrays are observed in the chromosome or in plasmids of cyanobacterial species, but are absent in many other species of this phylum.
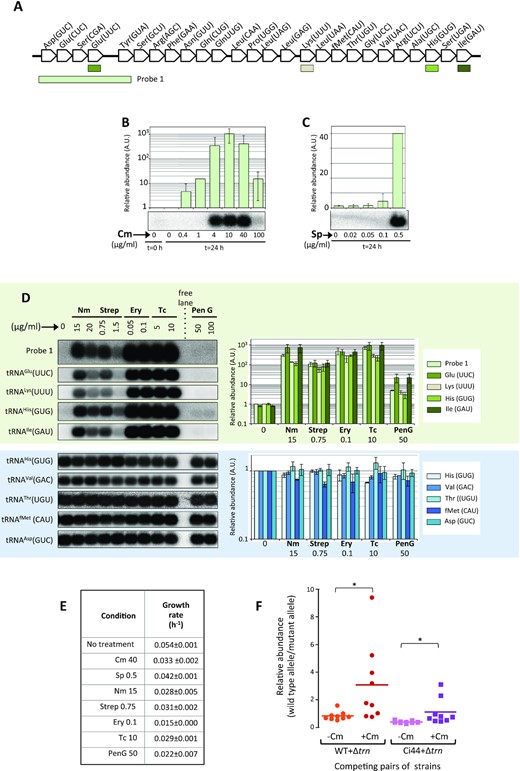
Anabaena 7120 trn operon is induced by antibiotics targeting the ribosome. (A) The Anabaena 7120 trn operon is depicted. Genes are indicated by their cognate amino acid and their anticodon. The position of probes used for hybridization in B, C and D is shown. (B) Northern hybridization was performed using 2 μg of sRNA preparations per lane from Anabaena cells before treatment (Control 0), or from cells cultured for further 24 h with no supplements (Control 24 h) or cultured for 24 h with the indicated concentration of chloramphenicol (Cm). Probe 1 was used for hybridization. The histogram represents the average (n = 2) relative intensity of each lane respect to the control without treatment (0) and error bars correspond to the standard deviation. (C) Northern assay was performed like in B with sRNA preparations from cells cultured for 24 h in the presence of the indicated concentrations of spectinomycin (Sp). Other details are like in (B). (D) Northern assay was performed using 2 μg sRNA preparations from cells cultured for 24 h in the absence (0) or presence of the indicated concentrations of neomycin (Nm), streptomycin (Str), erythromycin (Ery), tetracyclin (Tc) or penicillin G (Pen G) and hybridized to the probes indicated at the left of hybridization panels for operonic (green background) or housekeeping (blue background) tRNAs. The histogram represents the average (n = 2) relative intensity of each lane respect to the control in the first lane and error bars correspond to the standard deviation. Probes are indicated at the right. (E) Anabaena cultures were incubated in the presence of the indicated concentration of antibiotics (μg ml–1) for 24 h. The growth rate is indicated for each treatment. Numbers correspond to the mean ± standard deviation of two independent experiments. (F) Competition assays. The plot represents the relative quantities of the wild-type allele (indicating the presence of the trn operon) and the mutant allele (indicating the deletion of the trn operon). The relative abundances of these alleles were adopted as a proxy to inform about the proportion of cells in mixed suspensions (indicated at the bottom) after 5 days of culture in the absence or presence of Cm. Numbers in the ordinary axis correspond to 2ΔΔct as explained in Extended Materials and Methods. * indicate P < 0.002 (paired Wilcoxon signed rank test).
In Anabaena 7120, all chromosomal tRNA genes are expressed at a high level under standard laboratory conditions (47,53) and are sufficient to sustain translation (26). Therefore, the 48 tRNAs encoded by the chromosomal subset will be hereafter referred as housekeeping tRNAs.
The L-array was previously shown to be expressed at an extremely low level, orders of magnitude lower than that of housekeeping tRNAs. Despite this, it was possible to show that it is an operon, transcribed as a single RNA that is quickly processed into the individual tRNAs (26). tRNAs encoded in this operon would only have an impact if their abundance is non-negligible, which prompted us to initiate a quest for conditions where the operon was induced. A wide screening showed a robust induction (102–103-fold) when cultures were exposed to sub-lethal concentrations of antibiotics that target the ribosome, including chloramphenicol, spectinomycin, streptomycin, neomycin, erythromycin or tetracycline (Figure 3B,C and D-green background). By contrast, only marginal induction was observed upon treatment with antibiotics that target cell components not involved in translation, like penicillin G, nalidixic acid, ciprofloxacine, berberine or rifampycin used at concentrations that reduced growth to a similar extent (Figure 3 D,E and Supplementary Figure S4A). Importantly, housekeeping tRNAs did not show changes in any of the conditions tested (Figure 3D, blue background). Control experiments showed that the increase in abundance of operonic tRNAs did not result from an increase in the copy number of the ∂ plasmid (Supplementary Figure S5A). Another important observation is that upon induction, the abundance of tRNAs increased slowly, reaching maximal levels 24 h after the onset of stress and remaining constant for at least another 24 h (Figure 6D). The lower induction level observed with high concentrations of some antibiotics (see e.g. the last lane in Figure 3B) was suspected to result from a systemic failure of cell growth provoked by the high antibiotic dose.
Induction to varying extents was also observed under a variety of stress conditions, including nutritional stress (i.e. carbon, nitrogen or divalent metal deprivation) or stress induced by treatment with oxidizing agents like H2O2 or methyl viologen, but no induction was observed in many other conditions (Supplementary Figure S5B–F). Signals observed in northern blots were of about 70–100 nucleotides, regardless of whether the probe matched an individual tRNA gene, encompassed several genes or the entire operon (Supplementary Figure S5G), which is in line with the reported fast processing of the operon transcript into individual tRNAs (26). We propose to name this operon as the trn operon of Anabaena 7120.
Induction of the trn operon favors survival under antibiotic challenge conditions
Operonic tRNAs are highly induced by ribosome-targeting antibiotics. To check whether they played any role in these conditions, long-term (5 days) competition experiments were performed. Mixed cell suspensions with equal amounts of cells of the wild type and the Δtrn strain, a deletion mutant lacking the operon, were prepared and cultured for five days in agitation in the absence or the presence of 40 μg ml–1 Cm. As shown in Figure 3F, after five days in the absence of Cm the proportion of wild-type and mutant alleles in the culture remained close to 1. By contrast, in the presence of Cm, the proportion of the wild-type allele was significantly higher in most cultures. Since at this Cm concentration, the cultures show marginal growth and most of them slowly declined after the second day, the higher proportion of the wild type allele should not be regarded as the result of the overgrowth of the wild-type strain over the Δtrn strain, but as the consequence of a more robust survival of the wild-type under prolonged stress. To corroborate that such a phenotype was due to the presence of the trn operon, the Δtrn deletion mutant was complemented in trans and the resulting strain (Ci44) was used in competition experiments with the Δtrn strain. As shown in Figure 3F, reintroduction of the trn operon in the complemented strain improved survival in the presence of Cm.
tRNAs encoded in the trn operon may participate in translation
We next investigated whether the observed contribution of operonic tRNAs to survival occurs through their involvement in translation. As the stimuli that induce the operon are known to impair translation, it was necessary to check whether this process was active under induction conditions. Anabaena cultures were treated with different concentrations of chloramphenicol (Cm) and the concentration of total cellular protein was followed throughout the experiment (Figure 4A). The increase of protein content in cultures was less pronounced as the Cm dose increased. In cultures with the highest concentrations of Cm (4–100 μg ml–1) a slight decrease in protein concentration was observed through the first 24 h (Figure 4A). However, though at a slow rate, the protein content of cultures increased after the 24 h time point (see inset in Figure 4A), which indicated that in these cultures protein synthesis was active at the same time as tRNAs encoded in the operon were present (Figure 4B). These results were further corroborated in a strain where the expression of GFP was placed under the control of the promoter of the trn operon (strain Ci26). As shown in Figure 4C, GFP fluorescence was detected 48 h after addition of chloramphenicol to the cultures, further demonstrating that translation is active in conditions where operonic tRNAs are present. Thus, the trn operon is induced when translation is challenged but not totally abrogated, conditions that will be referred to as translational stress.
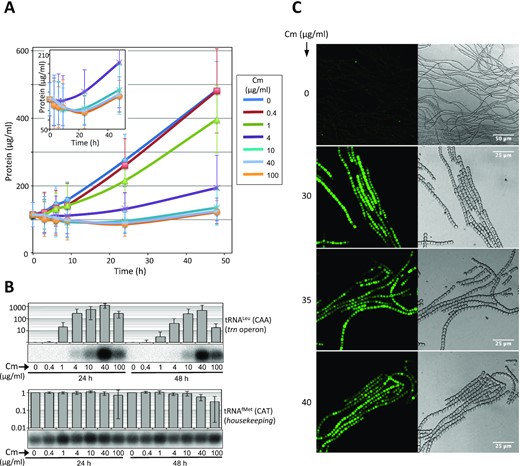
Protein synthesis is active under the conditions inducing the trn operon. (A) The concentration of protein of cultures used in A was monitored through time. The inset shows a zoom of the plot reducing the scale of the vertical axis. Only the cultures with the highest concentrations of Cm are shown. (B) 2 μg per lane of sRNA preparations from Anabaena cells cultured for 24 or 48 h in the presence of the indicated concentrations of chloramphenicol (Cm) were used for Northern hybridization with the probes indicated at the right. Histogram bars represents the average (n = 2) relative intensity of each lane respect to the control in the first lane and error bars correspond to the standard deviation. (C) Cells of the Ci26 strain expressing Strep-GFP-His under the control of the promoter of the trn operon, were cultured for 48 h in the absence or presence of Cm at the indicated concentrations. GFP fluorescence and bright field images are shown in left and right panels, respectively.
To further test the possible involvement of operonic tRNAs in translation, acid gel electrophoresis (40) was used to analyze whether tRNAs were aminoacylated in vivo. As observed in Figure 5A, all housekeeping tRNAs tested (Figure 5A, left column) were aminoacylated both under non-inducing (lane 2) and inducing conditions (lane 3). Operonic tRNAs (Figure 5A, green background) were not detected in non-inducing conditions (lane 2). Importantly, absence of signal in this lane evidenced that none of the probes cross-hybridized with housekeeping tRNAs. Results indicated that 23 out of the 26 tRNAs encoded in the operon were detected and aminoacylated in vivo under induction conditions (lane 3). The other three tRNAs were not detected and the corresponding genes can be considered pseudogenes (dashed in Figure 5C).
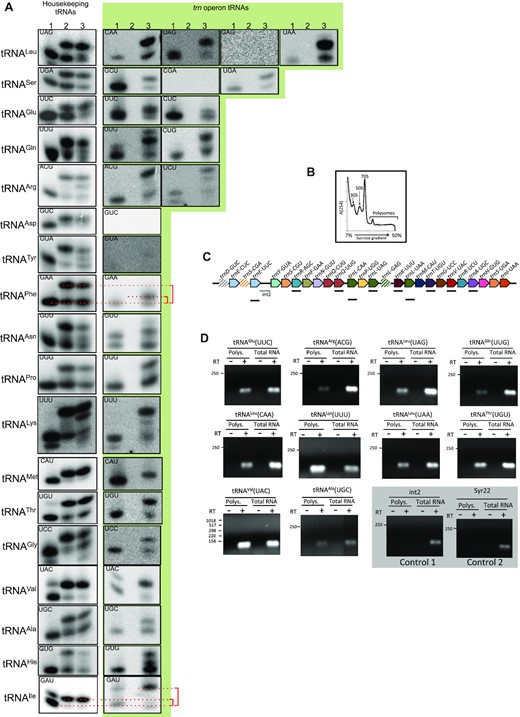
tRNAs encoded in the trn operon may be involved in translation. (A) 1 μg of sRNA preparations from Anabaena cells cultured in the absence (lane 2) or presence (lane 3) of 10 μg ml–1 tetracycline were resolved by acid gel electrophoresis and hybridized with probes for housekeeping tRNAs (white background) or operonic tRNAs (green background). Probes are indicated at the left (tRNA isotype) and inside each panel (anticodon). Lane 1 of each panel corresponds to a control of tRNA from induced cultures deacylated in vitro to indicate the migration position of non-charged tRNAs. (B) Polysomes were isolated from Anabaena cells induced for the expression of the trn operon by culture for 24 h in the presence of 0.2 μM MV. The plot represents the absorbance of fractions of the sucrose gradient at 254 nm (C) A picture of the trn operon is shown indicating the fragments amplified in (D) by RT-PCR. (D) RNA extracted from the polysomal fraction or total RNA from Anabaena cells were incubated (+) or not (−) with retrotranscriptase and amplified by PCR using specific oligonucleotides for the fragments indicated in C or for the Syr22 RNA. Control reactions are shown on a grey background. Numbers at the left of each panel indicate the size of DNA fragments (bp) of a molecular weight marker.
It was observed that for operonic tRNAPheGAA and tRNAIleGAU, the retarded band in acid gel assays, corresponding to the aminoacylated tRNA, showed an aberrant migration when compared with the band of the housekeeping isoacceptor (red brackets in Figure 5A; Supplementary Figure S6A,B). Mobility differences in acid gels may be due to multiple causes, including sequence differences between the housekeeping and operonic isoacceptors, differences in nucleotide modifications or misacylation of the operonic tRNAs (i.e. the ligation of a non-cognate amino acid to its acceptor end). Misacylation of tRNAs may in turn provoke mistranslation, which in several instances was reported advantageous for the survival of microbes under stress conditions (54–58). Although it was not possible to definitively assign the mobility differences observed in acid gels to misacylation, an approach was undertaken to test whether mistranslation was produced in cells under translational stress. No traces of mistranslation were detected for UUC codons (Supplementary Figure S6C,D) despite misacylation being most prominent for tRNAPheGAA in acid gels (Figure 5A), indicating that either the mobility differences in acid gels were not due to misacylation or that misacylated tRNAPheGAA was efficiently excluded from translation by proofreading mechanisms (59).
To gather further evidence of operonic tRNAs involvement in translation, total RNA and RNA from the polysomal fraction were isolated from induced cultures (Figure 5B) and the presence of tRNAs was analyzed by RT-PCR. As shown in Figure 5C and D, all operonic tRNAs tested were detected both in a preparation of total RNA and in the polysomal fraction from the same culture. Crucially, our controls, which are stable sRNAs not involved in translation, were only detected in the total RNA preparation (Figure 5C).
Results above indicate that operonic tRNAs may participate in translation and became most abundant 24–48 h after the addition of Cm to cultures (Figure 4B), which was concomitant with the increase in protein content of cultures observed in Figure 4A. We postulated that operonic tRNAs could be involved in the observed recovery. To address this, cells of the Δtrn strain were tested in an experiment similar to that in Figure 4A, in parallel to the wild type strain. The protein content in cultures of both strains treated with Cm showed similar kinetics, which indicated that operonic tRNAs were not essential for the increase in protein content observed 24 h after the addition of Cm (Supplementary Figure S7A).
Identification of co-regulated genes and regulatory sequences
As a parallel approach to gather functional information on the Anabaena 7120 trn operon, comparisons to L-arrays from other cyanobacterial species were done. Conservation of the central part was observed, which indicated common ancestry, with the caveat that insertions, duplications and deletions appear to have occurred frequently (Supplementary Figure S8). Some protein-encoding genes were observed frequently linked or embedded within L-operons in distinct species (Figure 6A). Conservation of the genomic neighborhood was used to predict ORFs that could be functionally associated and/or co-regulated with the trn operon. For instance, a gene encoding a homing endonuclease of the HNH family was conserved upstream of the L-operon across most species (red arrow in Figure 6A,B). To check for a possible functional relation, the expression of the corresponding Anabaena gene (all8564) was tested and observed to be induced by similar stimuli as the trn operon and with similar induction kinetics upon treatment with chloramphenicol (Figure 6C,D). To gain further insight, the expression of Anabaena genes rtcB and dpsA also identified by genomic neighborhood (Figure 6A,B) but not present around the trn operon of Anabaena was also tested. As shown in Figure 6C, rtcB was induced by similar stimuli as the trn operon, and rtcB and dpsA were both induced by chloramphenicol with similar kinetics as the trn operon (Figure 6D). rtcB encodes a putative tRNA ligase and dpsA a stress-inducible DNA-binding protein. It was thus inferred that genomic neighborhood was indicative of shared regulation and a possible functional relation. Interestingly, the neighborhood of L-operons was enriched in genes encoding proteins involved in RNA processing or in gene translation (Figure 6B).
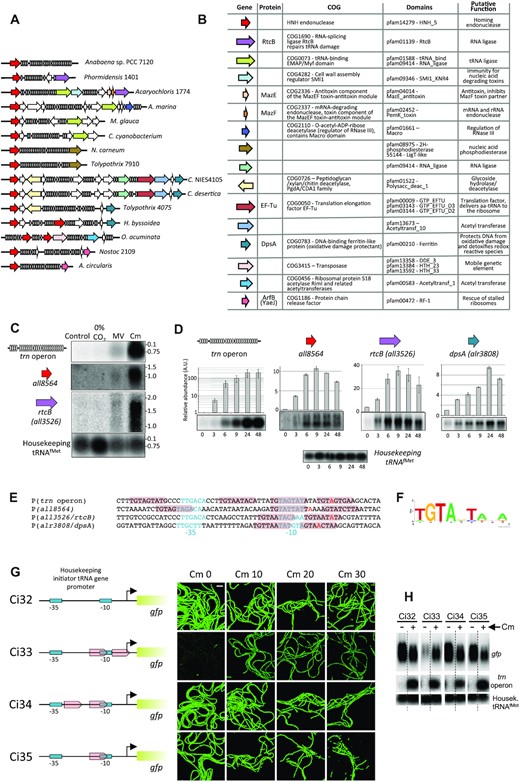
Genomic neighborhood of cyanobacterial L-operons. (A) Comparison of the genomic neighborhood of L-operons in multiple cyanobacterial species. tRNA genes are depicted in grey, genes encoding hypothetical proteins are depicted as empty arrows and those encoding proteins with a known or a putative function as colored arrows. Phormidensis 1401, Phormidensis sp. BC1401; Acaryochloris 1774, Acaryochloris sp. RCC1774; A. marina, Acaryochloris marina MBIC11017; M. glauca, Merismopedia glauca CCAP1448/3; C. cyanobacterium, Chroococcales cyanobacterium CENA595; N. carneum, Nostoc carneum NIES-2107; Tolypothrix 7910, Tolypothrix sp. PCC 7910; C. NIES4105, Calothrix sp. NIES 4105; C. desertica, Calothrix desertica PCC 7102; Tolypothrix 4075, Tolypothrix sp. NIES-4075; H. byssoidea, Hassallia byssoidea VB512170; O. acuminata, Oscillatoria acuminata PCC 6304; Nostoc 2109, Nostoc sp. NIES-2109; A. circularis, Anabaenopsis circularis NIES-21. (B) Genes of the latter group are shown indicating their domain composition and putative function. (C) 5 μg of total RNA from Anabaena cells cultured for 24 h with no treatment (Control), with no carbon source (0% CO2), in the presence of 0.2 μM methyl viologen (MV) or 10 μg ml–1 chloramphenicol (Cm) were used for Northern assays with probes for the genes indicated at the left. Numbers at the right of each panel indicate the size (Kb) of an RNA molecular weight marker. (D) Northerns using total RNA extracted from Anabaena cells cultured in the presence of 40 μg ml–1 Cm for the length of time indicated in hours at the bottom of each panel. the histogram bars represent the average (n = 2) relative intensity of each lane respect to the control in the first lane and error bars correspond to the standard deviation. Details of Northern blots are like in (C). A Northern with a probe of the housekeeping initiator tRNA (tRNAfMet) is shown as control. (E) Comparison of the promoters of genes showing similar regulation. -35 and -10 boxes are indicated in light blue color and the TSS in red. Conserved repeats are highlighted in pink. (F) Weblogo of the conserved sequences in (E). (G) Transplantation of tandem repeats into the promoter of the housekeeping initiator tRNA promoter. -10 and -35 boxes are represented in light blue, tandem repeats as pink arrows, the TSS as a bent arrow and the 5′region of the gene encoding Strep-GFP-His as a green rectangle. Images show GFP-fluorescence of cells of the indicated strains cultured for 36 h at the concentrations of Cm indicated at the top. The bar at the top left panel corresponds to 40 μm. (H) Northern blot of RNA from the indicated strains cultured in the absence or presence of Cm. Probes used for hybridization are indicated at the right. Dashed vertical lines indicate that lanes were not contiguous in the gels, so the image shown is a composite.
To investigate the mechanism mediating the apparent common regulation of these genes, the promoters of the trn operon and all8564 were mapped by 5′-RACE (Supplementary Figure S9) and were compared to those previously mapped for rtcB and dpsA (47). Conserved direct repeats of a 9-nucleotide sequence were observed (Figure 6E, F). In all four promoters, two repeats in tandem spaced by two or three nucleotides overlapped the -10 box and the transcriptional start site (TSS), while in the promoters of the trn operon and all8564 additional repeats were observed at upstream positions (Figure 6E). Transplantation of two direct repeats into the promoter of the housekeeping initiator tRNA at positions overlapping the -10 box and the TSS, turned this strong constitutive promoter into a regulated one that paralleled the regulation of the trn operon (Figure 6G,H). Transplantation of a single repeat or two repeats at other positions did not have such an effect (Figure 6G,H). This result strongly indicated that the repeats overlapping the -10 box and the TSS are responsible for the regulation of the promoters that contain them. A genome-wide search for genes containing similar repeats at such position identified two other genes encoding hypothetical proteins, all4315 and alr1056. The latter shows a very low expression level in all conditions tested by us or others (47,53). By contrast, all4315 was induced in cultures treated with Cm (see below). Interestingly, homologs of this gene were found closely linked to tRNA gene arrays in some cyanobacterial species, which further validates genomic neighborhood as indicative of a common regulation mechanism.
The response of Anabaena to translational stress
As a whole, results shown above suggested that the trn operon and co-regulated genes could be components of a wider response to translational stress. To investigate this, genome-wide analysis of gene expression was performed for non-treated cells and cells cultured for 3, 9 and 24 h in the presence of Cm. RNA-Seq data evidenced that Anabaena 7120 reacts to translational stress by a global re-programming of the transcriptome, with 3246 out of the 6222 annotated ORFs significantly changing their expression levels at least two fold (Figure 7A,B). Three clusters could be distinguished according to their expression kinetics: genes that were early repressed (1496 genes), genes that were early induced (443 genes) and genes that were progressively induced (1307 genes). Northern analysis of genes from the three clusters showed consistent results (Figure 7B) and genes containing direct repeats in their promoters (trn operon, all8564, rtcB, dpsA and all4315) were consistently included in the progressively-induced cluster, which validated the approach. It is worth noting that most genes in this cluster did not contain such regulatory sequences, which indicated that the regulon of genes with direct repeats would represent a small subset within a large cluster of progressively induced genes in the translational stress response.
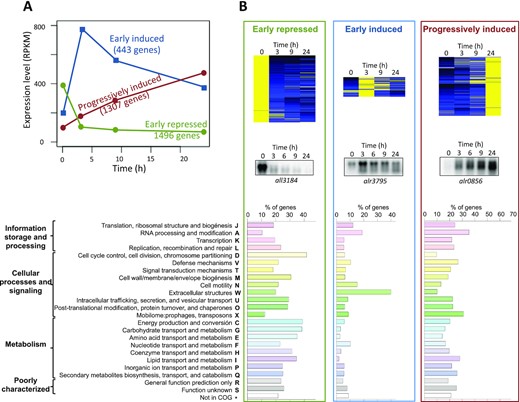
Response of Anabaena 7120 to translation stress. (A) Average profiles of expression of Anabaena 7120 genes in the response to translational stress. Only responsive genes (i.e. those whose expression changes >2-fold) are shown. (B) Heatmaps of genes in the three clusters are shown at the top. A northern experiment used to validate each group is shown below. The distribution of genes in COG categories is shown at the bottom. Bar length in the histogram represents the percentage of genes with respect to the whole number of genes in the same category
COG analysis of regulated genes was performed to understand the physiological re-programming imposed by translational stress (Supplementary Table S2). The cluster of early-repressed genes was enriched in genes involved in cell division and major metabolic functions (COG categories D, C, G, E, F, H, I and P), including energy production and carbohydrate, amino acid and nucleotide metabolism (Figure 7B). Early-induced genes were enriched in genes involved in extracellular structures and RNA processing and modification (W and A categories). The cluster of progressively induced genes was enriched in genes involved in RNA processing and modification, the mobilome, and defense mechanisms (categories A, X and V).
Since the neighborhood of L-operons was enriched in genes involved in gene translation or in RNA processing (Figure 6A), the analysis was focused on genes in categories J (translation, ribosomal structure and biogenesis) and A (RNA processing and modification). Early events in the response to translational stress were the downregulation of genes encoding 11 aminoacyl-tRNA synthetases (aaRSs) and elongation factor G (EF-G) (Supplementary Table S2) and the induction of genes encoding ribonucleases of the VapC, MazF and RelE family (Figure 8A–C, Supplementary Table S2). These RNases are part of the so-called type II toxin-antitoxin (TA) systems that are abundant and widespread in bacteria (60,61). Toxins are proteins of diverse nature that antagonize a variety of essential processes, including translation or DNA replication. Under normal conditions, toxins are blocked by an inhibitor, named antitoxin, generally encoded by the upstream gene. Antitoxins are labile and degrade under stress conditions, liberating the toxin partner. In general, toxins of the VapC family cleave specific tRNAs, most commonly at the anticodon loop, those of the MazF family cleave rRNA and free mRNA and those of the RelE family cleave ribosome-bound mRNA (60,61). These observations suggested that the early response to translational stress would promote a further downregulation of the translation rate.
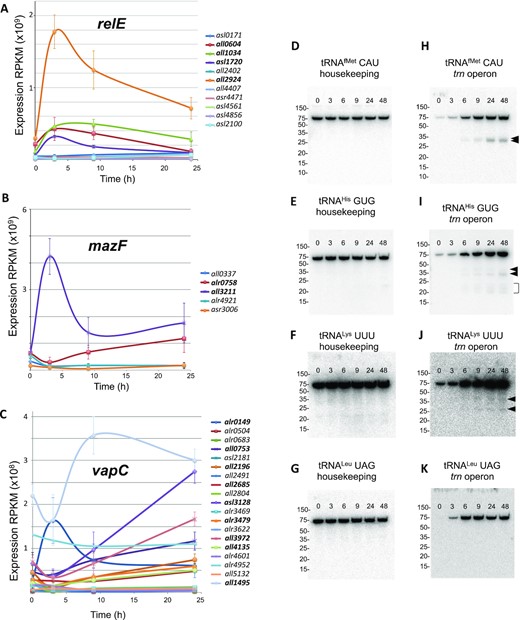
Late events in the response to translational stress. (A) Plot representing the expression of genes encoding toxin RNAses of the RelE family. The plot shows average values of RNA-Seq data and error bars correspond to the SEM (standard error of the mean) (n = 3). Induced genes are indicated in boldcase at the right. (B and C) Plots representing the expression of genes encoding toxin RNAses of the MazF and VapC family. Details are like in (A). (D–K) Panels show northern blots of tRNA from Anabaena cells cultured in the presence of chloramphenicol for the length of time indicated (in hours) at the top of each panel and resolved by denaturing polyacrylamide gel electrophoresis. Probes used for hybridization are indicated at the top of each panel. Numbers at the left indicate the migrating positions of molecular weight markers (GeneRuler Ultra Low Range, Thermo). Putative cleavage products are indicated by arrows.
Other genes involved in translation, ribosomal structure and biogenesis were induced either early or progressively during the response. One such group is enriched in genes encoding ribosomal proteins and factors for ribosome biogenesis and maturation, most of the latter being induced late in the response (Supplementary Table S3). Late induction of genes involved in RNA processing and modification, including some involved in RNA repair like rtcB or the hen1-pnkP operon, was also observed (Supplementary Table S4). These observations appear consistent with the recovery of gene translation observed 24 h after the onset of translational stress (Figure 4).
Some operonic tRNAs are cleaved during the response to translational stress
RNA-Seq data showed the late induction of 7 genes encoding endonucleases of the VapC family, which are likely specific for particular tRNA species (Figure 8C). This prompted us to check the integrity of several tRNAs at different time points after the treatment of cells with Cm. As shown in Figure 8D–K, in late phase 1 and in phase 2 cleavage products were observed for some (Figure 8H–J), but not all (Figure 8K) operonic tRNAs tested. Cleavage fragments increased in abundance with time, in correlation with the expression level of VapC RNases. By contrast no cleavage was observed for the corresponding housekeeping tRNAs (Figure 8D–G).
DISCUSSION
Distribution of tRNA genes in bacterial genomes: origin, evolution and dissemination of tRNA gene arrays
The impact of the organization of tRNA genes has been little investigated and the evolutionary forces that guided their organization as operons or as dispersed genes are thus far not understood. It was proposed that organization in operons, which is the prevalent organization in Firmicutes and Tenericutes, reduces the number of transcriptional units in order to facilitate coordination of tRNA expression with the translation rate (24). While this argument appears rational, evidence shows that in the vast majority of bacteria most tRNA genes are stand-alone independent genes. Hence, it is possible that none of these two organizational patterns offers a selective advantage over the other, so they were fixed in bacterial populations by genetic drift.
Data presented in this work indicate that in species outside of the Firmicutes and Tenericutes phyla, tRNA gene arrays are of two types. Differences between them are multiple, including their origin. A-arrays were proposed to originate by gene accretion based on frequency analysis (Figure 1B). Interestingly, it is common that these arrays show a periodic pattern, which is reminiscent of satellite DNA and is consistent with growth by accretion through a mechanism of polymerase slippage during replication or through recombination, as described for other repetitive sequences (62). L-arrays are rarely periodic, and we can only speculate about possible mechanisms for their origin.
The distinctive feature of L-arrays is that they disseminate through HGT, which is supported by a number of observations (see above). Further lines of evidence are provided in this work. Here, the neighborhood and co-regulation of a gene (all8564) encoding a homing endonuclease with the trn operon of Anabaena 7120 is described (Figure 6). Similar arrangements exist in other bacteria and bacteriophages (this work, (25,28,29,63)). Homing endonucleases (HE) are known to contribute to the transmission of genetic elements by HGT (64,65). Consistent with this, the HE encoded by segB in the T4 phage promotes transfer of its own ORF and flanking sequences, including the neighbor tRNA gene array. SegB also shows a preference for cleavage within tRNA genes (63). This raises the possibility that the HEs encoded by all8564 and orthologs in other species act in a similar way, promoting the dissemination of the neighbor L-array.
The distinct origin of A-and L-arrays entail that they would distinctly impact cell physiology, i.e. while A-arrays are built by gene accretion through evolutionary time, L-arrays are acquired by HGT and may cause a sudden large increase in the number of tRNA genes of the host, which could bias the proportion of species in the tRNA pool (Figure 2). Since for each organism the tRNA set is optimized, the acquisition of an L-array by HGT would be expectedly disadvantageous and counter-selected. While this is the most probable outcome, fixation would be favored by keeping expression to a minimum, as observed for the L-arrays of Acidithiobacillus ferrooxidans (26,30) and Anabaena 7120 ((26), this work), which may be the basis of their apparent cryptic character. Notwithstanding this, evidence in this work show that L-arrays can be co-opted, placed under regulatory control and integrated in cell physiology.
Our methodology validates and extends previous genomic surveys for tRNA gene arrays (20,25). Notice however that in this work we focus on potential tRNA gene operons (i.e. only arrays where genes are in the same orientation and sufficiently close to be potentially co-transcribed were analyzed) and that we consider A- and L-arrays as different entities with distinct evolutionary origin. The slight differences in the number of tRNA genes in some species of our dataset with respect to other reports are probably derived from the use of the tRNADB-CE database (49,50), a manually curated tRNA database based on strict criteria.
Integration of an L-array in the regulatory circuits of the host
Though present in a wide variety of bacterial species, functional information on L-arrays was previously lacking. Results in this work show that in Anabaena 7120 sub-lethal concentrations of ribosome-targeting antibiotics, irrespective of their chemical nature, interaction site in the ribosome or mechanism of action (Figure 3 and Supplementary Figure S4B) provoked a robust up-regulation of the trn operon, indicating that the signal triggering induction likely emanates from a partial impairment of translation, a situation referred to as translational stress. It is possible that the observed induction by other stimuli (Supplementary Figure S5B–E) was indirect, as these insults may ultimately impair translation. It needs to be stressed that the large induction of the trn operon (>102-fold) is to our knowledge unprecedented for bacterial tRNA genes, as it is also the conspicuous differential expression of operonic versus housekeeping tRNAs.
Global oscillations of tRNA abundance, previously observed in different systems, were proposed to tune the tRNA levels to the growth phase, the cell cycle or the scarcity of nutrients. For instance, tRNA levels were described to increase at high growth rate (10) and decrease under amino acid starvation or oxidative stress in bacteria (66–69). In yeasts or mammals, similar oscillations also occur (11,12,70). While these are global variations of tRNA abundance mounting evidence, including those presented in this work, show that both in single-celled or complex organisms individual tRNAs can be differentially regulated (15–19,71–74). However, mechanisms governing differential regulation of tRNA genes remain largely unknown. In this work we present what to our knowledge are the first indications on how tRNA genes are regulated. Transcriptional control of the trn operon is exerted through conserved direct repeats that are putative binding sites for a regulator. According to the transplantation experiment in Figure 6G, H, two tandem repeats at a position that overlaps the -10 box and the TSS are sufficient to turn a constitutive promoter into a regulated one. The group of genes that contain direct repeats in their promoters are most probably controlled by a common regulator and should be considered possible members of a regulon. The promoters of these genes fit to the structure of σ70-dependent promoters (Supplementary Figure S9C), typical of promoters constitutively expressed at a high level. However, their low activity under normal conditions suggests they are regulated by repression, which is consistent with the position of the direct repeats within the contact region for RNA polymerase (RNA Pol) on the promoter (75). Repression would be relieved under translational stress. It is tempting to speculate that the repressor could be a labile protein whose level would decrease when translation is impaired and upon reaching a minimum level, would dissociate from DNA, allowing recruitment of RNA Pol to the promoter.
The regulon of this hypothetical repressor may be larger than the group of genes identified in this work, but in any case, it would include only a subset of the genes induced during the response, as direct repeats were not detected in most promoters. The response to translational stress is likely controlled by a network of regulators, as deduced from the large number of genes encoding transcription factors and alternative sigma factors that are induced or repressed. The hypothetical repressor of the trn operon would be one among the many regulators controlling the response.
The Anabaena response to translational stress
Operonic tRNAs are induced as part of Anabaena’s response to translational stress and their role should be interpreted within the context of this complex phenomenon that involves a wide re-programming of cell physiology. The response to translational stress can be modeled as a phenomenon with two phases, according to the identity and expression kinetics of genes (Figure 9). Phase 1 could be described as a shock phase that lasts for about 9 h and is defined by genes that are early repressed and early induced. In this phase, major metabolic pathways and activities related to energy production, cell growth and cell division are slowed down or arrested. Regarding translation, the observed downregulation of aaRSs and EF-G suggests a slowdown of the translational rate beyond the impairment imposed by the stressor. Furthermore, induction of VapC, MazF and RelE RNases of TA systems indicates cleavage of tRNA, rRNA and mRNA, which would also contribute to reduced translation (60,61). An additional potential consequence of the action of toxins of the MazF and RelE family is the cleavage of preexisting mRNAs, which could shift translation toward stress-specific transcripts induced during the response.
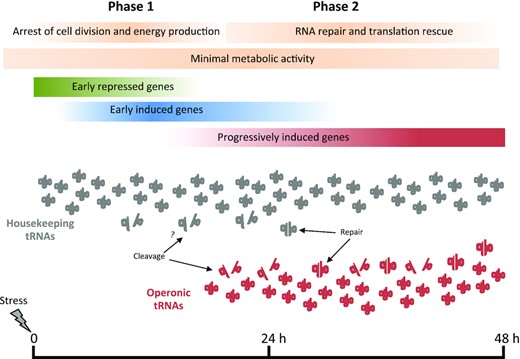
Phases of the response of Anabaena 7120 to translational stress. The scale bar represents the time (in hours) after the onset of the stress conditions.
In phase 2, cultures do not proliferate but translation is progressively restored, which is likely necessary for the synthesis of stress-specific proteins. In this phase, genes encoding ribosomal proteins, factors involved in the biogenesis and maturation of the ribosome and proteins involved in RNA processing and modification are induced. Repair and recycling of cell components helps maintain cellular homeostasis, particularly under stress. However, ribosome recycling requires rescue of ribosomes stalled by the action of antibiotics or other stressors. Rescue of stalled ribosomes requires dissociation of subunits. Interestingly, the hflX gene induced in this second phase encodes a ribosome-binding GTPase shown to promote dissociation of stalled ribosomes and the recycling of ribosomal subunits, which in Listeria and Mycobacterium species was reported to increase tolerance to ribosome-targeting antibiotics (76,77). Recycling of ribosomal subunits would contribute to restoration of translation in Anabaena, reducing dependence on the energetically costly process of de novo ribosome synthesis.
Genes for de novo synthesis of ribosomes are also induced in phase 2, complementing the ribosome recycling process. These include genes encoding ribosomal proteins and factors involved in the biogenesis and maturation of the ribosome, such as Der (EngA), TypA (BipA), RimP, RbfA, Sun (a 16S rRNA methyl transferase) and RsfS, recently redefined as a biogenesis factor (78). Genes ycf65 and ychF, encoding other ribosome associated proteins of unknown function are also induced as well as genes encoding RNases mediating maturation of rRNA, like YbeY, Mini-III or RNaseJ. These observations are consistent with the recovery of translation observed in cultures.
Anabaena cells subjected to translational stress grew poorly and maintained a low metabolism, which is reminiscent of the state of persistence, a non-proliferative state adopted by bacteria when exposed to antibiotics. Such a dormant state was described to allow some cells of bacterial populations to overcome antibiotic toxicity, which is thought to be the cause of the relapse of many bacterial infections (79). While mainly investigated in pathogens, persistence likely evolved in free-living bacteria as an acclimation response to adverse environmental conditions (80). We propose that events here described are an example of such acclimation phenomenon. TA systems have been intensely investigated in relation to persistence (79), but their role is still under debate (81). These systems were proposed to help arrest metabolism, which is consistent with the induction of toxin RNases during phase 1. However, the induction of tRNA-specific RNases of the VapC family in phase 2 appears at odds with the recovery of translation observed in this phase. Their induction is concomitant to the observed cleavage of some operonic tRNAs and is discussed below.
Role of operonic tRNAs in the response to translational stress
Our long-term competition experiments indicate that operonic tRNAs are important for survival under translational stress (Figure 3F). But how do these tRNAs contribute to survival? Our results indicate that operonic tRNAs may participate in translation and a plausible hypothesis was that they could help to match the tRNA pool to the codon usage of stress-specific genes. However, lack of correlation between the anticodons of operonic tRNAs and the codon usage of genes expressed at 0, 3, 9 or 24 h of the response did not support this hypothesis (Supplementary Table S5). This by no means rules out the participation of operonic tRNAs in translation but does suggest that their positive effect on survival is achieved by other means.
One consequence of the induction of the trn operon would be the increase of tRNA levels in phase 2. It has been reported that in E. coli an artificial increase of tRNA levels, by means of overexpression of a few tRNAs, was enough to rescue translation from inhibition by oxidative stress, which favored survival (68,69). An appealing observation from our work is the co-regulation of the trn operon with rtcB, encoding a widely distributed RNA ligase that in Archaea and Metazoa is involved in tRNA intron splicing (82) and in Bacteria probably mediates the repair of cleaved tRNAs (83–85). It is tempting to speculate that in Anabaena, RtcB could also perform the repair of tRNAs cleaved by the action of toxin RNases induced in phases 1 and 2. In this work, cleavage of only operonic tRNAs was observed, but only a subset of tRNAs was tested, raising the possibility that housekeeping tRNAs were also targets for cleavage, which would negatively impact translation. Perhaps the role of RtcB could be to maintain, by means of repair, the level of tRNAs in phase 2, which could help the recovery of translation, as observed in E. coli. The boost of expression of operonic tRNAs in this phase could also increase levels of tRNAs, which perhaps may act as sponges to sequester toxin RNases, minimizing their impact on housekeeping tRNAs. According to this scheme, the levels of the tRNA pool in phase 2 would be maintained at relatively high levels by the concerted action of both RtcB and operonic tRNAs. Such redundancy could be at the basis of the apparent dispensability of operonic tRNAs for the rescue of translation in phase 2.
We also cannot rule out that, as reported in a variety of systems, some operonic tRNAs could be involved in non-canonical functions outside translation, including signaling or metabolite biosynthesis (see (86) and references therein), an issue that would require further investigation.
Although mechanistic issues on the role of operonic tRNAs in the response to translational stress still need to be investigated, evidence presented in this work, are to our knowledge the first indications of the possible role of the so far allegedly cryptic L-arrays. We show that in bacteria upon acquisition by HGT, these L-arrays can integrate in the regulatory circuits of the host and operate in physiological processes. Future investigations will determine whether in other bacteria tRNAs encoded by L-arrays perform similar or different roles as in Anabaena. Furthermore, our work provides evidence that in bacteria the tRNA gene set can be partitioned in a housekeeping subset and an alternative subset that may endow the host with plasticity for acclimation to environmental conditions.
DATA AVAILABILITY
RNA-seq data generated in this study is freely available from the Gene Expression Omnibus (GEO) database under the accession number GSE159215. The data analysis code developed using the statistical programming language R is freely available from the following GitHub repository: https://github.com/fran-romero-campero/nostoc.
SUPPLEMENTARY DATA
Supplementary Data are available at NAR Online.
ACKNOWLEDGEMENTS
We are indebted to Jesús de la Cruz and Olga Rodríguez-Galán for advise and help with polysome preparation, to Elan Alexis Téllez Pueblas for technical assistance and to Agustín Vioque for biological material. We are thankful to Eloisa Andújar Pulido and Mónica Pérez Alegre for advice and assistance with RNA-Seq experiments, to Cristina Velázquez-Suárez and Alicia Orea for help with confocal microscopy and to Susana Sellés Marchart for mass spectrometry analyses.
FUNDING
Ministerio de Ciencia, Innovación y Universidades [BFU2016-77097-P to I.L., A.H.; BIO2017-84066-R to F.J.R-C.]; Agencia Estatal de Investigación [PID2019-104784RJ-100/AEI/10.13039/501100011033 to R.L.I.]; National Science Foundation [MCB-1715840 to M.I.]. RB-M's lab at University of Alicante is a member of Proteored, PRB3 and is supported by grant PT17/0019, of the PE I+D+i 2013-2016, funded by ISCIII and ERDF. Funding for open access charge: Consejo Superior de Investigaciones Científicas.
Conflict of interest statement. None declared.
REFERENCES
Author notes
The authors wish it to be known that, in their opinion, the first two authors should be regarded as Joint First Authors.

Comments