


Abstract
Structural variations (SVs) in genomic DNA can have profound effects on the evolution of living organisms, on phenotypic variations and on disease processes. A critical step in discovering the full extent of structural variations is the development of tools to characterize these variations accurately in next generation sequencing data. Toward this goal, we developed a software pipeline named digit that implements a novel measure of mapping ambiguity to discover interchromosomal SVs from mate-pair and pair-end sequencing data. The workflow robustly handles the high numbers of artifacts present in mate-pair sequencing and reduces the false positive rate while maintaining sensitivity. In the simulated data set, our workflow recovered 96% of simulated SVs. It generates a self-updating library of common translocations and allows for the investigation of patient- or group-specific events, making it suitable for discovering and cataloging chromosomal translocations associated with specific groups, traits, diseases or population structures.
INTRODUCTION
Structural variations (SVs) are deletions and insertions of >50 bp, inversions, translocations and copy number variations in the genome. SVs in human genomes introduce more sequence variations than single nucleotide variations (1). Modification of a gene's structure can lead to the loss of function or gain of new functions, while modifications to regulatory elements can lead to up- or downregulation of genes and establish new gene regulatory networks (2). On top of the genic implications, breakings and reattachments of chromosomal fragments may change the copy number variation of genomic regions and reduce their overall stability, both of which can perpetuate the creation of subsequent SVs (3).
Interchromosomal translocations are SVs that have been linked to a variety of different diseases. For example, Robertsonian translocations have famously been shown to increase the risk for Down syndrome (4). Diseases such as Ewing's sarcoma (5), Papillary thyroid (6) and several types of leukemia and lymphoma (7) underscore the dominant role that translocations play in cancer. Discovery and characterization of some of the SVs from cancer have led to the identification of SVs that drive cancer and the development of effective targeted anti-cancer therapies (8,9).
Over the last two decades, a variety of techniques and methods for SV detection have been established (1). Next generation sequencing is the most promising technique in terms of discovering novel SVs, even for small scale events. Split-read methods such as CREST (10), which try to find reads overlapping with chromosomal breakpoints by reassembling and remapping partially mapping reads back to the reference genome, are available to discover SVs from next generation sequencing. These methods have a high accuracy in breakpoint resolution but require high coverage and long read lengths in order to pick up SVs.
Gap-spanning methods utilize paired-end (PE) sequencing reads that originate from two ends of the same DNA molecule. Breakpoints are detected by analysing read pairs that map discordantly in terms of their separation distance or mapping to different chromosomes (11). The analysis of mate-pair sequencing data is particularly useful for the detection of SVs. Mate-pair sequencing data allow for long separation distances between read pairs (12), which significantly reduces the required read depth necessary to span the entire genome. Over the last several years, numerous software tools have been developed for detecting SVs in PE data (13). Unfortunately, many of the algorithms designed for PE data fail to address the high number of artifacts generated by mate-pair sequencing due to library preparation. In addition, since larger genomes contain numerous regions of local similarity, these methods have the tendency to result in false-positives, undermining the integrity of called SVs. Some studies also suggest that sequence similarity drives translocation events (13), leading to the question of when to discard or accept reads targeting these regions.
Here, we present ‘digit’: a software tool for analysing translocations in mate-pair sequencing data that robustly removes artifacts and reduces the false positive rate while maintaining sensitivity. This software addresses the limitations of existing methods by implementing a novel measure of mapping ambiguity, called mapping validity measure (MVM). MVM filters out low confidence, discordant pairs and in doing so, it improves specificity, recovery and discovery. The MVM distribution for concordant pairs in a sample is used as an internal standard to obtain an MVM threshold for discordant read pairs. The proposed software is also capable of separating chromosomal translocations between different groups, i.e. cancer and non-cancer, by comparing translocation events to a control population. This feature enables users to reveal translocations associated with specific traits or disease groups and to improve the analysis of tumour samples that lack paired normal controls.
MATERIALS AND METHODS
Sample preparation and sequencing of lung cancer samples
Nextera Mate Pair libraries were prepared following the manufacturer's protocol (Illumina). A total of 1 µg of genomic DNA in 76 µl EB buffer is simultaneously fragmented and tagged with a biotinylated mate pair junction adaptor. The resulting construct contains a short single stranded sequence gap which is repaired enzymatically according to manufacturer's protocol (Illumina). The repaired DNA is purified and smaller DNA fragments (<1500 bp) are removed using AMPure Beads.
The size selected fragments are circularization by blunt end ligation for 16 h at 30°C using circularization ligase (Illumina). Non-circularized fragments are eliminated by DNA exonuclease treatment. The remaining circularized DNA is again fragmented, this time using the Covaris E210, generating double-stranded DNA fragments with fragment sizes in the 200–2000 bp range.
The biotinylated DNA fragments are purified using Dynalbeads M-280 streptavidin beads (Invitrogen) as outlined in the Illumina Mate-Pair protocol. Illumina indexed adapters are added to the DNA on the M-280 beads using the TruSeq Library Sample Preparation kit (Illumina) as follows.
The ends of the biotinylated fragments immobilized on the beads are repaired and phosphorylated using Klenow, T4 DNA polymerase and T4 polynucleotide kinase; after which an ‘A’ base is added to the 3΄ ends of double-stranded DNA using Klenow exo- (3΄ to 5΄ exo minus). Paired end DNA adaptors (Illumina) with a single ‘T’ base overhang at the 3΄ end are ligated and the immobilized adapter-modified DNA fragments are enriched by 10 cycles of polymerase chain reaction (PCR). The PCR supernatant is recovered from the beads using a magnetic rack. The PCR enriched constructs are cleaned up with AMPure xp beads recovering DNA fragments of ∼300–2000 bp. Concentration and size distribution of the libraries are determined on an Agilent Bioanalyzer DNA 1000 chip and Qubit dsDNA assay (Invitrogen).
Libraries are sequenced at two samples/lane to generate ∼150 million reads/sample following Illumina's standard protocol using the Illumina cBot and cBot Paired end cluster kit version 3. The flow cells are sequenced as 101 × 2 paired end reads on an Illumina HiSeq 2000 using TruSeq SBS sequencing kit version 3 and HCS v2.0.12data collection software. Base-calling is performed using Illumina's RTA version 1.17.21.3.
Program modules and external tools in the workflow
The software tool consists of multiple modules that are executed in succession and can optionally be removed or replaced by the user in order to customize analysis for individual experimental setups (Supplementary Figures S1 and 2). Since reads generated by mate-pair sequencing have an inverted orientation compared to other PE methods, they are first transformed back into forward-reverse orientation by building their reverse-complements using the digit ‘revcomp’ module. Next, adapter sequences that pollute a fraction of the reads are removed. For this task, the cutadapt software (14) is used. Mapping to the reference genome is performed using Bowtie2 (version 2.1.0) with standard configuration as the recommended alignment software (15). For all alignments performed in this study, hg38 served as the reference genome. Once all reads are successfully aligned, the SortSam and MarkDuplicates functions from Picard tools (version 1.117) from the Broad Institute of MIT and Harvard, as well as the sort and view functions from samtools (version 0.1.19) (16), are used to tag and ultimately remove PCR duplicates.
The parameter k can be chosen according to the user's preferred confidence interval. In this study, we used 2.33, which corresponds to ∼99% of all observed reads.
If two reads in a pair map to different chromosomes, they are put into the translocation category and the pair is called discordant. Read pairs representing potential translocations are then passed to the ‘proxval’ (proximity validation) module that searches for clusters of reads, calculates the MVM of read pairs and finally applies a filter to identify high confident discordant pairs. Finally, clusters that remain intact after the MVM filter has been applied are considered real events and can be processed by the ‘ficore’ (find common regions) module (Supplementary Figure S2). In this last step, candidate translocation clusters from different samples are compared with normal controls, and commonly captured events associated with the general population or mapping artifacts are separated from disease-relevant events.
Mapping validity measure
The ratio V quantifies how much better the target read Rx maps to the sequence Sx than to the other sequence Sy. A mapping validity ratio of 2.0, for example, would mean that a read maps twice as well to its assigned target region than to its mate's assigned target region while a ratio of 0.5 depicts the opposite case. A value close to 1.0 indicates ambiguity. Values below 1.0 represent errors the mapping software makes in the original assignment. Since these assignments are not trustworthy, they are also deemed ambiguous.
Read pairs with MVM values below a certain threshold are rejected. The threshold is calculated by analysing the concordant read pair's MVM distribution. First, the concordant cumulative distribution function (cdf) is estimated by processing 100 000 concordant read pairs. The threshold is then defined as the MVM corresponding to a significantly low percentile (0.005) of the concordant cdf. This threshold ensures that only pairs that significantly deviate from the genomic, normal MVM profile are rejected.
The ‘ficore’ module
Translocation clusters passing the MVM filter are still not guaranteed to be significantly associated with the target group or disease. Thus, all clusters are compared to a library of common translocations that are not exclusively associated with the target group. In this study, the library consists of translocations called by processing samples of 20 individuals without a prior diagnosis of cancer and a simulated sample set covering the reference genome hg38. A translocation is considered relevant for the disease if the same event either is absent in the normal samples or appears in a much lower frequency than in the disease samples. We refer to the former as disease or group specific translocations and the latter as potential predispositions for the disease or group.
The module is designed in a way that any group can be compared to any other group, normal group or library. This approach makes it equally suitable for separating germ-line events from disease events and for characterizing differences between sample groups. The software also allows for merging of multiple samples (e.g. multiple sequencing runs of the same patient) into one entry or sub-group. The user also has the option to generate a library of common events after each run that can be shared and used again as a normal control in future runs.
Simulated data
We generated simulated PE data by grabbing random subsequences from the hg38 reference sequence, which were separated by a distance that was itself defined by a normal distribution with a mean of 2300 and a standard deviation of 700. These values were chosen after observing distributions of lung cancer mate-pair data that approximately resemble the conditions in these real samples. Artificial translocations are predefined before generating data. Targets of translocations are chosen randomly, but the chance of targeting a chromosome is proportionate to its length. If a read pair spans a predefined breakpoint of an artificial translocation, there is a 50% chance that a discordant pair is created instead that utilizes the random separation and a random offset from the breakpoints. To all generated reads, we applied a high base mutation rate of 0.001. The dataset consists of 80 million reads and 1000 translocations.
Run time
Run time was monitored for processing a real sample (42 Gb in fastq format) utilizing the primary alignments created with Bowtie2. Since Hydra requires exclusively discordant read pairs as input inter-chromosomal pairs parsed out by digit's ‘analyse’ module were used as input. Digit's workflow involved pre-processing steps with Picard tools and samtools, as well as executing the ‘analyse’ and ‘proxval’ module in succession. Hydra's workflow involved secondary alignment with the free version of Novoalign, as well as processing with bedtools and the hydra scripts. For processing times with a server containing 7-cores and 60 Gb memory were determined for both workflows.
A significant advantage in performance of digit over Hydra was observed when evaluating run time. The digit workflow took 14 h, 22 min and 50 s (total of 51 770 s) to complete, whereas the Hydra workflow took 5 days, 17 h, 43 min and 7 s (total of 495 787 s) to complete. This slow performance was mainly due to the fact that the free version of Novoalign does not allow for multi-threading which could have significantly sped up the process. However, even when accounting for multithreading and generously assuming the Hydra workflow would have been seven times faster, it would have still taken 70 827 s to complete, which is ∼1.37 times slower than digit.
GASVPRO
The software GASVPRO was tested with both of the scripts provided by the authors: GASVPRO and GASVPRO-HQ. For GASVPRO-HQ the Bowtie2 SAM output file was first processed with samtools’ view function in order to generate a BAM file. In the next step, Picard tools’ AddOrReplaceReadGroups function was used to transform the file into the required format. The entire file was then passed to GASVPRO-HQ. For GASVPRO a custom script separated multiple matching SAM entry pairs with the XS:i tag from uniquely matching pairs. Both of these files were processed as described before and were given to the GASVPRO script as high quality and low-quality files. We changed three parameters in the workflow scripts in order to make the results comparable to digit:
–minClusterSize 3
Translocations: true
TransOnly: true
Data access
The normal samples used in this paper originate from various sources. They include three trio samples from the Illumina Platinum genome project (EBI accession: ERP002490), four samples from the personal whole genome sequencing project of Masaru Tomita (SRA accessions: DRR002191-DRR002194), and patients 1–9 and 22–25 reported in the paper by Vergult et al. (12).
Lung cancer datasets were obtained from Julian R. Molina at Mayo Clinic and will be available accompanying a separate manuscript.
RESULTS
Workflow
The tool's capability is demonstrated by analysing simulated data and mate-pair DNA sequencing of tumour DNA from 33 patients with lung cancer and germline DNA from 20 individuals without a prior diagnosis of cancer. Our developed pipeline first pre-processes the data, removing generic artifacts before the screening process for chromosomal translocations. During pre-processing, read orientation is corrected, adapter sequences are trimmed off and reads are mapped to the reference genome. Next, PCR duplicates and read pairs with a low mapping quality (MAPQ) are removed.
In the first step of the screening process, discordant read pairs that map to different chromosomes are separated from concordant read pairs that meet the expectation in terms of read separation (Figure 1). A potential translocation is reported if multiple, discordant pairs can be found that target sites in close proximity. Unfortunately, these clusters can originate from genomic regions that have a high, local similarity (e.g. paralogues and pseudogenes) and might not constitute a real translocation. To identify and remove these candidates, we introduce the MVM, which scores read pairs based on the ability of both reads to be mapped back to their opposite regions. If a read can be mapped similarly well to both mate regions, its origin is ambiguous and cannot be resolved by using the current reference: a score of 1.0 represents maximum ambiguity, while values higher than 1.0 represent the less ambiguous mapping of mate pairs. Density plots of MVM scores produce two distinct peaks separating mate pairs with ambiguous mapping from those with unique, unambiguous mapping. The distribution of MVM scores from concordant pairs is used as the internal standard distribution for the selection of a cut-off value that is used to classify discordant pairs with unambiguous mapping. A translocation event is called if a cluster can be recreated after the MVM filter has been applied. Finally, processed samples from a general, normal population are used to identify translocation events associated with the cancer group.
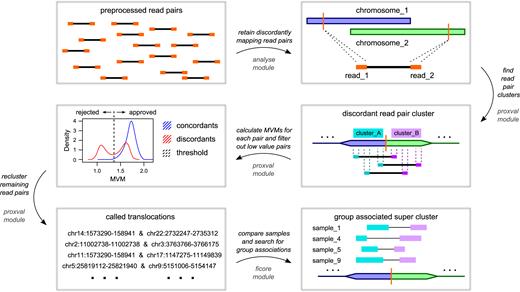
Translocation screening workflow. Pre-processed, discordant read pairs are used to build clusters and MVMs are calculated from clustered pairs. The MVM distribution of concordant pairs is used to identify high-quality discordant pairs. Candidate translocations are then identified from clusters built with high-quality discordant pairs. If a set of samples from the same patient group/disease group shares a common translocation that the normal population does not, a group specific cluster is called.
Simulated data
To investigate the classifier's performance, we generated and processed simulated data with the pipeline using different parameter configurations (Table 1). Utilizing the Burrows-Wheeler Aligner's Maximal Exact Matches algorithm (BWA-MEM) followed by cluster (“clustered-only”) filtering retained 99.9% of true discordant read pairs (Table 1). Similarly, Bowtie2 alignment followed by cluster only filtering also retained 99.7% of true discordant read pairs. Interestingly, BWA mem produces a higher rate of accurately mapped discordant pairs compared to Bowtie2, as evident by fewer discordant read pairs around true negative (TN) events (Table 1). In contrast, the Bowtie2 aligner produces a higher rate of incorrectly mapped discordant pairs, as evidenced by the higher amount discordant read pairs around TN events (Table 1). Despite a high amount of incorrectly mapped discordant pairs in Bowtie2 alignment, filtering steps implemented in the digit workflow were able to remove these erroneous discordant pairs.
Comparison of BWA mem and Bowtie2 as primary alignment software
| Aligner | Sensitivity | FP | TN | TP | FN |
|---|---|---|---|---|---|
| BWA: clustered only (c = 3) | 0.99906 | 1721 | 1998 | 21 242 | 20 |
| BWA: full workflow (c = 3) | 0.95151 | 1651 | 2068 | 20 231 | 1031 |
| Bowtie2: clustered only (c = 3) | 0.99722 | 2318 | 2 983 307 | 21 194 | 59 |
| Bowtie2: MVM filter only (c = 1) | 0.93526 | 12 434 | 2 973 191 | 19 877 | 1376 |
| Bowtie2: full workflow (c = 3) | 0.93389 | 1897 | 2 983 728 | 19 848 | 1405 |
Number of discordant read pairs remaining at the end of specific workflows. The digit workflow was utilized to analyse the simulated data aligned with either the BWA mem algorithm or the Bowtie2 alignment algorithm. The clustered only workflow does not make use of MVM downstream filtering, whereas the MVM filter-only workflow does not employ a cluster size threshold. The MVM threshold is 0.005, and the cluster size threshold is at least three pairs per cluster. Sensitivity quantifies the rate of true read pairs accurately carried forward (TP/(TP+FN)). FP, TN, TP and FN refer to false positives, true negatives, true positives and false negatives, respectively. The total number of true read pairs, which splits into TP and FN counts, refers to those discordant read pairs that are mapped accurately by the primary alignment software. Similarly, the total number of false read pairs, which splits into FP and TN counts, refers to those discordant read pairs that do not map accurately. The small numbers in TN for BWA are due to the fact that many false positives were already eliminated by the alignment and not carried forward. These results suggest that BWA mem alignment followed by cluster size filtering is sufficient to remove most of the false-positive read pairs while recovering 99.9% of true discordant read pairs.
| Aligner | Sensitivity | FP | TN | TP | FN |
|---|---|---|---|---|---|
| BWA: clustered only (c = 3) | 0.99906 | 1721 | 1998 | 21 242 | 20 |
| BWA: full workflow (c = 3) | 0.95151 | 1651 | 2068 | 20 231 | 1031 |
| Bowtie2: clustered only (c = 3) | 0.99722 | 2318 | 2 983 307 | 21 194 | 59 |
| Bowtie2: MVM filter only (c = 1) | 0.93526 | 12 434 | 2 973 191 | 19 877 | 1376 |
| Bowtie2: full workflow (c = 3) | 0.93389 | 1897 | 2 983 728 | 19 848 | 1405 |
Number of discordant read pairs remaining at the end of specific workflows. The digit workflow was utilized to analyse the simulated data aligned with either the BWA mem algorithm or the Bowtie2 alignment algorithm. The clustered only workflow does not make use of MVM downstream filtering, whereas the MVM filter-only workflow does not employ a cluster size threshold. The MVM threshold is 0.005, and the cluster size threshold is at least three pairs per cluster. Sensitivity quantifies the rate of true read pairs accurately carried forward (TP/(TP+FN)). FP, TN, TP and FN refer to false positives, true negatives, true positives and false negatives, respectively. The total number of true read pairs, which splits into TP and FN counts, refers to those discordant read pairs that are mapped accurately by the primary alignment software. Similarly, the total number of false read pairs, which splits into FP and TN counts, refers to those discordant read pairs that do not map accurately. The small numbers in TN for BWA are due to the fact that many false positives were already eliminated by the alignment and not carried forward. These results suggest that BWA mem alignment followed by cluster size filtering is sufficient to remove most of the false-positive read pairs while recovering 99.9% of true discordant read pairs.
Performing the MVM filter on its own without any restrictions to cluster size manages to reject most of the false events, while still maintaining a sensitivity of 93.5%. Even though this filter on its own is not as effective as the cluster size threshold, it can become very valuable when small sample sizes and low coverage prohibit the assembling of breakpoint clusters.
Filtering out read pairs during pre-processing according to MAPQ had two effects: first, removing all simulated read pairs with an MAPQ less than 30 simultaneously removed all false positives for any configuration. However, this result came at the expense of reduced sensitivity. Filtering according to this MAPQ threshold also removed almost all discordant read pairs with MVM scores proximal to 1.0. After evaluating how many total reads were removed in both simulated and real samples, an arbitrary threshold of 23 was chosen for conservative workflows with Bowtie2 that aim to enrich true positive events.
Not applying the MAPQ filter and solely using the MVM filter increased the sensitivity for all other parameter configurations. Receiver operating characteristic (ROC) curve analysis with varying thresholds for cluster size (number of pairs supporting the cluster), revealed excellent classifier behavior with area under the curve (AUC) values being larger than 0.9 (Figure 2). As expected, increasing the number of read pairs required to call a cluster (c-values) raised specificity but lowered sensitivity. The cluster size of ≥2 (c = 2) produced the best AUC value for the simulated data. Values above or below 2 resulted in reduced AUCs.
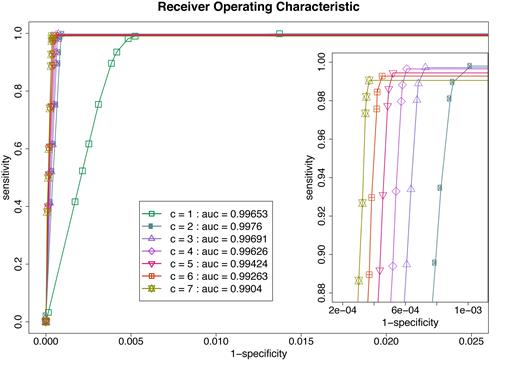
Receiver Operating Characteristic curve analysis of the MVM filter combined with clustering. Simulated data were processed using different c-values and MVM thresholds. The c-value specifies how many read pairs are required to call a cluster. The MVM thresholds for discordant read pairs are drawn from the empirical cumulative distribution function of concordant read pairs at various percentiles (0.5, 0.1, 0.07, 0.05, 0.03, 0.01, 0.005 and 0.0005). Each ROC curve is plotted using various MVM thresholds and separated by c-value. The area under the curve (AUC) is estimated by connecting the first data point to the origin and assuming constant sensitivity of the last data point when moving into lower specificities (since after the last listed data point, specificities does not decrease anymore). The rough integral estimate is calculated with the trapezoidal rule. Inset is provided at specific scale level to show the separation of ROC curves.
Independent of the clustering and filtering, ∼15% of discordant read pairs originating from a true translocation were lost upfront during the mapping process with Bowtie2 (Table 2). These reads were either mismapped to wrong sites in the genome, thus becoming false positive calls, or could not be mapped and were lost entirely. Adding the MAPQ threshold filter (≥23) further reduced the recovery rate to ∼40%. The MVM filtering with a 0.005 concordant CDF threshold and clustering lowered the number of recovered true positives by another 5% in both configurations. The total loss in recovery was thus 44.4 and 20.3% with or without MAPQ filtering, respectively. However, recovery in terms of actual translocation calls fared far better, with 96.63% of translocations being recovered without the MAPQ filter and 76.66% of translocations being recovered with the MAPQ filter. This greater level of recovery was due to high read coverage, which allows assembly of clusters flanking the simulated breakpoints although 44% of read pairs were removed by the MAPQ filter. It should be noted that the coverage in the simulated data set was chosen to be representative of the read count in the processed cancer samples.
Recovery of simulated translocations
| Analyse module | Proxval module | |||||||
|---|---|---|---|---|---|---|---|---|
| Event type | Total | Digit (q0) | Digit (q23) | Digit (q0) | Digit (q23) | GASV (B2G) | GASV (HQ) | Hydra |
| Discordant read pairs from true breaks | 24 916 | 21 253 | 14 849 | 19 848 | 13 845 | 13 329 | 275 | |
| Clusters from true breaks | 861 | 832 | 660 | 19 | 841 | |||
| False clusters | 327 | 201 | 0 | 344 | ||||
Breakdown of the recovery of true-positive and false-positive events in the simulated dataset. Only 861 of the 1000 randomly generated translocations could be possibly mapped, since the reference genome's sequence information in the breakpoint region of the remaining 139 was incomplete. After mapping with Bowtie2.0, (q0) refers to the output of digit with no MAPQ filter while (q23) refers to the same configuration using a MAPQ filter with a threshold of 23. For GASV, (B2G) refers to the BAMToGASV output, while (HQ) refers to GASVPRO-HQ. Recovery of true positive events is higher for all steps in digit's workflow, even with a strict MAPQ filter. Hydra used discordantly mapped reads parsed out by the ‘analyse’ module in order to provide comparability between digit and Hydra.
| Analyse module | Proxval module | |||||||
|---|---|---|---|---|---|---|---|---|
| Event type | Total | Digit (q0) | Digit (q23) | Digit (q0) | Digit (q23) | GASV (B2G) | GASV (HQ) | Hydra |
| Discordant read pairs from true breaks | 24 916 | 21 253 | 14 849 | 19 848 | 13 845 | 13 329 | 275 | |
| Clusters from true breaks | 861 | 832 | 660 | 19 | 841 | |||
| False clusters | 327 | 201 | 0 | 344 | ||||
Breakdown of the recovery of true-positive and false-positive events in the simulated dataset. Only 861 of the 1000 randomly generated translocations could be possibly mapped, since the reference genome's sequence information in the breakpoint region of the remaining 139 was incomplete. After mapping with Bowtie2.0, (q0) refers to the output of digit with no MAPQ filter while (q23) refers to the same configuration using a MAPQ filter with a threshold of 23. For GASV, (B2G) refers to the BAMToGASV output, while (HQ) refers to GASVPRO-HQ. Recovery of true positive events is higher for all steps in digit's workflow, even with a strict MAPQ filter. Hydra used discordantly mapped reads parsed out by the ‘analyse’ module in order to provide comparability between digit and Hydra.
Using the BWA mem algorithm instead of Bowtie2 for the primary alignment resulted in a performance increase in the simulated data. The total number of reported discordantly mapping reads decreased dramatically while at the same time more true events were accurately retained when using BWA-MEM (Table 1). After performing clustering with a cluster size threshold of 3 read pairs (c = 3) without employing the downstream MVM threshold, the BWA-MEM workflow retained 48 more true positive read pairs, yet 597 less false positive pairs were carried forward compared to Bowtie2 (Table 1). The huge discrepancy in TN values displayed is because Bowtie2 called far more false pairs that were then removed by clustering.
Processing the simulated data with the SV detection tool GASVPRO and default parameters led to worse performance than did processing these data with our method. The tool made no false positive predictions, but even though 861 translocation clusters were simulated, only 19 of these were called (Table 2). Further investigation revealed that applying just the BAMToGASV module of the tool, which is meant to separate and categorize read pairs, removed a higher number of true-positive pairs than applying our entire workflow with strict parameters (Table 2). Processing discordantly mapping read pairs with the SV detection tool Hydra in combination with the Novoalign alignment software produced a performance similar to digit. Hydra picked up 8 more true clusters than digit, yet called 17 more false clusters. Nonetheless, both tools were in high agreement, a total of 1036 merged clusters were called by both digit and Hydra at the same time, 149 clusters were solely called by hydra and 123 clusters were solely called by digit.
Data from real samples
Three patients (TCGA-AA-A00U, TCGA-AG-A01N, TCGA-AG-A011) from the Cancer Genome Atlas colorectal cancer genome sequencing project were selected (18). These samples were selected because they contain validated shared translocation between chr2 and chr11 which created NAV2-TCF7L1. Three tumour and three normal samples were processed each with the standard workflow for digit. From these patients, a total of eight translocations in tumour samples were validated and reported in the original paper. Out of these eight independent events, digit recovers three events (a common translocation between NAV2 and TCF7L1) (Table 3). Interestingly, this translocation was also detected in two normal samples (AG-A011 and AG-A01N). Moreover, utilizing the ‘ficore’ module this translocation was also found to be present in two additional samples (patient 4 and 23) from the intellectual disability dataset.
Recovery of validated translocations
| Sample | Validated (hg19) | Validated LO (hg38) | Reported with digit (hg38) | Genes |
|---|---|---|---|---|
| AG-A011 normal | chr11:19861136–19861284 | NAV2 | ||
| chr2:85190897–85191005 | TCF7L1 | |||
| AG-A011 tumour | chr11:19839258 | chr11:19817712 | chr11:19861226–19861273 | NAV2 |
| chr2:85271685 | chr2:85044562 | chr2:85190825–85190919 | TCF7L1 | |
| AG-A01N normal | chr11:19861223–19861284 | NAV2 | ||
| chr2:85190947–85191002 | TCF7L1 | |||
| AG-A01N tumour | chr11:19839345 | chr11:19817799 | <not detected> | NAV2 |
| chr2:85271681 | chr2:85044558 | TCF7L1 | ||
| AA-A00U normal | <not detected> | NAV2 | ||
| TCF7L1 | ||||
| AA-A00U tumour | chr11:19839255 | chr11:19817709 | chr11:19861142–19861261 | NAV2 |
| chr2:85271695 | chr2:85044572 | chr2:85190864–85191004 | TCF7L1 |
TCGA-validated translocation recovered by digit. Note that the chromosomal coordinates differ between publications due to different reference genomes being utilized. Validated LO coordinates refer to coordinates obtained via the LiftOver tool of the UCSC Genome Browser website. Discrepancies in detection are hypothesized to be due to split read methods that were used in the original paper and a read pair strategy that was used in this study.
| Sample | Validated (hg19) | Validated LO (hg38) | Reported with digit (hg38) | Genes |
|---|---|---|---|---|
| AG-A011 normal | chr11:19861136–19861284 | NAV2 | ||
| chr2:85190897–85191005 | TCF7L1 | |||
| AG-A011 tumour | chr11:19839258 | chr11:19817712 | chr11:19861226–19861273 | NAV2 |
| chr2:85271685 | chr2:85044562 | chr2:85190825–85190919 | TCF7L1 | |
| AG-A01N normal | chr11:19861223–19861284 | NAV2 | ||
| chr2:85190947–85191002 | TCF7L1 | |||
| AG-A01N tumour | chr11:19839345 | chr11:19817799 | <not detected> | NAV2 |
| chr2:85271681 | chr2:85044558 | TCF7L1 | ||
| AA-A00U normal | <not detected> | NAV2 | ||
| TCF7L1 | ||||
| AA-A00U tumour | chr11:19839255 | chr11:19817709 | chr11:19861142–19861261 | NAV2 |
| chr2:85271695 | chr2:85044572 | chr2:85190864–85191004 | TCF7L1 |
TCGA-validated translocation recovered by digit. Note that the chromosomal coordinates differ between publications due to different reference genomes being utilized. Validated LO coordinates refer to coordinates obtained via the LiftOver tool of the UCSC Genome Browser website. Discrepancies in detection are hypothesized to be due to split read methods that were used in the original paper and a read pair strategy that was used in this study.
In addition to the validated TCGA dataset, we applied our approach to a mate pair sequencing dataset from lung cancer samples. To achieve a high enrichment in true positive events, we processed real data with a MAPQ filter threshold of 23. Applying this filter still left a high number of ambiguously mapping read pairs (according to MVM) in the set of discordant read pairs. Clustering of discordant pairs removed more than 85% of the read pairs in all real data samples (Supplementary Figure S3A). Over 99.5% of read pairs were removed in the majority of samples. Applying the MVM filter to the remaining pairs further removed 20 to 60% of candidate discordant pairs for most of the samples (Supplementary Figure S3B). Notably, MVM distributions consistently produce two main peaks, one 1.0 proximal and one 1.0 distal. The generated threshold for rejecting discordant read pairs always fell between the two peaks and thus allowed the separation of high-confident discordant pairs from potential artifacts (Supplementary Figure S4).
A total of 328 translocation calls were shared between two or more samples and were not exclusive to cancer. While most of the detected events were present in only a few samples, a small subset of 11 events were picked up in more than 50% of all samples, the most frequent ones being found in 51 out of 53 samples. These exceptionally high frequencies suggest a common structural variant and potentially point towards incompleteness in the reference genome. Thirteen candidate translocations may potentially be disease-relevant because they occurred more frequently (1.6× higher or more) in cancer samples (Table 4). Out of these, a putative translocation involving RBMS2 and FSIP1 has the highest number of supporting samples. A translocation between these two genes has also been detected in bladder cancer in a previous study (19).
Candidate germline translocations enriched in lung cancer patients
| Cluster region associated with the discordant pairs | # of samples | Read pair orientation | Genes associated with the discordant pairs | EFTO | |||||
|---|---|---|---|---|---|---|---|---|---|
| Mate A | Mate B | + + | - - | + - | - + | Mate A | Mate B | ||
| chr12:107278274–107285305 | chr13:31753921–31754755 | 6 | 5 | 14 | 3 | 1 | RXFP2 | NA | |
| chr12:107803248–107815383 | chr7:111413075–111413610 | 16 | 2 | 0 | 41 | 54 | IMP2 | NA | |
| chr12:56595913–56596233 | chr15:39694170–39710585 | 31 | 3 | 4 | 151 | 124 | RBMS2 | FSIP1 | Opposite strand |
| chr13:63058399–63067726 | chrUn_KI270750v1:263–11376 | 15 | 0 | 0 | 84 | 0 | NA | ||
| chr13:60886945–60888114 | chr5:21895992–21907889 | 5 | 2 | 49 | 3 | 0 | CDH12 | NA | |
| chr17:51892842–51904703 | chr4:128043829–128044201 | 5 | 2 | 1 | 10 | 6 | CA10 | NA | |
| chr3:188007898–188019724 | chr6:92386951–92387267 | 5 | 6 | 20 | 0 | 0 | NA | ||
| chr11:82153583–82169326 | chr9:35883770–35884048 | 24 | 1 | 0 | 4 | 152 | MIR4300HG | NA | |
| chr1:234211420–234218167 | chr1_KI270764v1_alt:44068–46168 | 14 | 0 | 0 | 0 | 90 | SLC35F3 | NA | |
| chr11:108704670–108724452 | chr13:21153592–21176428 | 14 | 16 | 18 | 244 | 150 | DDX10 | SKA3 | Opposite strand |
| chr10:59142644–59143107 | chr7:82150071–82167472 | 18 | 123 | 112 | 4 | 3 | CACNA2D1 | NA | |
| chr11:56382572–56388050 | chr11_JH159136v1_alt:187006–194283 | 9 | 0 | 0 | 0 | 42 | OR8U8 | NA | |
| chr13:43489400–43501681 | chr15:41559194–41579030 | 17 | 173 | 118 | 0 | 0 | ENOX1 | TYRO3 | Same strand |
Translocations classified as potential predispositions. Entries are presented in the order of relevance. The first entry was 2.5 times more prevalent in cancer samples than in normal samples, while the last entry was 1.6 times more prevalent in cancer samples than in normal samples. Translocations printed in bold contained a site that was also targeted by other translocations. Expected Fusion Transcript Orientation (EFTO) is inferred from (i) read pair orientation and (ii) coding strand of the genes involved in a potential fusion. It specifies whether we would expect transcripts of these genes to originate from the same or opposite strand after the fusion. NA means not applicable.
| Cluster region associated with the discordant pairs | # of samples | Read pair orientation | Genes associated with the discordant pairs | EFTO | |||||
|---|---|---|---|---|---|---|---|---|---|
| Mate A | Mate B | + + | - - | + - | - + | Mate A | Mate B | ||
| chr12:107278274–107285305 | chr13:31753921–31754755 | 6 | 5 | 14 | 3 | 1 | RXFP2 | NA | |
| chr12:107803248–107815383 | chr7:111413075–111413610 | 16 | 2 | 0 | 41 | 54 | IMP2 | NA | |
| chr12:56595913–56596233 | chr15:39694170–39710585 | 31 | 3 | 4 | 151 | 124 | RBMS2 | FSIP1 | Opposite strand |
| chr13:63058399–63067726 | chrUn_KI270750v1:263–11376 | 15 | 0 | 0 | 84 | 0 | NA | ||
| chr13:60886945–60888114 | chr5:21895992–21907889 | 5 | 2 | 49 | 3 | 0 | CDH12 | NA | |
| chr17:51892842–51904703 | chr4:128043829–128044201 | 5 | 2 | 1 | 10 | 6 | CA10 | NA | |
| chr3:188007898–188019724 | chr6:92386951–92387267 | 5 | 6 | 20 | 0 | 0 | NA | ||
| chr11:82153583–82169326 | chr9:35883770–35884048 | 24 | 1 | 0 | 4 | 152 | MIR4300HG | NA | |
| chr1:234211420–234218167 | chr1_KI270764v1_alt:44068–46168 | 14 | 0 | 0 | 0 | 90 | SLC35F3 | NA | |
| chr11:108704670–108724452 | chr13:21153592–21176428 | 14 | 16 | 18 | 244 | 150 | DDX10 | SKA3 | Opposite strand |
| chr10:59142644–59143107 | chr7:82150071–82167472 | 18 | 123 | 112 | 4 | 3 | CACNA2D1 | NA | |
| chr11:56382572–56388050 | chr11_JH159136v1_alt:187006–194283 | 9 | 0 | 0 | 0 | 42 | OR8U8 | NA | |
| chr13:43489400–43501681 | chr15:41559194–41579030 | 17 | 173 | 118 | 0 | 0 | ENOX1 | TYRO3 | Same strand |
Translocations classified as potential predispositions. Entries are presented in the order of relevance. The first entry was 2.5 times more prevalent in cancer samples than in normal samples, while the last entry was 1.6 times more prevalent in cancer samples than in normal samples. Translocations printed in bold contained a site that was also targeted by other translocations. Expected Fusion Transcript Orientation (EFTO) is inferred from (i) read pair orientation and (ii) coding strand of the genes involved in a potential fusion. It specifies whether we would expect transcripts of these genes to originate from the same or opposite strand after the fusion. NA means not applicable.
When comparing translocations that exclusively occurred in cancer samples (Figure 3B) with all other detected translocations (Figure 3A) two different profiles emerged, separating potential cancer-specific events from common germline events. Out of the set of cancer-specific translocations, 158 events were found only in one sample. With a range from 0 to 6, most samples exhibited only a few translocations that were unique to them. Three cancer samples, however, exhibited a high frequency of unique translocations (12, 19 and 74) and accounted for 66% of the cancer specific, unique translocations.
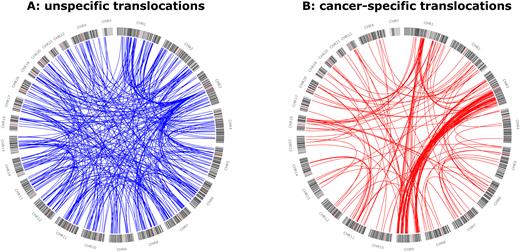
Circos diagram of different translocations picked up in the analysed samples. Called events were separated into two groups. (A) Events either exclusively picked up in the control population or in both cancer and controls population. (B) Events exclusively picked up in cancer samples. Both groups depict clearly distinguishable patterns. The high amount of structural variations (SVs) not specific to cancer characterizes frequent germline SVs.
Sixteen translocations were detected in two or more cancer samples but were not found in any normal sample (Table 5). Particularly striking was a translocation involving ENOX1 that was detected in 17 individual cancer samples, corresponding to 50% of cancer samples included in this study. The second most frequent event was detected in only seven cancer samples. Other specific events were found in only a small number of lung cancer samples.
Candidate translocations that occur in multiple samples but exclusively in the cancer population
| Cluster region associated with … | # of | Read pair orientation | Cluster overlapping with … | EFTO | |||||
|---|---|---|---|---|---|---|---|---|---|
| Mate A | Mate B | Samples | + + | - - | + - | - + | Mate A | Mate B | |
| chr13:43489399-43506156 | chr15:76259498-76261344 | 17 | 0 | 0 | 29 | 68 | ENOX1 | ETFA, (TYRO3P) | Same strand (Opposite strand) |
| chr12:55388434-55390509 | chr2:177983324-177989400 | 7 | 0 | 0 | 96 | 0 | PDE11A | NA | |
| chr1:71894209-71895396 | chr2:102295043-102303870 | 5 | 0 | 0 | 42 | 2 | NEGR1 | NA | |
| chr5:116108335-116112650 | chr7:111592193-111592727 | 5 | 0 | 0 | 27 | 0 | COMMD10 | NA | |
| chr12:2744110-2754341 | chr9:78316976-78317473 | 4 | 0 | 0 | 3 | 15 | PSAT1 | NA | |
| chr18:71946509-71952177 | chr2:143253210-143253556 | 4 | 10 | 8 | 0 | 0 | ARHGAP15 | NA | |
| chr19:46832197-46841666 | chr2:201281686-201281914 | 4 | 3 | 13 | 0 | 0 | AP2S1 | CASP8 | Same strand |
| chr1:113503314-113503663 | chr9:113242647-113255579 | 3 | 0 | 0 | 3 | 10 | MAGI3 | SLC31A1 | Same strand |
| chr10:100094493-100095051 | chrX:91074736-91082921 | 3 | 11 | 2 | 0 | 0 | NA | ||
| chr16:22075484-22081398 | chr4:7943250-7953028 | 3 | 0 | 0 | 9 | 13 | C16orf52 | NA | |
| chr1:57128756-57137730 | chr16:59177791-59178005 | 2 | 4 | 3 | 0 | 0 | DAB1 | NA | |
| chr1:66986787-66987441 | chr16:77752613-77757959 | 2 | 2 | 3 | 4 | 4 | MIER1 | NA | |
| chr1:218710003-218711094 | chr3:25050709-25063963 | 2 | 0 | 0 | 38 | 28 | MIR548F3 | NA | |
| chr12:55388594-55390012 | chr2:177970354-177972635 | 2 | 0 | 0 | 0 | 6 | PDE11A | NA | |
| chr12:16814983-16819147 | chr4:2939789-2939995 | 2 | 0 | 0 | 6 | 1 | NOP14 | NA | |
Translocations classified as specific. Clusters in this category were solely observed in cancer samples but not in normal samples. Translocations printed in bold contained a site that was also targeted by other translocations. Expected Fusion Transcript Orientation (EFTO) is defined the same way as in Table 4.
| Cluster region associated with … | # of | Read pair orientation | Cluster overlapping with … | EFTO | |||||
|---|---|---|---|---|---|---|---|---|---|
| Mate A | Mate B | Samples | + + | - - | + - | - + | Mate A | Mate B | |
| chr13:43489399-43506156 | chr15:76259498-76261344 | 17 | 0 | 0 | 29 | 68 | ENOX1 | ETFA, (TYRO3P) | Same strand (Opposite strand) |
| chr12:55388434-55390509 | chr2:177983324-177989400 | 7 | 0 | 0 | 96 | 0 | PDE11A | NA | |
| chr1:71894209-71895396 | chr2:102295043-102303870 | 5 | 0 | 0 | 42 | 2 | NEGR1 | NA | |
| chr5:116108335-116112650 | chr7:111592193-111592727 | 5 | 0 | 0 | 27 | 0 | COMMD10 | NA | |
| chr12:2744110-2754341 | chr9:78316976-78317473 | 4 | 0 | 0 | 3 | 15 | PSAT1 | NA | |
| chr18:71946509-71952177 | chr2:143253210-143253556 | 4 | 10 | 8 | 0 | 0 | ARHGAP15 | NA | |
| chr19:46832197-46841666 | chr2:201281686-201281914 | 4 | 3 | 13 | 0 | 0 | AP2S1 | CASP8 | Same strand |
| chr1:113503314-113503663 | chr9:113242647-113255579 | 3 | 0 | 0 | 3 | 10 | MAGI3 | SLC31A1 | Same strand |
| chr10:100094493-100095051 | chrX:91074736-91082921 | 3 | 11 | 2 | 0 | 0 | NA | ||
| chr16:22075484-22081398 | chr4:7943250-7953028 | 3 | 0 | 0 | 9 | 13 | C16orf52 | NA | |
| chr1:57128756-57137730 | chr16:59177791-59178005 | 2 | 4 | 3 | 0 | 0 | DAB1 | NA | |
| chr1:66986787-66987441 | chr16:77752613-77757959 | 2 | 2 | 3 | 4 | 4 | MIER1 | NA | |
| chr1:218710003-218711094 | chr3:25050709-25063963 | 2 | 0 | 0 | 38 | 28 | MIR548F3 | NA | |
| chr12:55388594-55390012 | chr2:177970354-177972635 | 2 | 0 | 0 | 0 | 6 | PDE11A | NA | |
| chr12:16814983-16819147 | chr4:2939789-2939995 | 2 | 0 | 0 | 6 | 1 | NOP14 | NA | |
Translocations classified as specific. Clusters in this category were solely observed in cancer samples but not in normal samples. Translocations printed in bold contained a site that was also targeted by other translocations. Expected Fusion Transcript Orientation (EFTO) is defined the same way as in Table 4.
We identified ENOX1 as a target of two different translocations (TYRO3 and ETFA) in cancer samples and non-cancer germline samples. A Blat search revealed that the breakpoint cluster in normal and cancer samples (chr15:41559194–41579030) mapped to TYRO3 exons, whereas the breakpoint cluster in cancer samples (chr15:76259498–76261344) also mapped to the TYRO3P gene within the intron of the ETFA gene. TYRO3P is a retrotransposed pseudogene of TYRO3, and the sequence identity between them is 95%. These results indicate that the ENOX1-TYRO3 and ENOX1-ETFA/TYRO3P translocations in normal and cancer samples are most likely a retrotransposition of TYRO3P to the intronic sequence of ENOX1 (Figure 4A and B). These results support prior studies indicating a potential retrotransposition of TYRO3 mRNA to ENOX1 (20,21).
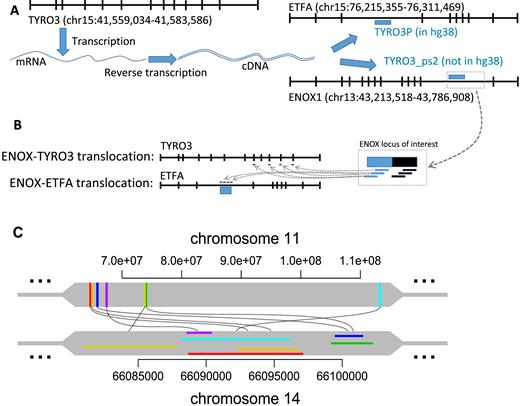
Sites targeted by multiple translocations. (A) TYRO3 is located on the q-arm of chromosome 15 at 41 Mb position whereas the pseudogene TYRO3P is located on the same arm at 76 Mb position within an intron of ETFA gene. Intronless TYRO3P shares two regions of homology with TYRO3 coding sequence (1–719 bp of TYRO3P align to 1791–2518 bp of TYRO3 and share 91% identity; and 776–860 bp of TYRO3P align to 2516–2602 bp of TYRO3 and share 99% identity), indicating that TYRO3P likely arises from the retrotransposition of a TYRO3 transcript. (B) The high frequency of read pairs supporting ENOX1-TYRO3 or ENOX1-TYRO3P/ETFA translocations observed in normal and lung cancer samples in this study suggests the misclassification of variant due to incompleteness of the reference genome. The discordant reads likely come from the undocumented retrotransposition of TYRO3 (TYRO3_ps2) to the ENOX1 locus in the reference genome. Since this new putative retrotransposition is not documented in the reference genome, read pairs coming from this region of interest will not have proper mapping of one of the mates. This conclusion is consistent with recently reported retroCNV insertion of TYRO3 mRNA at ENOX1 loci (Accession number: nssv1607697) (20,21). (C) The biggest site involved in multiple translocations exclusively in one cancer sample. The colours represent cluster regions of the same translocation. The regions on chromosome 11 are within genic regions and do not possess significant similarities between each other whereas the regions on chromosome 14 contain MER52D (ERV1 family) retrotransposon sequence.
The site chr12:55388434–55390509 was targeted by two different, proximal translocations. We found that two parts of the same region chr2:177970354–177989400 were separated by a long transposon element in the reference, which was not present in the samples, thus leading to two different translocation clusters. This finding suggests that a transposon jump might have occurred in the cancer samples at this position. Most reported sites involved in multiple translocations were linked to multiple other sites of the same chromosome exclusively in one cancer sample. The biggest of these, chr14:66080971–66102231, was linked to seven different regions on chromosome 11 that are anywhere from several kilobases to several megabases apart and do not possess a uniform sub-region of high similarity (Figure 4C).
The non-cancer samples, subjects 22–25 from Vergult et al. (12), contained at least four previously validated translocations. All of these were picked up by the pipeline with the exception of one in patient 25 that was also not detected through mate-pair sequencing in the previous study. Upon further investigation, we confirmed that no read pair in the entire dataset was mapped to the breakpoint proximal regions, suggesting that this false negative result is due to coverage and thus cannot be detected.
DISCUSSION
Interchromosomal translocations play an important role in the evolution of species and the origin and perpetuation of diseases. One of the most successful strategies for detecting translocations is the analysis of PE sequencing data. At present, most of the available software methods for detecting translocations struggle with high false-positive ratios and are unable to separate disease-associated events from frequent germline events.
The results from the simulated data set indicate high sensitivity and specificity in detecting simulated structural alterations using our pipeline. It is important to note that the MVM score distributions of discordant pairs in the simulated data set are less complex than in real data because the current reference genome (GRCh38) was used to generate the simulated data set. Thus, we expect that the classifier behavior under real conditions might be slightly lower than suggested by the simulated data.
In our simulated dataset, we simulated read depth comparable to the real world dataset obtained from cancer mate-pair sequencing. Using this read coverage level, we recovered 96% of simulated breakpoints. Unrecovered breakpoints are due to the lack of simulated read pairs flanking the breakpoints. We expect that increased coverage will improve the recovery rate. In addition, from the fairly small intellectual disability libraries to the high coverage Illumina Platinum Genome trio, digit managed to detect inter-chromosomal variation events in various samples from different backgrounds with vastly different library sizes. This suggests that the software capable of recovering relevant translocations from a wide range of samples with different read coverages. Even though low read coverages can make cluster size as a selection criterion unviable, the MVM filter still provides an opportunity to remove a large amount of false positives and make more accurate predictions.
Our method outperformed GASVPRO and recovered simulated SVs with excellent sensitivity and specificity. In addition, digit successfully recovered validated, true positive events in real data. These results indicate that the MVM we implemented in digit is capable of discovering SVs from next generation sequencing data. The high degree of read-pairs removed by the filters of our pipeline in real data suggests that many artifacts are indeed present in all the samples and that there is a need to remove false positive events. Our analysis indicates that MAPQ filtering is not sufficient to remove most of the false positive events. Considering that many true positive pairs were also removed by MAPQ filter, it should be used with caution in translocation detection.
We also found that BWA mem performed better than Bowtie2 as the primary aligner. BWA mem alignment produced far fewer erroneous discordant pairs compared to Bowtie2. Despite the high rate of erroneous discordant pairs with Bowtie2 alignment, the digit workflow correctly filtered them out by MAPQ, cluster size and MVM score filtering steps. The subsequent MVM step (after the cluster size threshold) correctly rejected additional 421 out of 2318 (18.2%) read pairs as false events, yet wrongly rejected additional 1346 out of 21 194 (6.4%) read pairs of true events. This demonstrates that both filters are synergistic and can be used to enrich read pairs from true events. In scenarios where this approach is too conservative, the digit workflow can be modified to either lower the MVM threshold or remove the MVM filtering step but keep the rest of the workflow intact, since the upstream pre-processing and downstream ‘ficore’ analysis are independent of the filters employed.
With the BWA mem alignment, after the cluster size filtering, the subsequent MVM step with the MVM threshold of 0.005 correctly rejected additional 70 out of 1721 (4.1%) read pairs from false events, yet wrongly rejected 1011 out of 21 242 (4.8%) read pairs from true events for the BWA workflow. These results suggest that using the BWA mem algorithm does indeed improve the analysis and also reduce the utility of the MVM filter. The MVM filter might still be useful in this modified workflow when a less stringent, lower MVM threshold (≤0.0005) is employed or, as discussed in the next paragraphs, when low coverage makes the use of cluster size as a filtering technique not suitable.
The results also highlight the fact that the digit workflow still performs well regardless of the choice of primary alignment software and optional filtering steps. These results provide strong evidence that the upstream and downstream processing steps implemented in the digit tool are valid and useful when trying to identify inter-chromosomal variation events. It should also be noted that the BWA mem algorithm was designed for read lengths bigger than or equal to 70 bp. Therefore, the MVM strategy implemented in the digit workflow is relevant for shorter read lengths such as 50 bp where BWA mem algorithm may not be suitable.
It is important to note that our current studies are limited to DNA sequencing from fresh frozen tissue samples. Since MVM score filtering is based on mismatches in the aligned reads, low sequencing quality or sequencing artifacts from formalin-fixed tissue samples may affect the MVM score and the discovery performance. However, we observed that the use of BWA-MEM as the primary aligner alleviated the need to use MVM score filtering. Therefore, if MVM score filtering severely affects the recovery of translocation events from low quality/degraded input DNA, it may be possible to skip MVM score filtering by using BWA-MEM as the primary aligner.
The ‘ficore’ module finds common regions of putative translocation events from all samples and provides a mean to document whether these events are also found in germline samples (if they are included in the analysis). Therefore, this module can be used to discover not just cancer-specific events but also germline events and this module will aid in better characterization of germline SVs in human population. It should be noted that putative translocation events discovered through digit could be complemented with fusion detection approaches from RNA-seq (such as Fusion Hunter (22), DeFuse (23), etc.) to fully characterize the effect of translocations in the cancer genomes. The fact that even with a limited number of samples, 328 common translocation calls could be identified and separated from cancer-specific events is a testament to the pipeline's ability to successfully classify trait-associated events and reveal translocation diversity in different groups in the study. Although common structural alterations are not reflected in the current reference genomes, these events may be separated from disease-associated events in the long run by using the pipeline's group comparison feature. Due to the limited sample size and coverage-associated effects, the documented library of common events in this study cannot be considered complete. Thus, it is still questionable whether all cancer-specific translocation calls are classified correctly. Provided that more samples could be processed and incorporated into a database over time, we expect that calls will become increasingly reliable as more common events are identified and documented.
Shared sites involving multiple translocations in lung cancer samples seem to be associated with more complex events such as retrotranspositions or potential chromothripsis. Recent studies by Helman et al. (24) and Tubio et al. (25) documented somatic retrotransposition in cancer genomes. Massive genomic rearrangement due to a single catastrophic event, known as chromothripsis, has also been described in cancer genomes (26). In addition, several cancer-specific translocations, such as BCR-ABL, TMPRSS2-ERG and others are well documented for their roles in pathogenesis of various cancers (7,27–29). The digit pipeline might prove to be a valuable platform to investigate these types of events in cancer genomes.
Our analysis also revealed that some of the common translocation events, such as ENOX1-TYRO3 and ENOX1-ETFA/TYRO3P, are likely to be undocumented retrotransposition events and unlikely to be cancer specific. This conclusion is supported by evidence provided in the Supplementary Table S2 by Schrider et al. which reported TYRO3 retrotranslocation to the intron of ENOX1 in several individuals (21). Therefore, putative translocation events discovered through mate-pair and pair-end sequencing of genomic DNA should be checked against known retro-transposition sites to minimize false discovery.
In conclusion, the provided tool successfully identifies and categorizes translocations present in pair-end and mate-pair sequencing datasets. Cluster properties such as orientation, localization, read count, associated samples or groups and shared target sites help to characterize the nature of detected translocations. Since the MVM filter is also included as a standalone module, it can even be easily integrated into other established workflows of research groups who prefer to keep using their own custom pipelines. With the added benefit of self-improvement through the dynamic generation and update of a common event library, our tool will be helpful for genomic studies focusing on the characterization of translocations associated with various traits and diseases.
AVAILABILITY
Tool (digit)
The tool is available for public download at the following link:
https://github.com/richard-meier/digit-trl
ACCESSION NUMBERS
Part of the data used in the study are available at the following sites.
http://www.ebi.ac.uk/ena/data/view/ERP002490
ftp://ftp-trace.ncbi.nlm.nih.gov/sra/sra-instant/reads/ByRun/sra/DRR/DRR002/DRR002191
ftp://ftp-trace.ncbi.nlm.nih.gov/sra/sra-instant/reads/ByRun/sra/DRR/DRR002/DRR002192
ftp://ftp-trace.ncbi.nlm.nih.gov/sra/sra-instant/reads/ByRun/sra/DRR/DRR002/DRR002193
ftp://ftp-trace.ncbi.nlm.nih.gov/sra/sra-instant/reads/ByRun/sra/DRR/DRR002/DRR002194
SUPPLEMENTARY DATA
Supplementary Data are available at NAR Online.
ACKNOWLEDGEMENTS
We acknowledge computational resources supported by the University of Kansas Cancer Center and the University of Kansas Advanced Computing Facility.
FUNDING
KU Endowment, Department of Defense Ovarian Cancer Research Program [W81XWH-10-1-0386 to J.C.], and National Cancer Institute Cancer Center Support Grant [P30 CA168524]. Funding for open access charge: Department of Defense.
Conflict of interest statement. None declared.
REFERENCES

Comments