


Abstract
Small non-coding RNAs play a key role in many physiological and pathological processes. Since 2004, miRNA sequences have been catalogued in miRBase, which is currently in its 21st version. We investigated sequence and structural features of miRNAs annotated in the miRBase and compared them between different versions of this reference database. We have identified that the two most recent releases (v20 and v21) are influenced by next-generation sequencing based miRNA predictions and show significant deviation from miRNAs discovered prior to the high-throughput profiling period. From the analysis of miRBase, we derived a set of key characteristics to predict new miRNAs and applied the implemented algorithm to evaluate novel blood-borne miRNA candidates. We carried out 705 individual whole miRNA sequencings of blood cells and collected a total of 9.7 billion reads. Using miRDeep2 we initially predicted 1452 potentially novel miRNAs. After excluding false positives, 518 candidates remained. These novel candidates were ranked according to their distance to the features in the early miRBase versions allowing for an easier selection of a subset of putative miRNAs for validation. Selected candidates were successfully validated by qRT-PCR and northern blotting. In addition, we implemented a web-server for ranking potential miRNA candidates, which is available at: www.ccb.uni-saarland.de/novomirank.
INTRODUCTION
Initially discovered over 20 years ago in 1993 in Caenorhabditis elegans (1), small non-coding RNAs such as miRNAs have become a highly researched field. Among the first known miRNAs were members of the let-7 family, regulating genes important for the development such as lin-14, lin-28, lin-41 or daf-12. The respective small RNAs were well conserved between various organisms. Since that time, research groups around the globe have reported tens of thousands of miRNAs in far more than 100 organisms. Early studies identified miRNAs using labour-intensive cloning methods, which predominantly identified abundant ‘high’ confidence miRNAs that were validated in substantial parts by northern blot analysis. Since miRNAs are expressed on a large dynamic range of several orders of magnitudes and show tissue and cell type specific patterns, the traditional genetic techniques may have only revealed a portion of all miRNAs (2). These traditional experimental technologies have been augmented both by novel high-throughput technologies such as next-generation sequencing (NGS) and by computational approaches for the ab initio prediction of novel miRNAs.
Amongst the ab initio prediction tools, MirScan (3) and MiRSeeker (4) have gained biggest attention. These predictor methods rely mostly on free energy in combination with other sequence features such as GC content. Later, more sophisticated approaches such as random forests and support vector machines have been applied to discover miRNAs from genomes. Still one potential limitation remained with these approaches: the definition of negative reference sets that consisted mostly of randomly chosen stem loop sequences derived from the target genome. With advancing NGS technologies, computational tools for the discovery of small non-coding RNAs have been developed. Among the most popular ones are miRanalyzer (5), MIReNA (6) and miRDeep (7,8). In the past years, hundreds of miRNA studies have been carried out using NGS, as indicated by almost 900 hits on PubMed searching for ‘miRNA and next generation sequencing’. Likewise, over 2000 miRNA NGS samples have already been added to the gene expression omnibus (9), one of the most frequently used data repositories for high-throughput nucleic acid analysis.
The central resource for miRNAs is miRBase (10), which at the time of this analysis is in its 21st version. With each succeeding version, the number of novel miRNAs has been continuously increasing, as Table 1 demonstrates for human miRNA precursors with two annotated mature miRNAs. In total, 1881 human miRNA precursors have been annotated, the majority of them with two mature forms, the 3′ and 5′ miRNAs. Still, the final number of miRNAs in the human genome may be significantly more than what is currently known.
Overview of the numbers of human precursors with two annotated miRNAs and their first occurrence in miRBase
| miRBase version | Number new precursors | Set | Numbers in set |
|---|---|---|---|
| 1 | 88 | I | 185 |
| 2 | 50 | ||
| 3 | 34 | ||
| 4 | 13 | ||
| 5 | 12 | II | 96 |
| 6 | 3 | ||
| 7 | 81 | ||
| 8 | 52 | III | 125 |
| 9 | 8 | ||
| 10 | 35 | ||
| 11 | 30 | ||
| 12 | 8 | IV | 106 |
| 13 | 0 | ||
| 14 | 7 | ||
| 15 | 47 | ||
| 16 | 44 | ||
| 17 | 141 | V | 218 |
| 18 | 49 | ||
| 19 | 28 | ||
| 20 | 200 | VI | 202 |
| 21 | 2 |
Most recently, Londin et al. (11) published in a very comprehensive NGS data analysis study 3494 novel miRNA precursor candidates and 3707 novel mature miRNAs, doubling the content of the miRBase. It is obvious that experimental validation of respective data sets remains a major challenge, especially since high-throughput approaches as NGS potentially contain besides the true positive also false positive candidates. While in the early versions (v1–4) of miRBase 54 miRNAs were experimentally validated by northern blot (28.9% of all 187 new miRNAs in v1–4), from version 17 onwards just two miRNAs were validated respectively (0.001% of all 1378 new miRNAs in v17–21). Thus, it is likely that the current set of miRNAs deposited in the miRBase as reference database may also contain false positive candidates, potentially leading to an over-estimation of the total number of miRNAs.
In this study, we categorize the 21 miRBase releases into six categories (sets I-VI, Table 1) and subsequently identify scoring features for ‘typical’ miRNA precursors using biostatistics. For the prediction of novel miRNA precursors, we use a data set consisting of 705 miRNA NGS profiles derived from blood of patients with various diseases and healthy controls and apply the popular miRDeep2 algorithm. The predicted novel miRNA precursors are then ranked according to their similarity to the previously defined ‘typical’ precursor features. To facilitate the ranking of novel miRNA precursors, we implemented a web-service called novo-miRank (www.ccb.uni-saarland.de/novomirank), allowing researchers in the field to prioritize and rank their predicted novel miRNA precursors in comparison to selected miRBase versions for experimental validation.
MATERIALS AND METHODS
Sequence features
From each miRNA precursor sequence and the two mature miRNAs, we calculated the following 24 features: the minimum free energy of the precursor, the 3p- and the 5p-miRNA using RNAfold (12) (3 features), the percentage of bases A, C, U, G in the precursor, 3p- and 5p-miRNA (12 features), the precursor length, length of 3p and 5p mature forms (3 features), the loop length (1 feature), the distance to the next precursor in the genome in base pairs (computed from the genomic start positions of the precursors), and the number of precursors within windows of different genomic ranges (5 kb, 10 kb, 50 kb and 106 kb; 5 features). The windows were computed symmetrically around the middle of a precursor, and we counted also precursors that did not lie completely in the window, but overlapped with it. Since miRBase provides stem-loop sequences, we trimmed these sequences to obtain precursor sequences that start and end with the 5p/3p miRNAs, respectively. An overview of these features for all miRBase precursors/miRNAs is available in Supplementary Table S1.
Samples
We included all miRNA samples that have been measured in our studies from PAXGene blood tubes using Illumina Next-Generation sequencing. The set of patients includes besides healthy controls also Alzheimer's Disease patients (13), Multiple Sclerosis patients ((14) and manuscript with new data submitted) and consecutive patients collected in a Chest Pain Unit (manuscript in preparation). All samples in this study have been evaluated in a blinded manner. Local ethics committees approved the study and patients gave written informed consent.
Prediction of novel miRNAs
To predict novel miRNAs from the NGS sequencing reads we applied the miRDeep algorithm as integrated in the miRDeep2 pipeline using the default program parameters (8) as described previously (13). Briefly, we performed a 3′ adapter trimming with the FASTX toolkit (http://hannonlab.cshl.edu/fastx_toolkit/) on the raw fastq files and discarded reads <18 nucleotides. The trimming process reduced the total 9.7 billion reads to 9.2 billion reads. After that we summarized unique reads per sample to make the down-stream analysis faster. We ran the miRDeep prediction algorithm on each sample separately. From each sample's miRDeep2 output we selected novel miRNAs that had a signal-to-noise ratio of ≥10 according to miRDeep2. In order to avoid multiple miRNA predictions from different samples that are just shifted by few bases, we merged overlapping precursors. If both miRNAs of a precursor shared an overlap of at least 11 bases, we took one of the overlapping precursors as representative for the novel predicted precursors at this location. Quantification was done with the quantifier script belonging to the miRDeep2 pipeline, which uses bowtie (15) as mapping tool. In total, 8.4 billion reads could be mapped to miRBase, 197 million reads were mapped to the 1452 potential new precursors. For the generation of base count plots we used the mapping output of miRDeep2 (arf files) and collected the number of overlapping reads for each nucleotide of the respective precursor. Normalization was done for each sample separately by dividing the actual count by the total read count of the sample and then by multiplying by 107. For the plot, the individual normalized counts per sample and nucleotide position were summarized for all samples per position.
Matching to known RNA resources
As first step to exclude potential false positive miRNAs, we mapped the proposed novel miRNAs from the miRDeep algorithm back to other human non-coding RNA resources using BLAST (v 2.2.24) (16). The set of databases contains miRBase v21, snoRNA-LBME-db (17), ncRNAs from Ensembl ‘Homo_sapiens.GRCh37.67.ncrna.fa’ (18), and NONCODE (v3.0) (19). We excluded sequences that aligned with > 90% of their length (allowing 1 mismatch) to any of the above non-coding RNA sequences.
Biostatistical analysis
To estimate whether a specific miRBase version or set of miRBase versions deviates in one of the 24 features significantly from others, we carried out analysis of variance for each feature separately. All findings with FDR corrected significance values below 0.05 were considered significant. Since the considered features are on different scales, we applied for each feature a transformation to unit variance and centred them to zero, corresponding to z-scores. The standardized data have then been used for multivariate analysis including clustering or Principal Component Analysis (PCA). To cluster the miRBase versions, we applied complete linkage hierarchical clustering on the 24 scaled features. To limit the influence of single features we additionally cut the z-scores at an absolute threshold of 3. The PCA was carried out to produce a low dimensional representation of the miRBase versions. To calculate a distance of a miRNA precursor from a set of precursors, we first calculated the mean and standard deviation of each feature for the set of miRNAs. Then, we computed the z-scores for all features and the precursor, showing how many standard deviations this precursor is above or below the mean of the precursor set. To reduce the influence of single features, again absolute z-score values have been cut at 3. For all features, the average absolute value of the z-score has been calculated. All statistical calculations have been carried out in the freely available statistical programming environment R (version 3.0.2).
Web-service implementation
To make our analysis available to other researchers in the field, we implemented a web-service, where researchers can test one or more novel precursors for deviations from one or a set of miRBase versions. For the single precursor analysis, we need the sequences of the precursor and both miRNAs as well as the genomic location of the precursor. For the batch analysis, the user can upload a GFF file (GFF3 format), containing the annotations for the precursors and miRNAs that should be tested. The genomic coordinates must be given with respect to the GRCh38 genome assembly. Example files and a tutorial explaining the usage of the web-service are available online. The output of our tool shows a histogram of the computed averaged z-scores of the features of the chosen miRBase version(s) as reference distribution and the distribution of the computed z-scores of the user uploaded precursors. Additionally, the computed z-scores are displayed in a sortable and filterable table. The computed features and z-scores are also available for download as tab-separated text-file. Our web-service is freely available at: www.ccb.uni-saarland.de/novomirank. The implementation uses the python web-framework Django 1.8, as well as some additional python packages like numpy, scipy and rpy2.
Validation of novel miRNAs with qRT-PCR
To validate the expression of novel miRNAs in blood samples, we selected 15 high ranked novel miRNAs and performed quantitative real-time PCR. In detail, we pooled RNA isolated from PAXgene blood tubes of 15 patients with Alzheimer′s disease and 15 patients with Multiple Sclerosis into three RNA pools. Of each pool, 200 ng total RNA was reverse transcribed in 10 μl total volume containing 2 μl HighSpec buffer, 1 μl Nucleic Mix and 1 μl RT (components of miScript II RT kit, Qiagen, Hilden, Germany). Real-time PCR was conducted in 20 μl total volume using 1 μl of 1:10 diluted RT reaction, 10 μl QuantiTect SYBR Green Master Mix, 2 μl Universal Primer, 2 μl specific Primer Assay and 5 μl RNase-free water (Qiagen, Hilden, Germany). Negative controls included a no template control for reverse transcription (NTRT), a RT reaction without enzyme (RT-) and a no template PCR control for each specific primer (NTC). All reactions were set up in duplicates. Specific amplification of novel miRNAs was satisfactorily demonstrated by a qRT-PCR product with (i) a melting temperature of 75°C ± 1.5C°; (ii) a mean raw Ct value of the product in the three pools of <35 and (iii) an assay dependent product length of 80–90bp as evidenced on an DNA 1000 Bioanalyzer chip (Agilent Technologies) and conventional 3% agarose gels. To verify specificity of qPCR amplification, PCR products were Sanger sequenced. In detail, PCR products were purified using PCR purification kit (Machery Nagel), A-tailed and subcloned into pGEM-T-easy vector according to manufacturer's recommendations (Promega). After transformation into E.coli DH5α, three clones for each novel miRNA were Sanger sequenced.
Validation of novel miRNAs with northern blots
Cloning
For cloning of the pSG5-novel-miR-1005 expression plasmid, nucleotides 100841490–100841859 from Chromosome 11 were amplified from genomic DNA using specific primers (Forward:5′GTAGTCCTGAAACGAGGGAG3′; Reverse: 5′GAGAGTCTGTGGCTTTTGAGG3′) by PCR and ligated via BglII and BamHI restriction sites into the pSG5 vector (Stratagene, La Jolla, USA).
Cell lines, tissue culture and transfection
Human 293T cells were purchased from the German Collection of Microorganisms and Cell Cultures (DSMZ, Braunschweig, Germany). The cells were cultured as described elsewhere (20). For ectopic miRNA expression, 2.4 × 10⁶ 293T cells per 100 mm dish were seeded in 8 ml of DMEM culture medium containing 10% FCS and 1% Penicillin/Streptomycin. After 24 h the 293T cells were transfected either with 8 μg pSG5-vector or 8μg pSG5-miR-expression plasmid according to the manufacturer's protocol using PolyFect transfection reagent (Qiagen, Hilden, Germany).
RNA extraction and northern blotting
After 48 hours the total RNA from pSG5 or pSG5-novel-miR-1005 transfected 293T cells respectively was isolated using QIAzol lysis reagent (Qiagen, Hilden, Germany) according to the manufacturer's manual. Northern blotting and stripping of the nylon membrane Hybond N (Amersham) for further hybridization with the miR-20a-5p-probes was performed as described previously (20). The radioactive miRNA probes for the detection of the novel and the high confident miRNAs were synthesized and radioactive labelled using the miRVana Probe Construction Kit (Ambion). The novel-miRNAs miR-1005–5p, miR-1005–3p and the highly confident miR-20a-5p were detected with the following radioactive miRNA-probes: AGAGGCUGAAUUCCCAGUGAGUCCUGUCUC (novel-miR-1005–5p), AUUCGCUGGGAAUUCAGCCUCUCCUGUCUC (novel-miR-1005–3p), UAAAGUGCUUAUAGUGCAGGUAGCCUGUCUC (miR-20a-5p).
RESULTS AND DISCUSSION
We defined a set of 24 sequence and structural features for all known miRNA precursors from miRBase version 1 to 21. These contain the minimum free energy, base composition, miRNA length and many others (the full list is available in the Methods section). Since the set of features partially considers the 3p and 5p miRNAs stemming from one precursor, we only included precursors with two annotated forms in our analysis. Each precursor has also been assigned with the first miRBase version its accession number has been mentioned in the miRBase, which means that each precursor is only taken into account for the miRBase version it was first listed and not for later versions. Since the first versions of the miRBase contain predominantly the stem loop sequences, i.e. the product of the processed pri-miRNA by DICER, and the later versions the actual precursor sequences that are trimmed at the 5′ and 3′ end of the two mature miRNAs, we would potentially observe a bias towards shorter precursor sequences with increasing miRBase versions. To account for this effect, we performed all analyses on the actual precursor sequences and trimmed all miRBase sequences accordingly.
First, we considered changes of the features for each miRBase version separately. Since in some cases, however, just few novel precursors have been added, we grouped the versions in six batches: (I) version 1–4, (II) version 5–7, (III) version 8–11, (IV) version 12–16, (V) version 17–19 and (VI) version 20–21. An overview of these six sets and the number of precursors they contain is given in Table 1.
ANOVA testing suggested that all of the 24 features significantly vary dependent on the miRBase versions (FDR adjusted P-value below 0.05—all P-values with median per feature and miRBase version are provided in Supplementary Table S2). Considering the base composition, we noticed an increase of Guanine (G) (Figure 1A) and Cytosine (C) and a decrease of Adenine (A) and Uracil (U) in the precursor sequence from the first miRBase versions (1–4) of 24%, 21%, 25%, and 30% to 30%, 30%, 17%, and 23% in the last miRBase versions (20–21), respectively. Correspondingly, we observed this increase in percentage of Guanine for the 5p-miRNA (23% to 48%) and for Cytosine in the 3p-miRNA (23% to 43%) (Figure 1B and C), as well as a decrease of Uracil in the 5p-miRNA (32% to 17%) and of Adenine in the 3p-miRNA (24% to 13%). Despite this shift to a higher G/C content, which should have a stabilizing effect, the minimum free energy for the precursor is only slightly lower when comparing versions 1–4 and 20–21 (Figure 1D). The minimum free energy of the precursor is an important feature that may directly influence the secondary structure. The minimum free energy increased from version 1–4 (-24.7 kj/mol), 5–7 (−24.8 kj/mol), 8–11 (−26.1 kj/mol), 12–16 (−29 kj/mol) to −30.45 kj/mol in versions 17–19 and decreased again to −26.35 kj/mol in versions 20–21. Besides these sequence and structural features, we also observed some differences in the chromosomal clustering of precursors. While in versions 5–7 we found a maximum median value of 9.5 precursors in a 50 kb window around the precursors in the set, we detected a median value of 0 for the remaining later versions (adjusted P-value of 8.5*10−69). Using the 24 described features, we propose a method for prioritizing predicted precursors/miRNAs to facilitate further experimental validation.
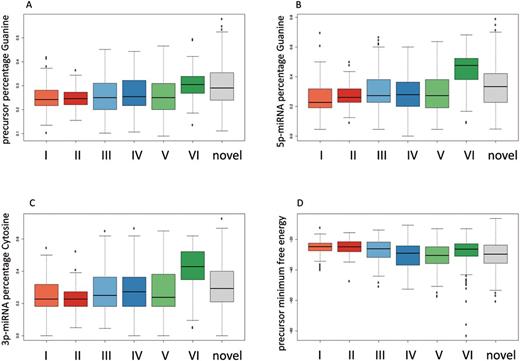
For different features, the distribution across different miRBase versions is presented as Box-Whisker plots. The novel miRNAs discovered in our study are included in grey. The miRBase version sets are numbered according to Table 1.
In several case-control studies, we carried out NGS from blood of altogether 705 individuals. For each individual a separate sequencing library preparation followed by sequencing on Illumina HiSeq has been carried out. Altogether, we generated a total of 9.7 billion miRNA reads for the 705 samples (≈13.5 million reads per sample). By applying miRDeep2, we generated a set of 1452 potentially novel miRNA precursors. After mapping them back in a first step to different RNA resources as described in the Methods section, aiming to exclude initial false positive candidates, still 518 miRNA precursor candidates remained. For these, we calculated the same features as described above and included them also in the Box-Whiskers in Figure 1A–D (grey boxes at the right edge). As these data show, the novel miRNA precursors match well to the later miRBase versions 17–19 or 20–21 while only a small portion seems to be close to the miRNA precursors in early versions (1–4, 5–7) of the miRBase. The latter may be the most promising novel miRNAs, minimizing a potential NGS bias. To show the similarity of precursors to each other with respect to the 24 features, we carried out a hierarchical clustering. As Supplementary Figure S1 demonstrates, the early versions represented in orange tend to cluster strongly together, closest to them are the middle versions shown in blue and the green and grey miRNAs from version 20–21 as well as the novel miRNAs scatter around. The same behaviour can be observed in a principal component analysis, presented in Figure 2. Here, each dot corresponds to a 2D representation of the 24 features for each miRNA precursor. The colouring of the dots again represents the miRBase batch, analogously to the colouring in the cluster analysis. While the red / orange and blue dots are central, especially the green and grey plots accumulate at the edges of the plot.
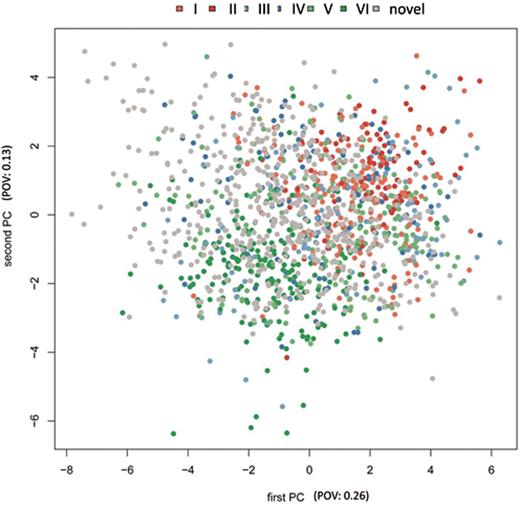
Principal Component Analysis. The early miRBase versions in red (sets I + II, see also Table 1) fit well to each other and show a central cluster. The middle versions of the miRBase in blue (III + IV) still fit nicely to these initial miRNA precursors, while the newer versions (V + VI) and the miRDeep predicted precursors in green and grey scatter at the edge of the distribution. POV: proportion of variance.
A key challenge for differentiating between true and false positive miRNA precursor candidates is the availability of a reasonable positive set (i.e. actually validated miRNAs) and negative set (i.e. sequences that are not miRNAs). While at least the early miRBase versions represent such a positive set, creating a correct negative set represents a major challenge, since miRNA genes are distributed throughout the whole genome (21). We thus implemented an approach, which relies just on the distance from the core miRNA precursors and extracted those precursors that matched the early versions best in the overall feature pattern. We considered the early miRBase versions (1–7) as the positive reference set and calculated for each of the features the z-score. By using our web-service novo-miRank the reference sets can be freely determined by other researchers using a graphical user interface. To minimize the influence of single features, the maximal absolute z-score was set to 3. The mean value of the absolute z-scores was then calculated, representing the distance of the miRNA precursors from an ‘average’ precursor. Based on the mean and standard deviation in version 1–7, we also calculated distances for the remaining miRBase versions and the novel miRNA precursors. These are shown as histogram plots in Figure 3. Here, the middle versions (v8-v16) show still a good proximity to the early versions while the later versions 20–21 and especially the novel miRNA precursors from our study are shifted significantly to the right, corresponding to higher distances from the reference distribution. The shift between the reference versions 1–7 and the novel miRNA precursors indicates only a small overlap between both distributions.
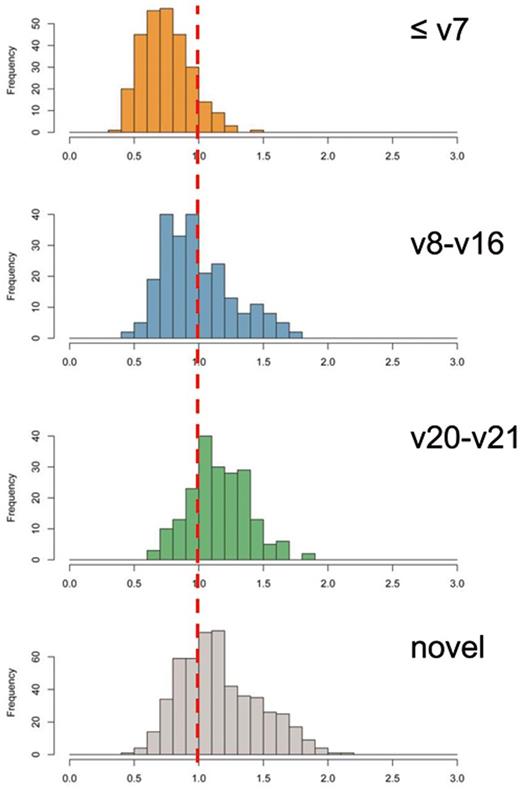
Histogram blot of the absolute value of average z-scores from early versions of miRBase. With increasing version the distance from the initial miRNA precursors increases significantly.
Next, we asked whether our scoring and ranking approach is redundant to the score provided by miRDeep2. To test this, we correlated both scoring approaches to each other. The Spearman correlation demonstrated with a rho value of −0.02 and a significance value of 0.7 that both scores do not correlate with each other. In addition, we predicted for all 518 precursors the secondary structure with RNAfold and manually sorted them into a good and a bad structure set (see Supplementary Data 1 and 2). We only added precursors in both sets that seemed likely to be a reasonable precursor or not. This way, we had at the end 34 precursors in the bad structure set, and 60 in the good structure set. We extracted for both sets the original miRDeep2 scores, as well as our z-score measure. Since our score is a distance measure, we would expect that the good structures have a lower score than the bad structures. On the other hand, the miRDeep2 score is a transformed probability that assesses how likely the precursor is a real precursor, such that we would expect this score to be higher for the good structures. To test these hypotheses, we computed a Wilcoxon Rank Sum test for the miRDeep scores of the good set and the bad set, which yielded no significant difference (two-tailed test). In contrast, our distance score showed a statistically significant difference between both sets (P-value < 0.0005, two-tailed; P-value < 0.0002 for one-tailed test, scores significantly smaller for good structures).
In Figure 4A and B, we show the secondary structure as predicted by RNAfold for novel-mir-1570 and -mir-1005, which represent ‘typical’ precursors according to our score. On the right side of the figure, we summarized the normalized base counts over all samples for the predicted precursors. The 3p miRNAs are in both cases much higher expressed than the 5p miRNAs. We picked both precursors and their miRNAs for experimental validation and obtained specific amplification products using qRT-PCR for three of these. The fourth miRNA novel-miR-1570–5p showed no specific product, however this potential miRNA is only weakly expressed as shown in the base counts plot. In Figure 5A and B we present the secondary structure and base counts of two novel precursors, which are very divergent to a ‘typical’ precursor according to our score. Figure 5A shows the lowest scoring precursor (novel-mir-712) considering the list of 518 potential precursors. The novel-mir-712 has a much lower minimum free energy (−46.9 kj/mol) than, e.g. the novel-mir-1570 (−37.7 kj/mol) from Figure 4A, however the predicted structure does not look like a ‘typical’ miRNA precursor. Additionally, the base composition of the lowest scoring precursor consists almost solely of Guanine and Cytosine. Another example is shown in Figure 5B. The precursor novel-mir-1027 with length of 104 bases and a 27 base 5p-miRNA also deviates in the G/C content from ‘typical’ miRNA precursors and does not build the characteristic stem loop. In addition, the summarized normalized base counts for this precursor do not show the typical expression profile of miRNAs as can be observed for example for novel-mir-1005 in Figure 4B, although we did not use the read counts as feature for our scoring.
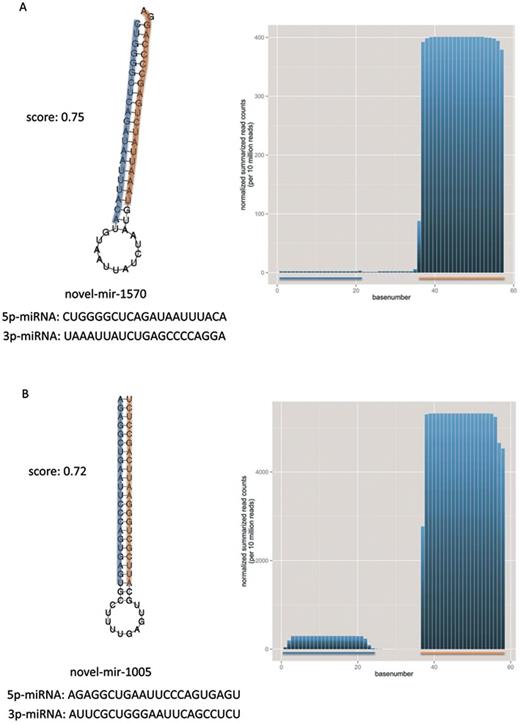
Selected examples of secondary structures for miRNA precursors having a good score in our ranked list. Each panel presents one miRNA precursor along with the 5p- and 3p-miRNA in orange and blue. Additionally, the mature sequences and the overall distance (score) from the reference distribution (miRBase v1–7) is provided, as well as the summarized normalized base counts (per 10 million reads) over all samples for these precursors are illustrated.
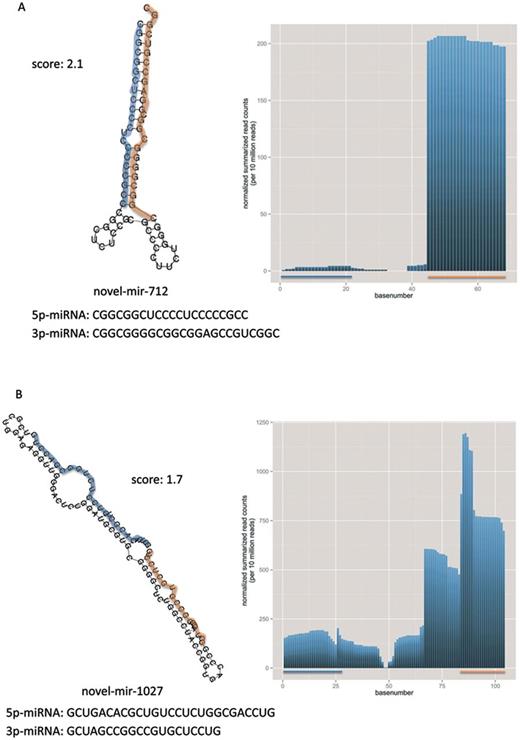
Selected examples of secondary structures for miRNA precursors having a bad score in our ranked list. Each panel presents one miRNA precursor along with the 5p- and 3p-miRNA in orange and blue. Additionally, the mature sequences and the overall distance (score) from the reference distribution (miRBase v1–7) is provided, as well as the summarized normalized base counts (per 10 million reads) over all samples for these precursors are illustrated. Panel A shows the most divergent miRNA precursor according to our score. Panel B shows the miRNA precursor with overall highest length.
The presented analysis for our 518 putative novel miRNA precursors in comparison to the miRBase versions 1–7 can also be run in our online tool novo-miRank, which is available at: www.ccb.uni-saarland.de/novomirank. We provide the 518 putative precursors in the batch analysis option as downloadable example GFF file, as well as the computed feature table in Supplementary Table S3.
For experimental validation, we picked in total 15 mature miRNAs from the list of the ranked miRNA precursors (Supplementary Table S3) and performed quantitative real-time PCR. Specific amplification products additionally verified by conventional Sanger sequencing were obtained for 11 novel mature miRNAs (Figure 6A and B, Table 2 and Supplementary Table S4). As validation of correct processing of a novel precursor, we expressed novel-mir-1005 in HEK293T cells and performed northern blots to confirm presence of mature miR-1005–5p and -3p. As seen in Figure 6C and D, mir-1005 precursor has been processed into both mature forms, demonstrating its functional processing in the DICER complex. To verify the the right size of the novel miRNAs we stripped both nylon membranes and hybridized them with specific radioactive labelled probes of the highly confident miR-20a-5p, which was firstly discovered and also validated by northern blotting by Tuschl et al. in the year 2001 (22).
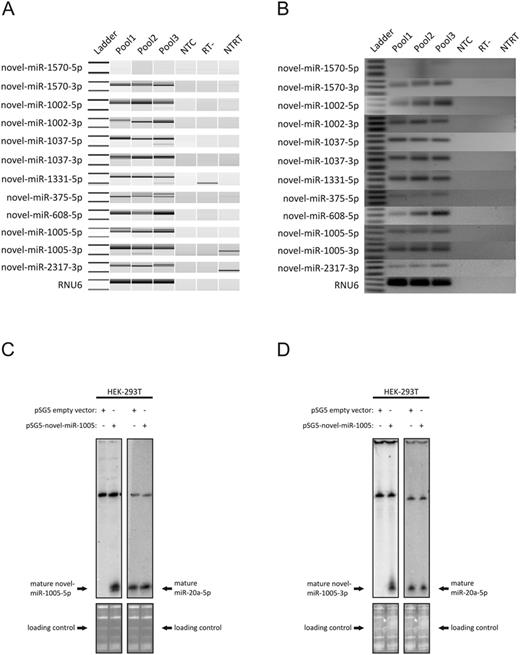
Validation of novel miRNAs by qRT-PCR and northern blots. Panel A shows amplification products of qRT-PCR in three RNA Pools (P1-P3) on Bioanalyzer DNA 1000 Chip, Panel B on conventional 3% agarose gels. Negative controls included a no template control for reverse transcription (NTRT), a RT reaction without enzyme (RT-) and a no template PCR control for each specific primer (NTC). As the used qRT-PCR system depends on poly-adenylation at the 3′ end of mature miRNAs followed by reverse transcription using an oligo-dT primer that includes a universal tag sequence for the qPCR, amplification products of mature miRNAs are ≈80–95 bps depending on the number of A′s added to the miRNA sequence. The ladder bands shown represent 50 and 100 bps. For 11 miRNAs specific bands at 80–90 bps could be detected. All PCR products were subcloned into pGEM and Sanger sequenced (see Supplementary Table S4) to verify specific amplification of novel miRNAs. Panels C and D show northern blots detecting mature miRs-1005–5p (C) and -3p (D) with sequence specific radio-labelled probes (left side) in HEK293T cells transfected with pSG5 vector with inserted mir-1005 precursor sequence. The right size of the novel mature miRNAs was confirmed by the stripping and rehybridization of both nylon membranes with specific radio-labelled probes of the high confident miR-20a-5p (right side). Loading control demonstrates equal RNA amounts in all lanes.
Experimentally validated novel miRNAs
| Novel miRNA name | Sequence | Performed experiments |
|---|---|---|
| miR-1005–5p | AGAGGCUGAAUUCCCAGUGAGU | qRT-PCR, Northern blot, Sanger |
| miR-1005–3p | AUUCGCUGGGAAUUCAGCCUCU | qRT-PCR, Northern blot, Sanger |
| miR-1037–5p | CAGGGAUCAGAUCUUAUGUUC | qRT-PCR, Sanger |
| miR-1037–3p | CUAGCAUAAGACUGAUCCUCC | qRT-PCR, Sanger |
| miR-1002–5p | AUCCCCAGGAAAAUGCCUUUU | qRT-PCR, Sanger |
| miR-1002–3p | AAAGGCUUUUUCCUUGGGGGUU | qRT-PCR, Sanger |
| miR-2317–3p | UAUCCUCCAGUAGACUAGGGAG | qRT-PCR, Sanger |
| miR-375–5p | UUAGCCAGAGUUCCUAAAGAAA | qRT-PCR, Sanger |
| miR-1570–3p | UAAAUUAUCUGAGCCCCAGGA | qRT-PCR, Sanger |
| miR-1331–5p | CCCAAACCUUGUCUGGACAUGG | qRT-PCR, Sanger |
| miR-608–5p | AAAGCAAAUGUUGGGUGAACGG | qRT-PCR, Sanger |
CONCLUSION
Our analysis of miRNA properties between different miRBase versions shows a substantial influence of all considered features depending of the version of this reference database. Generally, we observe a tendency of decreasing similarity from the initial miRBase versions for almost all considered features. Especially the increasing usage of complex high-throughput approaches along with respective in silico methods makes a certain percentage of false positive miRNAs likely. While these results do not imply that even the miRNAs with very aberrant features are actually no miRNAs but false positives, we assume that the likelihood of true miRNAs among those with similar features are higher. Therefore, we developed a tool to rank miRNA candidates from high-throughput NGS experiments to select the most promising candidates for experimental validation.
Own studies on 705 individual NGS miRNA sequencings totalling 9.7 billion reads delivered 1452 potentially novel miRNAs. Given the current number of known miRNAs, these candidates obviously contain many false positives. Already, an initial mapping to various RNA resources excludes over 900 candidates, leaving 518 potential miRNAs. By matching them to the features derived from the miRBase analysis, we ranked all novel miRNA candidates. This analysis suggested novel miRNAs that matched well to the set of miRNAs derived from the initial miRBase. Using this list, we selected a miRNA for experimental validation and confirmed the putative as novel miRNA. Additionally, we observed novel candidates that are likely not processed biologically. Beyond the features considered in this study, others such as the degree of homology between organisms, the number and quality of target genes and others could be added to further improve the accuracy of predicting novel miRNAs from NGS data.
We thank Siemens Healthcare for contributing to the data generation. This work has been funded in parts by the EU Bestageing grant.
FUNDING
Funding for open access charge: European Union FP7 (BestAgeing) grant.
Conflict of interest statement. None declared.
REFERENCES

Comments