


Abstract
The Genomes OnLine Database (GOLD, http://www.genomesonline.org/) is a comprehensive resource for centralized monitoring of genome and metagenome projects worldwide. Both complete and ongoing projects, along with their associated metadata, can be accessed in GOLD through precomputed tables and a search page. As of September 2011, GOLD, now on version 4.0, contains information for 11 472 sequencing projects, of which 2907 have been completed and their sequence data has been deposited in a public repository. Out of these complete projects, 1918 are finished and 989 are permanent drafts. Moreover, GOLD contains information for 340 metagenome studies associated with 1927 metagenome samples. GOLD continues to expand, moving toward the goal of providing the most comprehensive repository of metadata information related to the projects and their organisms/environments in accordance with the Minimum Information about any (x) Sequence specification and beyond.
INTRODUCTION
The Genomes OnLine Database (GOLD) provides a centralized resource for the continuous monitoring of genome and metagenome sequencing projects worldwide, uniquely integrated with their associated metadata and is currently in its fourth version since its launching in 1997 (1–5). The number of registered sequencing projects has almost doubled since the publication of the previous report 2 years ago (5). As of September 2011, 11 472 projects have been registered, versus 5843 in September 2009 (5), 2905 in September 2007 (4) and 1575 in September 2005 (3) (Figure 1A). This rapid growth is mainly attributed to decreasing costs due to advances in sequencing technologies, instigating several large-scale microbial genome sequencing initiatives, such as the Human Microbiome Project (HMP; http://www.hmpdacc.org/) (6) and the Genomic Encyclopedia of Bacteria and Archaea (GEBA; http://www.jgi.doe.gov/programs/GEBA/) (7). During this period, GOLD has also expanded its scope beyond standard genomic and metagenomic projects to now encompass data from the growing number of resequencing, transcriptome, metatranscriptome and single cell sequencing projects.
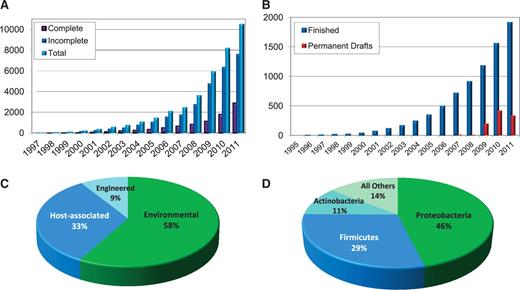
Statistical information from GOLD data as of September 2011. (A) Evolution of the complete, incomplete and total number of projects monitored in GOLD. Genome projects in GOLD: 11 472. (B) Evolution of the complete projects monitored in GOLD separated into finished and permanent drafts. Complete genome projects in GOLD: 2907. (C) Distribution of the 340 metagenome projects in GOLD across the three major metagenome classification categories. Classification distribution of metagenome projects 340. (D) Phylogenetic distribution of the 8.448 bacterial genome projects.
Among the most important developments of the database during the last 2 years are those coupled to the growth of the metadata and metagenome projects. These include the implementation of GOLD-specific controlled vocabularies (CVs) for the representation of the associated data, in coordination with the Genomics Standards Consortium (GSC) (8) complying with its recommendations for the Minimum Information about any (x) Sequence (MIxS) specifications (9). Additionally, GOLD has implemented the canonical metagenome naming and standardized classification for all metagenome projects, as it has been proposed in 2010 (10). Finally, GOLD has placed emphasis on the rapidly advancing field of metagenomics through (i) increasing the number of metadata fields associated with metagenomic samples, classifying them in separate categories for metagenomic sample info, sequencing info, environment metadata and host metadata; (ii) depicting the metagenome sample metadata in separate GOLD cards under a new GOLD ID, marked with the ‘Gs’ prefix; (iii) providing separate tables for metagenome sample data lists and (iv) adding a new metagenome advanced search option under the ‘Search Gold’ page.
As the rate of launching new projects increases exponentially, the task of monitoring and recording their data along with their metadata is now a sine-qua-non-condition for the coordination of the genome sequencing scientific community worldwide. Accordingly, accurate project and metadata tracking through GSC compliant registration are strongly recommended.
Integration of genomic and metagenomic data with their associated metadata adds significant value to both and can facilitate better educated comparative analysis and biological interpretations of the sequence data. For that purpose, the GOLD metadata are integrated into the Integrated Microbial Genomes (IMG) family of data management systems (11–13).
CURRENT DATABASE STATUS
The year 2011 represents yet another landmark in the history of genome sequencing projects: the registration and tracking of 10 000 projects. As of September 2011, GOLD documents 11 472 ongoing and complete genome projects, an almost 2-fold increase from past 2 years (5). These comprise 8473 bacterial (whose phylogenetic distribution can be seen in Figure 1D), 329 archaeal and 2204 eukaryal genomes. Additionally, 340 metagenomic projects are tracked with a total of 1927 samples associated with them, a 1.5-fold increase in projects and 4-fold increase in samples since 2009 (5). The classification distribution of metagenome projects is presented on Figure 1C. GOLD also tracks well over 1000 proprietary projects, currently not available to the public, whose metadata will be accessible once the PIs of these projects give consent for their public release. In terms of status, 1914 genome projects are completely sequenced and their final sequence has been released from GenBank. These projects are identified as ‘Finished’. From those, 1644 are bacterial, 117 are archaeal and 153 are eukaryal. A constantly increasing number of projects are completed at the level of a draft genome and their final is submitted in GenBank. These projects are identified as ‘Permanent Draft’ genomes. There are currently 989 projects at this stage (28 archaeal, 949 bacterial and 12 eukaryal), and their rapid growth during the last few years is presented in Figure 1B. The total number of complete genomes projects is the sum of the finished and the permanent draft genomes, with a total of 2907, as of 20 September 2011.
GOLD INTERFACE
The entry page
In the entry page of GOLD (http://www.genomesonline.org/), the user is presented with a main table of shortcut links that allow multiple options of viewing and searching the registered projects, followed by a Google Map application programming interface (API) indicating the project isolation information, where available, either in clusters or in isolates. By selecting any of the genome isolates or metagenome samples in the adjacent lists, the user can view a pop-up window, pinpointing to the exact collection location of the organism or sample, with an image for it and a link to its GOLD CARD page through its hyperlinked GOLD ID.
The front table has been changed since 2009 in order to depict more efficiently the trends and current status in genome and metagenome sequencing projects. The main data entry points for genome projects have now been organized after the three main project status categories: complete, incomplete and targeted, as opposed to the phylogenetically based structure of version 3.0. The user can also find shortcuts for dynamically tracked cumulative metrics of genome project distribution according to project type, sequencing status and phylogeny, as was in version 3.0. An additional table with shortcut links for metagenome projects, metagenome samples and metagenome classification has been added.
Following any of the above shortcuts pertaining to projects (complete, incomplete, targeted, metagenome projects or samples), the user is redirected to a new page whose header provides a breakdown of the projects according to (i) project type (archaeal, bacterial and eukaryal for genomes and environmental, engineered and host-associated for metagenomes) and (ii) sequencing type (finished, permanent draft, complete but not published, draft, in progress DNA received, awaiting DNA, where applicable). The header is followed by a table that provides information for several preselected primary metadata fields. By default, projects are sorted by GOLD IDs, with sequential numbers assigned in order as projects are entered in GOLD. The data can be sorted by any other column in descending or ascending order by clicking the column header. GOLD IDs are hyperlinked, directing to the GOLD cards of the projects, while NCBI taxonomy, NCBI Entrez, NCBI GenBank accession IDs, sequencing centers, publications and contact information of the principle investigators (PIs) of the projects, where available, are also hyperlinked directing to the respective web pages.
The GOLD CARD page has also been extensively redesigned, making for more intuitive navigation. Genome project, metagenome project and metagenome sample data are now organized into seven major categories for easier access. Google map location and images of the organisms are provided when available. Empty data rows can be hidden by clicking the arrow located at the upper right corner of the card. The GOLD CARD page complies with the GSC standards (8) and provides IDs and links for all the compliant data fields. The list of metadata fields provided by GOLD, includes those currently part of the MIxS specifications plus many more that are now candidates for inclusion in the MIxS list (9).
To achieve all this, GOLD tables have been further visually enhanced using advanced graphical technologies such as EXT JS JavaScript library for the grids, Yahoo User Interface Library for the pie charts and data tables, the Google Maps API for geographical location display, Google MarkerCluster for improved visual display of multiple map locations and the JavaScript Object Notation (JSON) data format for rapid data loading.
Search page
Under the Search GOLD link in the entry page, there are four options delimited in equal numbered tabs:
‘Search GOLD’, where Boolean queries can be made based on combined selections of the most frequently used search fields, namely Organism, Genome Project and Sequencing information. These queries yield as a result of a complete interactive list of the projects with chosen characteristics, below a Google Map showing with the geographic location of the collection of such organisms, where available.
‘Advanced Search’, where the extra options of Environmental metadata, Host metadata, Organism metadata and Metagenome classification are provided besides the ones listed in the first tab for conducting advanced queries. These advanced queries once more return the complete interactive list of projects with chosen characteristics below the standard Google Map of collection sites of listed organisms.
‘Metagenome search’, a new search option, enables the user to search metagenome projects and samples by 10 metagenome study fields and 24 metagenomic sample fields. This type of query returns a complete interactive list with the chosen characteristics of metagenome projects or samples and the standard Google Map.
‘Metadata Search’, where queries can be made in only one of more than 40 metadata fields, giving as a result interactive graphical displays and ranking tables with the distribution of the projects in GOLD according to the particular metadata chosen. By following the links in the parameter values of these tables, a user can get again of the complete interactive list of the projects based on the specified value of the table parameter. For example, a search by sequencing center will show the distribution of projects listed in GOLD according to the sequencing center (Figure 2A). According to this category, Joint Genome Institute (JGI) holds the first place with 2075 registered genome projects, or roughly the 18% of all sequencing projects in the world. Selecting the project number link next to the sequencing center name, the user can view the complete interactive list of public projects undertaken by that sequencing center. Four major sequencing centers account for about 45% of the 11 472 sequencing projects currently registered in GOLD (Figure 2A) compared to the 60% of projects for the same centers 2 years ago (Figure 2B). We anticipate that this trend will continue over the next few years as a result of the democratization of the sequencing technology. The same trend is revealed when examining only archaeal and bacterial projects. The two leading sequencing centers (JGI and J. Craig Venter Institute) now represent a smaller share: about 35% compared to >50% just 2 years ago (data available from GOLD).
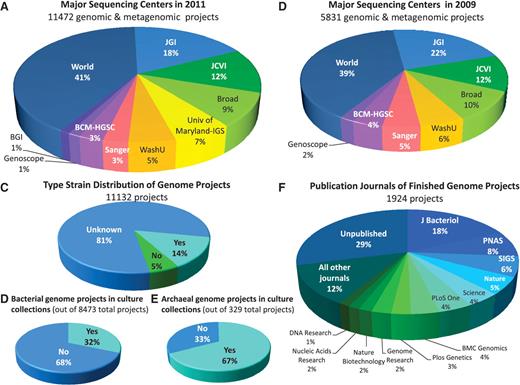
Project and metadata information available from GOLD. (A) Distribution of the 11 472 genomic and metagenomic projects in GOLD as of September 2011, across the major sequencing centers. (B) Distribution of the 5831 genome projects in GOLD in September 2009 across the major sequencing centers. Abbreviations: JGI, Joint Genome Institute; JCVI, J. Craig Venter Institute; Broad, Broad Institute; Univ of Maryland–IGS, University of Maryland, Institute for Genome Sciences; WashU, Washington University; Sanger, the Wellcome Trust Sanger Institute; BCM-HGSC, Baylor College of Medicine Human Genome Sequencing Center; WORLD, all other sequencing centers. (C) Distribution of the 11 132 total genome projects in GOLD according to type strain. (D) Percentage of the 8473 bacterial genome projects for which a culture of the sequenced strain is available from one of the public culture collections. (E) Percentage of archaeal genome projects for which a culture of the sequenced strain is available from one of the public culture collections. (F) Distribution of publications of finished genome projects across publication journal.
Other metadata search can provide interactive pie charts for metadata such as the number of genome projects for type material (Figure 2C) or the number bacterial or archaeal genome projects with a culture of the sequenced strain deposited in public culture collection (Figure 2D and E) as well as the number of finished projects with a genome publication, if one is available (Figure 2F). From these metadata searches, the user can see that only 14% of all bacterial projects are targeting type material (Figure 2C). Additionally, a striking antithesis can be witnessed in terms of depositing the organisms that is sequenced in culture collections between Archaea and Bacteria. Two thirds of the sequenced archaeal organisms have been deposited in culture collection banks, while two thirds of sequenced bacterial have not (Figure 2D and E).
A very interesting observation is that an increasing number of complete projects do not have an associated publication in the literature. This is certainly attributable to the more frequent release of sequence data to the community prior to publication in compliance with the rapid prepublication data release policies and recommendations (14) and the parallel increase in larger scale efforts that involve the sequencing of several hundred organisms (e.g. HMP), where preparation of the typical detailed publication describing the genome of every single organism can be quite difficult (15). To provide a GSC-compliant citable record for every completed genome project and its metadata, an open access scientific journal, Standards in Genomic Sciences, (http://standardsingenomics.org/) has been launched 2 years ago (16), which is currently cataloging more than 120 finished or draft genomes in an orderly and standardized manner (Figure 2F).
Apart from the graphical displays and statistics in GOLD's advanced search engine, graphical overviews for specific data types are provided via the ‘Gold Statistics’ link on the database home page (http://genomesonline.org/gold_statistics.htm).
GENOME PROJECT ONTOLOGIES
As the number of projects monitored by GOLD is rapidly increasing, a number of key data type ontologies have been developed for the more accurate description of the sequencing projects. A few examples are described below.
Project type distribution
Until 2 years ago, the projects monitored for GOLD were predominantly ‘Genome’ and ‘EST’ sequencing projects, supplemented by a small number of ‘Genome-Surveys’ and ‘Genome-Regions’ (the latter representing some eukaryal projects focused on specific genomic regions). The increasing number of resequencing and transcriptome projects prompted the addition of these two new project types in 2009, and the subsequent introduction of the GOLD IDs ‘Gr’ for resequencing and ‘Gt’ for transcriptomes. While in 2007 GOLD tracked 2158 projects, in 2009, 4543 were tracked; currently it holds 9478 genome projects (8309 bacterial, 308 archaeal and 1471 eukaryal), 442 transcriptome projects (4 bacterial and 438 eukaryal) and 287 resequencing projects (84 bacterial and 203 eukaryal). Moreover, there is a total of 84 uncultured projects (18 archaeal, 65 bacterial and 1 eukaryal), a number which we expect to increase significantly due to the recent advances in single cell sequencing technologies. Following the link in each number in the table of the Project Type Distribution, the user can be redirected to the entire list of the projects under the specific category, which has an embedded Google Map API with the geographic location of the project isolation, where available.
Project and sequencing status distribution
A lot of confusion exists for what is the status of a project. In order to describe this more accurately, GOLD has been monitoring separately the status of the project and its sequencing status. The first corresponds to the overall project status, while the second only to the sequencing part of the project. Accordingly, the sequencing of a project may have been completed but the project may remain incomplete, because the data have not yet been deposited to the International Nucleotide Sequence Database Collaboration (INSDC). A different set of CVs has been developed and implemented for each of the two metadata fields as shown on Table 1.
Project and sequencing status definitions and number of projects
| Project/sequencing Status | Definition | Projects | |
|---|---|---|---|
| 1. | Complete | Genome project has been completed and the final sequence is deposited in INSDC | 2907 |
| Finished | Completely sequenced and deposited in INSDC | 1918 | |
| Permanent Draft | Draft sequenced and deposited in INSDC | 989 | |
| 2. | Incomplete | Genome project is incomplete | 7629 |
| Complete | Completely sequenced but not yet deposited in INSDC | 25 | |
| Draft | Draft sequenced and deposited in INSDC | 1568 | |
| In progress | Sequencing is in progress but no available sequence yet | 3404 | |
| DNA received | DNA has been received by sequencing center | 211 | |
| Awaiting DNA | DNA has not yet been received by sequencing center | 437 | |
| 3. | Targeted | Project is targeted, but has not yet been picked by any sequencing center | 445 |
As the cost of genome finishing has not yet dropped proportionally to the drop in cost of sequencing, an increasing number of sequencing projects are completed at the draft stage. GOLD is now monitoring those types of projects and a distinction is made between finished and permanent draft projects, while both are presented under the complete genome projects list. For all of these projects, the genome sequence is ‘completed’ by depositing the final version of the project in one of the public archival databases such as GenBank (17), European Molecular Biology Laboratory (EMBL) (18) and DNA Data Bank of Japan (DDBJ) (19). Again each number in the table of the sequencing status distribution is linked to the entire list of the projects under the specific category, which has an embedded Google Map API with the geographic location of the project, where available.
PHYLOGENETIC DISTRIBUTION
Following the link of phylogenetic distribution, the user can acquire a GOLD data breakdown of the number of classified subdivisions with genome projects (for each of the five main taxonomic levels) over number of the classified subdivisions of each phylogenetic group (Table 2).
Number of classified subdivisions with genome projects over the number of classified subdivisions of this phylogenetic group and the coverage of genome projects per taxonomic level
| Domain | Projects | Phyla | Class | Order | Family | Genus | ||||||
|---|---|---|---|---|---|---|---|---|---|---|---|---|
| 2011 | 2009 | 2011 | 2009 | 2011 | 2009 | 2011 | 2009 | 2011 | 2009 | 2011 | 2009 | |
| Archaea | 327 | 179 | 5/5 | 5/5 | 10/10 | 10/10 | 18/18 | 18/18 | 28/29 | 24/26 | 96/118 | 85/109 |
| Percentage coverage | 100 | 100 | 100 | 100 | 100 | 100 | 97 | 92 | 81 | 78 | ||
| Bacteria | 8458 | 4184 | 32/34 | 27/29 | 51/53 | 45/47 | 109/118 | 234/281 | 254/298 | 234/281 | 885/2106 | 730/1930 |
| Percentage coverage | 94 | 93 | 100 | 96 | 92 | 83 | 85 | 83 | 42 | 38 | ||
| Eukarya | 2205 | 1280 | 33/57 | 29/55 | 93/182 | 80/188 | 258/1037 | 350/6288 | 458/6689 | 350/6288 | 729/54 K | 536/48 K |
| Percentage coverage | 58 | 53 | 51 | 43 | 25 | 6 | 7 | 6 | 1 | 1 | ||
For example, the values 96/118 of archaeal genome projects at the Genus level in 2011 correspond to 96 archeal genera with genome projects of a total of 118 genera described. The NCBI taxonomic information is used to generate the information of known classified subdivisions per taxonomic level. The corresponding information from the 2009 GOLD release is also provided for comparative purposes for each taxonomic level as well as the percentage of coverage of the classified subdivisions per taxonomic level. It is interesting to note that the genome project coverage at the Genus level for Archaea has reached 81%, while for Bacteria and Eukarya, the genome coverage stands at 42% and 1%, respectively. It is also interesting to observe that while the number of new species and genera has been steadily increasing in all three domains during the last two years, the rate of coverage of each taxonomic subdivision with genome projects is growing at an even faster pace. An interactive graphic display (pie chart) and an interactive table for each of the different classes of organisms are available from this table in GOLD.
The sampling bias of genome sequencing projects favoring the three major bacterial lineages (Proteobacteria, Firmicutes and Actinobacteria) in 2009 (5) has actually increased during the last couple of years from 80% to 86% today despite the large-scale sequencing efforts, such as the GEBA (7) and HMP (6), which target previously neglected phylogenetic lineages (Figure 1D). Clearly, there remains much room for improvement of the phylogenetic coverage here, and further progress can be expected with similar large-scale biodiversity sequencing efforts scaling up as well as with the increase in uncultured genome projects.
METAGENOMICS DATA
Metagenome studies and metagenome samples
During the past 2 years, a growing number of metagenomic studies were added on GOLD. The database currently reports 340 studies associated with 1927 samples an almost 1.5-fold increase compared with the 200 distinct metagenomic studies (previously called projects) in 2009 and a fourfold increase in samples compared with the 453 of 2009. To facilitate the visualization of metagenome samples independently of the metagenome studies with which they are associated, we introduced a new GOLD ID for samples, the ‘Gs’. Moreover, we provided in the main page a new shortcut button for the interactive listing of all metagenomic samples, a Google Maps API marking the geographic location of their isolation and a new advanced metagenome search option under the Search Gold link.
Metagenome naming and classification
During project registration, it is critical to ensure that both study and samples follow the standardized naming convention and classification scheme as were previously described (10). The standardized metagenome naming convention consists of four major components analogous to the schema used for naming isolate organisms (i.e. genus, species, subspecies and strain). These are:
Habitat: used to provide a specification of the study/sample habitat, e.g. sediment, soil, marine, termite gut, wastewater, etc.
Community: Specification of the microbial community sampled, e.g. microbial/bacterial, viral, archaeal or other.
Location: Specification of study/sample location, e.g. black sea, etolikon lagoon, healthy adults, etc. Geographic longitude and latitude for environmental samples are required as MIMS (minimum information about metagenomic sequence/sample) (20)
Identifier: Specification of study/sample identifier, which describes anything that can identify the specific type of the community such as chlorotrophic, anoxygenic, time-series, thermal gradient, etc.
Accordingly, a study that examines viruses from the waters of the Black Sea that are acidified, will be named ‘Marine viral communities from the Black Sea, under conditions of ocean acidification’, as opposed to ‘Metagenome from viruses in acidified waters’ while a study examining microbial communities from sludge in bioreactors at University of California, Davis, will be named ‘Wastewater microbial communities from Enhanced Biological Phosphorus Removal (EBPR) bioreactor at University of California, Davis’, instead of ‘US sludge’. According to these ‘naming rules’ studies and samples are named and classified with the newly implemented hierarchical classification schema. The list of all metagenome studies and samples in GOLD according to this hierarchy is available online under the ‘metagenome classification’ link in the main page. The classification is expanding according to new Metagenome studies and based on users’ requests, and has already been adopted from the IMG with microbiome samples (IMG/M) database (11). Moreover, as of this year, the metagenome samples submitted for annotation and integration into IMG/M are no longer processed without prior standardized metagenome naming and classification or availability of minimum metadata information. We hope that in this way, we will improve the quality of the metagenomic data, and by effect advance data exploration through more accurate sample identification and selection.
The standardized classification scheme implemented in GOLD represents the first and so far the only proposed classification system for metagenomes. The five levels of classification are available for every study or sample through either the study or sample lists or under the metagenome search. The five levels are comprised of (i) Ecosystem (e.g. environmental, host-associated or engineered); (ii) Ecosystem category (e.g. terrestrial, aquatic, air, wastewater, food production, Human, Arthropoda, etc.); (iii) Ecosystem type (e.g. Freshwater, soil, respiratory system, skin, etc.); (iv) Ecosystem subtype (e.g. grass, oral, groundwater, etc.); and (v) Specific ecosystem (e.g. fecal, cave water, etc.) all of which provide a further division of the particular categories from which metagenomic samples are isolated.
The three ecosystem type categories under which all metagenome studies are classified currently hold 197 environmental studies when compared to 137 in 2009, 112 host-associated studies compared to 53 in 2009 and 30 engineered studies compared to 10 in 2009 (Figure 1C). Moreover, there are now 609 samples under environmental studies, 1067 under host-associated and 70 under engineered. The user can be directed to the interactive list of all metagenome samples, by selecting the corresponding shortcut link in the main page (Figure 3). The header of this list provides the breakdown of metagenome samples according to Engineered, Environmental and Host-associated projects. The main table of the list provides the GOLD ID ‘Gs’ for each sample, the sample name, the GOLD ID ‘Gm’ for the study to which the sample belongs, as well as the metagenome classification of the sample (Ecosystem, Ecosystem category, Ecosystem type, Ecosystem subtype and Specific ecocystem). The table also provides the name of the sequencing center that has undertaken the sequencing of the particular sample as well as the sample's size and its sequencing status. The data in the list can be sorted in ascending or descending order, by clicking any of its headers.
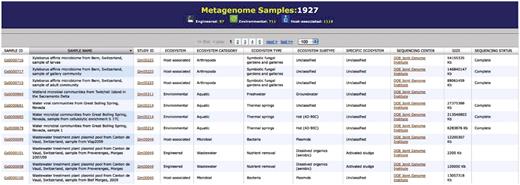
Metagenome sample list.
Beyond the interface: metadata collection and management system
The metagenome sample associated metadata have also undergone significant expansion in GOLD during the last 2 years. The number of metadata associated categories for metagenome sample description has increased from one in the previous release to four in GOLD v.4. These categories now include: (i) sample information, (ii) sequencing information, (iv) environmental metadata and (v) host metadata. Accordingly, the particular characteristics of metagenome samples have been decoupled from the metagenome studies, which can be quite broad and encompassing several classes of metagenome samples, such as environmental and host associated samples, or environmental samples collected from both marine and terrestrial environments. Similarly, the number of metadata fields assigned to genome projects has grown during the last 2 years. A large number of the metadata fields have been populated for all or most of the projects, while some fields (particularly newer ones) are yet to be curated for the majority of the projects. Special emphasis in the curation was given in ensuring that most metagenomic samples have isolation information and that most of the genomic projects have either environment or host metadata associated with them.
GOLD DATA OVERVIEW AND CONCLUSIONS
Genome project registration in GOLD has been steadily increasing over time with an average of 2-fold increase every 2 years for the past 14 years (Figure 1A). The microbial genome projects have been carrying the majority of that increase, yet as it is obvious from Table 1, the taxonomic groups with no registered projects have only slightly decreased in the past 2 years. In our last report of the database in 2009 (5), we had predicted the exact number of projects to be sequenced within the years 2010–2015 (11 000 drafts) based on a conservative approach; however, with a more radical one, we had predicted that this would be achieved by 2012. This milestone is already achieved and surpassed in 2011, at least in the number of projects. However, the total number of draft genomes is almost 3000, a strong 3-fold increase since 2009. We had also foreseen a higher number of finished genomes by the end of the first half of the decade (3000 finished projects). This number has almost doubled since 2009 from 1000 to 1918 finished sequences. Based on the data that GOLD currently holds, we anticipate that the number of genome projects will continue doubling every 2 years. However, the community will be most likely orientated toward generating permanent draft rather than finished genome sequences due to the cost efficiency of such strategies.
In the last 2 years, we also witnessed a 4-fold increase in the number of registered metagenome samples. We expect that this trend will expand in the next 2 years, possibly reaching even a 20-fold increase of metagenomic samples and a 10-fold increase in uncultured or single cell organisms. Grand scale sequencing initiatives that are currently launched such as the Earth Microbiome Project (EMP) (21), targeting the sequencing of thousands of samples, are promising to maintain this growth.
FUTURE DEVELOPMENTS AND CHALLENGES
GOLD continues to evolve to a universal catalog tracking genomic and metagenomic projects and associated metadata, while increasing in scope and complexity. It is, therefore, charged not only with the task of providing data interconnectivity, exchange and dissemination but also with establishing genomic standards, enforcing them and making sure that the community abides to them. We anticipate that the GOLD metagenome naming and classification will become extremely important for most scientists in the field in the coming years.
Due to its nature, GOLD happens to be in the middle of emerging trends in science and technology, such as ‘big data’ engineering, where the size of the data itself becomes part of the problem, and ‘data science’ that tackles the problem of integrating data from all sorts of resources and encompasses anything from statistics, machine learning, computer science and art. Big data demands all inclusive data platforms (not just internal repositories) that enable synchronization with other bioinformatics databases. These have to go beyond the relational database model, with flexible schemas such as NoSQL or nonrelational databases that provide eventual not absolute consistency and enable agile data analysis (e.g. Hadoop). Moreover, statistics and visualization are keys to data conditioning and analysis for such large data sets and packages such as GnuPlot are becoming crucial for getting insight in data trends and future trajectories. In the next years, GOLD will have to implement such database schemas and visualization capabilities not only to advance the scientific research in the field but to spearhead the front of bioinformatics databases.
FUNDING
Director, Office of Science, Office of Biological and Environmental Research, Life Sciences Division, US Department of Energy (DE-AC02-05CH11231); National Energy Research Scientific Computing Center, Office of Science of the US Department of Energy (DE-AC02-05CH11231); Genome and metagenomes projects and metadata associated with human host associated environment, US National Institutes of Health Data Analysis and Coordination Center (U01-HG004866). Funding for open access charge: University of California.
Conflict of interest statement. None declared.
ACKNOWLEDGEMENTS
We thank the members of the microbial genomics and metagenomics programs at the JGI for support, useful discussions and exchange of ideas. We would also like to thank Michelle Gwinn Giglio and Heather Huot from University of Maryland for valuable feedback and interactions for the Human microbiome related projects, as well as Lynn Schriml for feedback and help for the EnvO ontology.
REFERENCES
Author notes
The authors wish it to be known that, in their opinion, the first two authors should be regarded as joint First Authors.

Comments