


ABSTRACT
The PhosPhAt database of Arabidopsis phosphorylation sites was initially launched in August 2007. Since then, along with 10-fold increase in database entries, functionality of PhosPhAt (phosphat.mpimp-golm.mpg.de) has been considerably upgraded and re-designed. PhosPhAt is now more of a web application with the inclusion of advanced search functions allowing combinatorial searches by Boolean terms. The results output now includes interactive visualization of annotated fragmentation spectra and the ability to export spectra and peptide sequences as text files for use in other applications. We have also implemented dynamic links to other web resources thus augmenting PhosPhAt-specific information with external protein-related data. For experimental phosphorylation sites with information about dynamic behavior in response to external stimuli, we display simple time-resolved diagrams. We have included predictions for pT and pY sites and updated pS predictions. Access to prediction algorithm now allows ‘on-the-fly’ prediction of phosphorylation of any user-uploaded protein sequence. Protein Pfam domain structures are now mapped onto the protein sequence display next to experimental and predicted phosphorylation sites. Finally, we have implemented functional annotation of proteins using MAPMAN ontology. These new developments make the PhosPhAt resource a useful and powerful tool for the scientific community as a whole beyond the plant sciences.
INTRODUCTION
The medium- to large-scale study of protein phosphorylation by mass spectrometry in various organs from plants and under different conditions has in the past 2 years resulted in many publications and new datasets (1–6). Despite the multitude of new sites these studies that have identified, our fundamental understanding of the in vivo role of these phosphorylation sites is limited to only a few examples (7). More detailed studies have examined the roles of specific phosphorylation sites for the transport activities of aquaporins (8,9), the activity of the plasma membrane ATPase (10) and the regulation of specific metabolic enzymes by phosphorylation (11–13). Recently, an essential role of threonine phosphorylation was discovered for the function of plant ammonium transporters (14), and a novel role of tyrosine phosphorylation in BRI1 signaling has been discovered (15).
Unfortunately, the precise molecular function of the vast majority of identified phosphorylation sites still remain to be elucidated. To this end, it is extremely valuable to search and identify experimentally determined phosphorylation sites with regards to specific experimental conditions or tissue types. Ultimately, such resources would also provide quantitative information concerning changes in phosphorylation status and enable users to unravel the role of specific protein phosphorylation events.
Given the growing resource of mass spectrometric evidence of protein phosphorylation, the challenge for good data accessibility and storage of the information is of utmost importance. This is especially important when considering issues of false positive and false negative identification rates and data quality. Such issues can have major impacts on the design of biological experiments carried out to asses the function of targeted phosphorylation sites. In an attempt to address these types of issues, we developed an online database for plant protein phosphorylation. The PhosPhAt database was initially launched in 2007 and brought together published information on experimentally determined phosphorylation sites in Arabidopsis. While the initial focus of this resource was to catalog phosphorylation sites, it also provided a searchable interface that could be used as a source of information for bioinformatics analyses. Furthermore, these data were also used to develop a serine phosphorylation prediction algorithm, which was also made available through PhosPhAt (16).
In the past 2 years, we have re-designed the user interface while the content of the database has been increased by approximately 10-fold. New features concerning visualization of phosphorylation sites in the context of the whole protein, an update of the plant-specific phosphorylation site predictor, display of quantitative phosphorylation information, motif-based search functions and better export functions have been added to make the PhosPhAt resource even more useful for the community of scientists interested in regulation and signaling.
NEW AND IMPROVED FEATURES OF THE DATABASE
Database interface and availability
The user interface framework of the PhosPhAt database is now based on ExtJS, while the database itself remains an SQL database hosted by a linux-based operating system. PhosPhAt 3.0 is freely accessible through the internet via http://phosphat.mpimp-golm.mpg.de using any modern web browser. Direct links to specific protein entries can be established through http://phosphat.mpimp-golm.mpg.de/phosphat.html?code=AtXGXXXXX, where AtXGXXXXX is the Arabidopsis gene identifier of the protein.
Extension of the phosphorylation site datasets
The most important addition as the basis for all other new features is the major expansion of the datasets hosted in PhosPhAt. Two recent large-scale studies of Arabidopsis phosphorylation sites each containing over 1000 individual sites (4,5) and four medium-scale analysis (1–3,6) have been added to the database. With that the database content was increased by about 10-fold compared with the first version of PhosPhAt (16).
The updated PhosPhAt database (version 3.0) now contains 10 268 unique phosphopeptides, mapping to 12 457 individual phosphorylation sites in 5170 proteins. Unambiguously defined sites are distributed to STY residues as follows: 6659 serine, 1818 threonine and 676 tyrosine phosphorylation sites.
New web functionalities for database querying
The major difference to the first release of PhosPhAt for the user is in the separation of introductory page and the application page. The launch screen outlines necessary browser parameters and provides the hyperlink that launches the PhosPhAt web application in a new browser window. The ‘Home’ tab of the PhosPhAt launch screen gives the current version, background information and database statistics. After launching the PhosPhAt application, the user can undertake simple and advanced queries of the database by either providing a list of gene accession codes or by selecting combinations of specific parameters such as experimental treatment, tissue type, enrichment method or published resource. The user can also use the phosphorylation site predictor by either entering Arabidopsis gene identifiers to access precomputed values or by entering a novel amino acid sequence.
Each of the database query results or each of the prediction results is displayed in a separate tab. Individual queries remain present until they are selectively closed by the user or until the PhosPhAt session is ended. The query results are first summarized on a ‘results’ page on which the user can apply custom grouping and sorting functions by various parameters associated with proteins and peptides. Parameters include physical properties such as charge state, or number of phosphorylation sites, as well as experimental parameters such as biological treatment or phosphopeptide-enrichment method. A new feature implemented is the annotation of each protein based on its biological function as classified by MAPMAN (17). This parameter can also be used for sorting or grouping results. Icons indicate whether a spectrum is available for each peptide sequence entry, and another icon indicates available quantitative information. On the results page, additional meta-information for each peptide can be displayed by clicking on the small arrow at each column heading and by then selecting additional column parameters (treatment, tissue, PubMed ID, instrument, etc.) from the list.
Access to a protein detail page is achieved by right clicking the protein name and selecting ‘protein prediction’. The prediction results as well as all experimentally identified peptides for that given protein are summarized on a new tab. Again, the user can apply specific sorting and grouping functions based on experimental conditions, publication or enrichment method. The protein summary page now provides dynamic links to further external resources, such as Aramemnon (18), eFP browser (19), co-expression networks ATTED-II (20), subcellular localization (21) and other more general protein information at the GABI Primary Database (22).
Double clicking the peptide sequence in either the protein prediction page or on the query result summary will lead to the peptide summary page where the experimental details of the peptide are displayed. These include the annotated mass spectrum (where available), as well as physical properties such as charge state, mass and modifications. Experimental details such as enrichment method, biological treatment or tissue are also listed.
New data export features
Peptides from each query result can now be exported in a format suitable for the submission to motif-x analysis (23). At the level of the query result summary, the user has the choice of hand-selecting peptides or of selecting all unique peptide sequences present in the query result. The output format is as 13-mers centered on the phosphorylated residue. Only clearly assigned phosphorylation sites (i.e. those annotated as pS, pT and pY) will be included. For multiply phosphorylated peptides, each phosphorylation site will result in export of a separate 13-mer sequence. It is also now possible to export PhosPhAt query results in a spreadsheet format. The spectra of individual phosphopeptides can also be exported as an image or in the mgf data format.
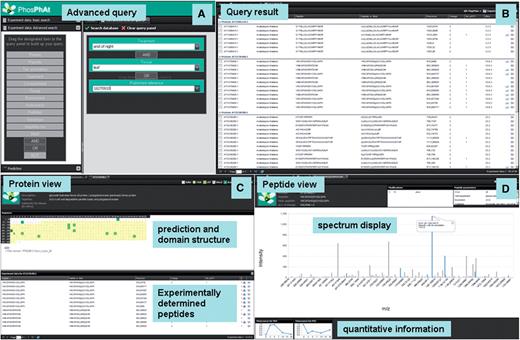
Screenshots of new PhosPhAt web interface. (A) Entry screen with advanced search, (B) result window, (C) peptide summary and (D) protein summary.
Extension of the plant-specific prediction of threonine and tyrosine
Given the growing number of experimentally determined phosphorylation sites, the plant-specific predictor for serine phosphorylation has also been updated and new prediction algorithms for threonine and tyrosine phosphorylation have now been implemented in addition to serine phosphorylation. For prediction of threonine and tyrosine phosphorylation sites, 1818 experimental sites for threonine and 676 experimental sites for tyrosine were used (Supplementary Data). Instead of only providing pre-computed phosphorylation site predictions for Arabidopsis proteins, it is now possible to paste any given protein sequence into the prediction query window and obtain prediction results. The latter function allows the predictors to be used independent of the plant species. In the original version, only Arabidopsis sites had been pre-computed. Thus, this presents a novel service for prediction of plant-specific phosphorylation sites.
Visualization of site-specific phosphorylation dynamics
Where available, we have collected data from time-course studies of relative abundance of phosphorylation at specific sites (10,24). This information is displayed on the peptide summary page as simplified trend graphs. As quantitative datasets will expand in future, the display of the results can help to assign biological functions to specific phosphorylation sites through their involvement in particular biological processes or stress responses.
Extension of protein-context information
As a new feature, we have annotated each protein based on its biological function as classified by MAPMAN (17) and provide related mapping to existing pathways. Moreover, predicted Pfam domain structures are mapped onto the protein sequence display allowing the user to visually inspect the localization of experimental and predicted phosphorylation sites to known domains as displayed in the phosphorylation site prediction summary. This information can be valuable in assessing the quality of predicted and experimentally determined phosphorylation sites as certain domains are unlikely to contain phosphorylation sites. Thus, besides prediction score and the experimentally determined phosphorylation site assignment score [PTM score (25) and PhosCalc score (26)], the likelihood of presence of a phosphorylation site in the protein sequence can be judged by the user.
In addition to the experimentally determined and predicted phosphorylation sites of a given protein on the protein summary page, information is also provided about any putative phosphorylating kinase based on published data from the recent protein microarray-based kinase assays (27,28). This information is being dynamically drawn from GabiPD (22). Such information will help users to establish links between specific phosphorylation sites or kinase substrates and phosphorylating kinases. Peptides containing specific kinase target motifs can be extracted from the experimental datasets using the motif search function. The motif search function identifies known kinase recognition motifs (e.g. a casein kinase motif around the experimentally determined phosphorylation sites) and displays all experimentally identified peptides containing the desired motif. Users can also enter motifs of interest by typing in the motif in single amino acid letter code and putting alternative amino acids in brackets. The X serves as a wild card for any amino acid. For example, [KRH]X[KRH]XXS will retrieve the SNF1-like kinase recognition sites in front of a phosphoserine.
Subcellular localization
While much of the data in PhosPhAt represents phosphoproteomic surveys from whole tissues or cells, it is possible to profile these data utilizing subcellular localization information available for Arabidopsis proteins. The SUBA database contains experimentally derived subcellular locations for over 8000 Arabidopsis proteins comprising proteomic studies, fluorescent proteins, ontology data and descriptor information (16). This localization information was used to profile experimentally determined phosphorylated proteins in the PhoPhAt database. A ‘winner takes all’ approach was used to determine a single (or multiple) subcellular location for each protein, i.e. an unweighted count of each experimental location in SUBA was calculated, with the highest score deemed the winner. Over 40% (2051) of the phosphorylated proteins in PhosPhAt had some information regarding their subcellular localization in Arabidopsis (Table 1). A comparison of localization rates of the 12 subcellular locations annotated in the SUBA database for phosphorylated proteins indicates that a higher proportion seem to be localized to the plasma membrane (∼2-fold higher) and cytoskeleton (∼1.5-fold higher). While the increased number of phosphoproteins localized to the plasma membrane may be explained by the number of targeted phosphoproteomic analyses of this structure (10,24,29,30), it also represents one of the main control points within the plant cell where phosphorylation cascades are initiated and thus may be an overrepresented location within the plant cell for phosphorylation. The cytoskeleton is also known to be heavily regulated by phosphorylation especially during cell division (31). Subcellular locations with some under-representation of protein phosphorylation include the extracellular space, the Golgi, the mitochondrion and to a lesser extent the nucleus. It seems probable that little protein phosphorylation would occur to secreted proteins (extracellular) while little is currently known concerning the role of phosphorylation in plant Golgi. Interestingly, a recent survey of phosphorylation in Arabidopsis mitochondria identified very few mitochondrial phosphoproteins confirming the findings of under-representation in this organelle (32). As further subcellular structures are targeted and characterized using phosphoproteomic techniques, it will be interesting to observe if the above proportions are sustained, especially with regard to the plasma membrane as a major site of phosphorylation within the plant cell.
Sub-cellular location of experimentally determined phosphoproteins in the PhosPhAt database
| Subcellular location | Total SUBA | Total SUBA (%) | PhosPhAt experiment | PhosPhAt experiment (%) | Fold difference |
| Cell plate | 20 | 0.2 | 6 | 0.2 | 1.2 |
| Cytoskeleton | 78 | 0.8 | 28 | 1.2 | 1.4 |
| Cytosol | 515 | 5.4 | 114 | 4.7 | 0.9 |
| Endoplasmic reticulum | 479 | 5.0 | 112 | 4.6 | 0.9 |
| Extracellular | 565 | 5.9 | 65 | 2.7 | 0.5 |
| Golgi | 183 | 1.9 | 28 | 1.2 | 0.6 |
| Mitochondrion | 883 | 9.2 | 132 | 5.5 | 0.6 |
| Nucleus | 2363 | 24.6 | 433 | 17.9 | 0.7 |
| Peroxisome | 238 | 2.5 | 56 | 2.3 | 0.9 |
| Plasma membrane | 1759 | 18.3 | 823 | 34.1 | 1.9 |
| Plastid | 1894 | 19.7 | 441 | 18.3 | 0.9 |
| Vacuole | 622 | 6.5 | 175 | 7.3 | 1.1 |
CONFIDENCE OF EXPERIMENTALLY DETERMINED PHOSPHORYLATION SITES AND FALSE POSITIVES
With increasing numbers of phosphorylation sites being identified by various experimental groups, the question about confidence of the phosphorylation site identification as well as the false positive rate is frequently raised. Although the extent of false positive rate for phosphopeptides and phosphorylation sites is not known and their experimental confirmation is not easily assessed at present, a confidence measure may be generated by statistical analysis of the overlap of phosphorylation sites between two independent datasets. Furthermore, predictor-based strategies supporting the identification of false positives are conceivable. A newly identified phosphorylation site might be further supported by assignment of the confidence value derived from an accurate prediction approach.
In this study, we evaluated the overlap of experimental reports of phosphorylation sites. Figure 2 shows the current state of the overlap in PhosPhAt. Phosphoproteins and phosphorylation sites were found concordantly in up to 11 independent high-throughput experiments, as judged by independent PubMed references. From a total number of 5170 phosphoproteins in PhosPhAt and 9153 clearly assigned phosphorylation sites, 25.9% of proteins and 17.0% of sites could be confirmed by at least two independent experiments.
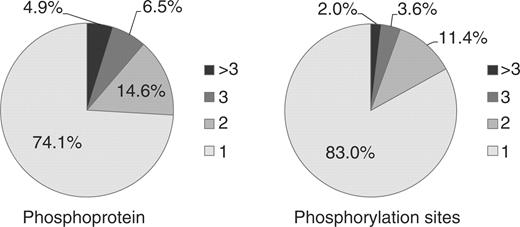
Percentage of phosphoproteins and phosphorylation sites from PhosPhAt corresponding to the number of independent experimental set-ups. Numbers are based on independent Medline entries.
Since strategies for false positive identification based on prediction are not yet possible, as a set of experimental false positives is not available, we confined this issue to a feasibility study, evaluating the correlation between the confidence values (decision values) derived from phosphorylation site prediction of an independent test set and the number of publication reports. For serine sites, a Pearson correlation coefficient of 0.36 (P-value 2e-187) was observed, for threonine sites of 0.17 (P-value 2e-15) and for tyrosine sites of 0.24 (P-value 4e-11).
Furthermore, the performance of a predictor, as judged by the area under the ROC curve (AUC), which corresponds to different evidence levels, was analyzed. For that purpose, the AUC was computed for different independent test sets, i.e. sets consisting of phosphorylation sites that had not been used in the training of the predictor (Supplementary Data). These test sets are varying by the number of experimental reports that support the sites in each set. We used a twice as large negative set, consisting of sites not found in any experiment. This ratio of the utilized positive and negative set was chosen to reflect training conditions of the predictor as well as the comparability of the AUC for different experimental evidence levels. The AUC was computed for the different test sets and plotted against the number of supporting experimental reports for the analyzed sets (Figure 3). We observed an improved performance of the predictor with increasing number of supporting experimental reports. The AUC for the serine-specific predictor increased from 0.69 ± 0.01 to 0.94 ± 0.01, for threonine sites from 0.62 ± 0.01 to 0.72 ± 0.04 and for tyrosine sites 0.66 ± 0.02 to 0.86 ± 0.03, revealing a positive correlation between the number of concordant identifications of phosphorylation sites and accuracies of their prediction. Thus, already an independent identification of phosphorylation sites in two independent experiments increases confidence in that site by almost 20%.
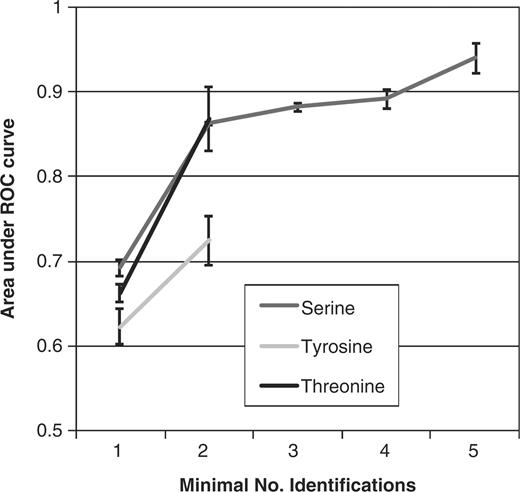
Values of the AUC for prediction of phosphorylation sites based on an independent test set, which are varying by the minimal number of supporting experimental reports (identification). The AUC is plotted against the number of identifications.
Although the confirmation of phosphoproteins and phosphorylation sites from independent studies is a good approach for true positive identifications, the absence of overlap is not immediately an indication of falsely detected phosphorylation events. It is obvious that non-overlapping phosphoproteins and phosphorylation sites could appear in different environmental as well as experimental conditions. Considering the possible differences, the high overlap rates indicate highly reliable data. Although the evaluation of overlap provides a confidence of experimental results, the estimation of false positive rates in numbers is not possible. On the contrary, predictor-based strategies might support the identification of false positives assigning a confidence value to newly identified phosphorylation sites. Such strategies require high prediction accuracies, which might presently not yet be sufficient. However, we observed evidence in support of such a strategy in that we observed a significant correlation between the decision value of S, T and Y phosphorylation site prediction and the number of publication reports. Thus, we believe that further confidence on experimental data might indeed be provided by integration with prediction results.
CONCLUSIONS
In conclusion, we believe that the PhosPhAt database has within the last 2 years been significantly improved, and its web service extended and is now recognized beyond the plant research community as a basis for future developments and research around phosphorylation sites and their biological functions.
SUPPLEMENTARY DATA
Supplementary Data are available at NAR Online.
ACKNOWLEDGEMENTS
We thank Dr Joachim Selbig and Dr Dirk Walther for helpful discussion and input during the development of new functionalities. Dr Björn Usadel was of great help in implementation of the MAPMAN ontology.
FUNDING
Financial support by the Bundesministerium für Bildung und Forschung (BMBF) (GABI-FUTURE Grants 0315046 and 0315049A to B.K. and A.N.). Funding for open access charge: Max Planck Society, Germany.
Conflict of interest statement. None declared.
REFERENCES
Author notes
Present address: Pawel Durek, Institute of Pathology, Universitätsmedizin Charite, Chariteplatz 1, D-10117 Berlin, Germany.

Comments