


ABSTRACT
The Patrocles database (http://www.patrocles.org/) compiles DNA sequence polymorphisms (DSPs) that are predicted to perturb miRNA-mediated gene regulation. Distinctive features include: (i) the coverage of seven vertebrate species in its present release, aiming for more when information becomes available, (ii) the coverage of the three compartments involved in the silencing process (i.e. targets, miRNA precursors and silencing machinery), (iii) contextual information that enables users to prioritize candidate ‘Patrocles DSPs’, including graphical information on miRNA-target coexpression and eQTL effect of genotype on target expression levels, (iv) the inclusion of Copy Number Variants and eQTL information that affect miRNA precursors as well as genes encoding components of the silencing machinery and (v) a tool (Patrocles finder) that allows the user to determine whether her favorite DSP may perturb miRNA-mediated gene regulation of custom target sequences. To support the biological relevance of Patrocles' content, we searched for signatures of selection acting on ‘Patrocles single nucleotide polymorphisms (pSNPs)’ in human and mice. As expected, we found a strong signature of purifying selection against not only SNPs that destroy conserved target sites but also against SNPs that create novel, illegitimate target sites, which is reminiscent of the Texel mutation in sheep.
INTRODUCTION
The expression level of at least one-third of mammalian genes is fine-tuned by one or more of a total set of ∼1000 miRNAs. This posttranscriptional regulation requires a functional silencing pathway with many components involved in nuclear and cytoplasmic miRNA processing, loading of the miRNP, recognition of the target and actual silencing. The corresponding sequence space, i.e. target sites, miRNA precursors and silencing machinery, is bound to suffer its toll of DNA sequence polymorphisms (DSPs) of which some will be functional and possibly affect phenotype. That this is indeed the case that has been demonstrated by (i) the identification of a mutation in the 3′-UTR of the ovine MSTN gene that causes increased muscle mass by creating an illegitimate target site for coexpressed miR-1 and miR-206 (1), and the report of >10 associations of polymorphisms in miRNA target sites (poly-miRTS) with human disease [reviewed in (2)], (ii) the identification of mutations in the seed region of human miR-96 responsible for nonsyndromic progressive hearing loss (3,4) and (iii) the identification of DICER1 mutations in familial pleuropulmonary blastoma (5). To assist in the identification of DSPs that affect miRNA-mediated regulation, we have searched the public domain databases for single nucleotide polymorphisms (SNPs) and other polymorphisms in the three sequence compartments involved in miRNA control (targets, miRNA precursors and silencing machinery). The outcome of this search is browsable via the Patrocles website (http://www.patrocles.org/).
METHODS
Patrocles contents
Patrocles is built using data from public databases and from the primary literature (i.e. Supplementary Data). The lingua franca used to merge all sources of genomic data is Ensembl annotations (6). This means that any gene/probe identifier or genome coordinate is mapped to one or more Ensembl genes (using cross-reference tables) prior to further processing. For miRNA catalogs, Patrocles relies on miRBase (7), which implies ignoring genuine homologs not yet annotated in miRBase. To maximize consistency, Patrocles performs all its mapping tasks internally. Thus, only miRNA names, coordinates and sequences (both precursors and matures) are fetched from miRBase, whereas other annotations (e.g. host genes) are computed on the fly. Our software architecture ensures that all input is mapped and all output is built using the same versions of Ensembl and miRBase throughout a given Patrocles release. However, in ancestrality and conservation assessments, some species may be represented by an older genome build than the one normally used in the corresponding Ensembl release. This is due to the Galaxy server (8) offering uneven access to the various genome-wide multiple species alignments stored in the University of California Santa Cruz (UCSC) genome database (9).
Patrocles has three species-templated pipelines written as a mixture of Perl and SQL queries. Each pipeline handles one of the sequence compartments involved in miRNA control, i.e. polymorphic targets, polymorphic miRNA precursors and polymorphic silencing machinery. As the target pipeline is relatively complex, a flowchart of its major steps is provided in Supplementary Data. The two other pipelines start from miRNA precursors available in miRBase and from silencing machinery components manually selected among Ensembl genes, respectively. In both cases, DSPs are processed as for targets, except that neither ancestrality nor conservation is assessed. Using genomic intervals, miRNA precursors and machinery genes are tested for their inclusion in Copy Number Variants (CNVs) [human (Database of Genomic Variants) (10), mouse (11), rat (12)]. Similarly, machinery and protein genes hosting miRNA precursors are searched for identity with known human eQTL (13,14,15–19) or with genes subject to allelic imbalance (20,21). miRNA secondary structures are first computed with RNAfold (22), then constrained to textual stem-loops by ‘unrolling’ additional arm loops. Unrolled regions (if any) are shown in lowercase in the output.
Patrocles website
The Patrocles website is written in PHP and based on denormalized SQL tables for fast access. Though Patrocles finder relies on the same species-specific octamer lists as the static version, its algorithms are slightly cruder and directly implemented in PHP. This is likely to change in the future. Patrocles builds upon Ensembl 49 and miRBase 11.
Expression plots
Patrocles plots were generated with gnuplot (http://www.gnuplot.info/) and ImageMagick (http://www.imagemagick.org/). Coexpression plots comparing the expression of a given miRNA with its target gene were computed for all miRNA–target pairs affected by at least one Patrocles DSPs (pDSPs). For target gene expression, MAS5-condensed fluorescence intensities from SymAtlas (23) were reduced to one replicate-averaged value per tissue and per Ensembl gene. When several probes were available for a single gene, we selected the probe yielding the highest replicate-averaged expression summed across tissues. For miRNAs, we used either mature counts directly extracted from Landgraf et al.'s (24) atlas of miRNA expression or the expression level of the host gene (if any) as computed from SymAtlas. Since expression data for target and host genes derive both from SymAtlas, establishing tissular correspondence was straightforward, comprising only one-to-one relationships. However, as miRNA read counts were obtained from a distinct set of libraries, matching was slightly more complicated, including one-to-many, many-to-one or many-to-many miRNA–target links depending on mapping onto larger systems (e.g. central nervous system, hematopoietic system). In the latter case, a summary score corresponding to the mean of the ‘many’ was generated as well. Counts were affiliated to miRBase precursors based on mature sequences (allowing 3p extensions) and only matures reaching either ≥10 copies or ≥1% in a single library were considered. For all libraries, Supplementary Data lists abbreviations and colors used in plots, along with mapping to tissues and larger systems.
eQTL plots relating target gene expression in lymphoblastoid cell lines to individual genotypes were computed for all pSNPs found in HapMap (25). pSNPs affecting several octamers have >1 eQTL plot. Normalized expression data were taken from Stranger et al. (14). Multiple probes per Ensembl gene were allowed but only probes for which at least one individual had an expression ≥8.0 were considered. In eQTL plots, the genotype leading to the functional octamer (either destroyed or created) is always shown on the left, while the ancestral genotype is denoted by a star. Mean expressions broken by genotype and HapMap population are shown as black dots with error bars for standard error.
RESULTS
Polymorphic targets
To identify DSPs in protein-coding genes that might influence miRNA-mediated regulation we downloaded aligned 3′-UTR sequences from the UCSC genome browser (9) using Ensembl annotation (6) for gene structures. DSPs mapping to the corresponding genome coordinates were then retrieved from Ensembl. Table 1 and Supplementary Data show the number of genes with 3′-UTR sequences and corresponding DSPs obtained for the species studied so far: human, mouse, chimpanzee, rat, dog, cow and chicken. Ancestral and derived DSP alleles were determined from the alignment with the orthologous sequence of sister species when available (human ↔ chimpanzee; mouse ↔ rat). When no sibling sequence was available, an allele was considered ancestral if shared by at least one primate, one rodent and one nonprimate/nonrodent mammal. Table 1 and Supplementary Data report the percentage of DSPs for which the ancestral allele could be determined. Human DSPs reported in the 1000 genomes project (26) were labelled as validated.
Patrocles DSPs in target genes for human and mouse
| Human | Mouse | |||
| 3′-UTRs | ||||
| No. of genes | 24 319 | 21 911 | ||
| Sequence space | 26 261 732 | 21 634 548 | ||
| DSPs in 3′-UTRs | ||||
| Total | 136 159 | 126 589 | ||
| Known ancestral allele | 114 305 (83.9%) | 111 178 (87.8%) | ||
| Validated | 56 807 (41.7%) | 62 150 (49.1%) | ||
| Target site motifs | ||||
| X-octamers | 540 | 540 | ||
| miRNAs | 676 | 484 | ||
| miRNAs∗ | 170 | 117 | ||
| L-octamers | 683 | 466 | ||
| X- OR L-octamers | 1164 | 948 | ||
| X- AND L-octamers | 59 | 58 | ||
| L-heptamers | 1265 | 882 | ||
| Target sites in 3′-UTRs | ||||
| X-targets | 323 833 | 267 644 | ||
| L-targets | 375 054 | 219 392 | ||
| X- OR L-targets | 661 187 | 455 620 | ||
| X- AND L-targets | 37 700 | 31 416 | ||
| Conserved X- AND L-targets | 10 425 (27.7%) | 9436 | ||
| Conserved X- NOT L-targets | 64 010 (22.4%) | 57 154 | ||
| Conserved L- NOT X-targets | 30 290 (9.0%) | 19 595 | ||
| Conserved 7-mer L-targetsa | 183 320 | 111 759 | ||
| Sequence space | 4 072 176 (15.5%) | 2 674 395 (12.4%) | ||
| DSPs affecting target sites | X | L | X | L |
| 3′-UTR pDSPs—total | 20 679 | 26 719 | 19 657 | 17 505 |
| 3′-UTR pDSPs—DC + CC | 1546 + 50 | 959 + 58 | 951 + 102 | 496 + 65 |
| 3′-UTR pDSPs—DNC | 7392 | 10 328 | 7732 | 7250 |
| 3′-UTR pDSPs—CNC | 9006 | 11 244 | 8545 | 7573 |
| 3′-UTR pDSPs—P | 1944 | 3295 | 2290 | 2065 |
| 3′-UTR pDSPs—S | 741 | 837 | 37 | 56 |
| 3′-UTR pDSPs—DC + CC (7-mers)a | – | 4310 | – | 2664 |
Only considering 7-mer L-targets not included in 8-mer X- or L-targets.
We defined two sets of miRNA target site motifs. The first (X-motifs) corresponds to 540 octamers identified by Xie et al. (27) on the basis of their unusually high motif conservation score in 3′-UTRs. The second corresponds to the 8-mer, 7-mer-A1 and 7-mer-m8 sites as defined by Lewis et al. (28) (L-motifs). ‘8-mer sites’ correspond to the Watson–Crick (WC) reverse complement of nucleotides 2–8 of known miRNAs followed by an ‘A anchor’ at its 3′-end, ‘7-mer-A1 sites’ to the WC reverse complement of nucleotides 2–7 of known miRNAs plus the ‘A anchor’ and ‘7-mer-m8 sites’ to the WC reverse complement of nucleotides 2–8. Species-specific sets of miRNAs were downloaded from miRBase (7). Both mature miRNAs and passenger miRNAs∗ were considered, as abundant miRNAs∗ may reach higher tissular concentrations than rare miRNAs [e.g. (24)]. Table 1 and Supplementary Data show the number of miRNAs (including 5p- and 3p-forms) and miRNAs∗ identified in the different species, as well as the corresponding numbers of L-8- and L-7-mers.
In human, X- and L-8-mers jointly define 1164 unique octamers of which only 59 (5%) are common. Unexpectedly, it thus appears at first glance that X and L-targets explore very distinct sequence domains. To further characterize the concordance between the two sets, we examined the degree of overlap between 7- and 6-mers embedded within the human X- and L-octamers. The 540 X-8-mers encompass 577 7-mers and 554 6-mers. The corresponding figures for the 683 human L-8-mers are 1265 and 1448, respectively. One hundred and eight (16%) human L-8-mers share at least one 7-mer with 335 X-8-mers (62%), while 277 L-8-mers (40%) share at least one 6-mer with 491 X-8-mers (91%) (Figure 1). Assuming that 6-mer sharing indeed reflects functional overlap, ∼40% of the L-motifs thus capture most of the biology (91%) related to X-8-mers. At any rate, X-8-mers are also bound to include functional elements not related to miRNA-mediated regulation.

We then identified putative miRNA target sites in the selected 3′-UTR sequences, considering all matches to the defined X- and L-8-mers as well as matches to ‘conserved’ L-7-mers (A1 and m8). A conservation criterion was applied to L-7-mers to control the number of false positive predictions. Target sites were considered conserved if they were shared by at least one primate, one rodent and one nonprimate/nonrodent mammal. Table 1 and Supplementary Data report the number of X- and L-targets identified with this procedure in the different species.
In human, for instance, 28% of the target sites that match both an X- and an L-octamer are conserved, versus 22% for those that only match an X-octamer, and 9% for those that only match an L-octamer. Thus, considering that conservation is indicative of functionality, matching an X- and an L-motif increases the probability to be a true miRNA target site. The higher proportion of conserved X-matching target sites versus L-matching target sites is as expected given the strategy underlying X-motif identification (27). Amongst L-target, the proportion of conserved target sites is higher for octamer motifs corresponding to mature miRNAs than to passenger miRNAs∗ (Figure 2A and B).
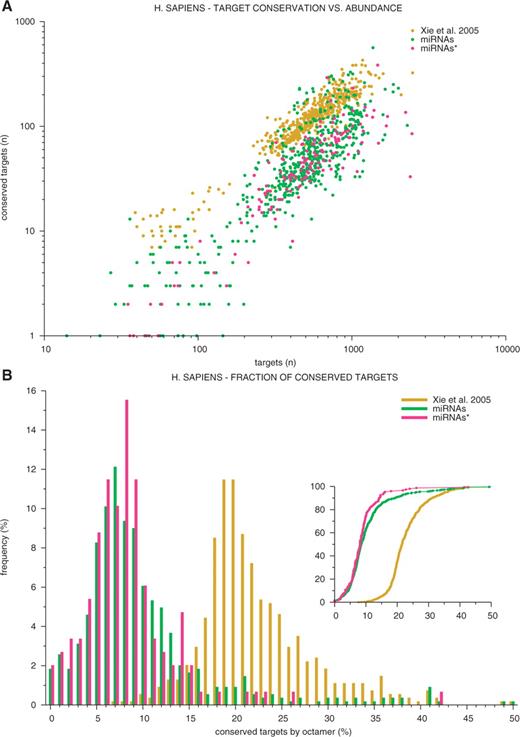
(A) Conserved versus total numbers of putative target sites in human 3′-UTRs for X-octamers (yellow), L-octamers corresponding to mature miRNAs (green) and L-octamers corresponding to passenger miRNAs∗ (red). (B) Frequency distribution of the proportion of conserved target sites in human 3′-UTRs for X-octamers (yellow), L-octamers corresponding to mature miRNAs (green) and L-octamers corresponding to passenger miRNAs∗ (red). Inset: corresponding cumulative frequency distributions.
We then searched for DSPs that were altering the X- or L-target site content of the 3′-UTRs. We refer to these DSPs as pDPSs. pDSP for which the ancestral allele is known can modify target site content in the following ways: (i) destruction of a conserved target site (DC), (ii) destruction of a nonconserved target site (DNC) and (iii) creation of a nonconserved target site (CNC). pDSPs for which the ancestral allele is unknown (the general situation in species other than primates and rodents) were assigned to a fourth category of polymorphic target sites (P). Finally, pDSPs shifting the position of a target site were assigned to a fifth class (S). Note that the same DSP may cause multiple such events by affecting several overlapping target site motifs. Table 1 and Supplementary Data show the number of events of each category observed for the two sets of target site motifs in the studied species. Figures for 8- and 7-mer L-targets are provided separately. It is worthwhile noting that, for 8-mer target sites, the number of target site destructions (DC+DNC) is virtually identical to the number of creations (CNC) for all species.
Exceptionally, we found primate (respectively rodent) pDSPs for which the derived allele corresponded to a target-site motif conserved across nonprimate (respectively nonrodent) mammals. In these cases, we assumed that it was more likely that the allele initially labelled as derived was in fact ancestral, and that the DSP actually appeared prior to the divergence of the two sibling species used to infer the ancestral state. Thus, these creations of a conserved site (CC) were parsimoniously added to the DC class, yet identified as such (the created target site is shown in the column corresponding to the derived allele). Occasionally, DSPs destroy a conserved or nonconserved 8-mer target site yet maintain a conserved 7-mer L-target site. Such events are identified using a weakening (W) label. Likewise, the CNC class include events converting a conserved 7-mer in an 8-mer target site. Such events are identified with a strengthening (S) label.
Taken together, our results indicate that there are thousands of common DSPs that alter the content of 3′-UTRs in putative miRNA target sites. This is not unexpected given the fact that >10% of the 3′-UTR sequence space is occupied by putative target sites (Table 1). What is the evidence that any of those are truly affecting gene function? We addressed this by looking for signatures of purifying selection on pSNPs in human and mice. To that end, we simulated sets of pSNPs matching the true human and mouse sets as follows. We first selected SNPs (i.e. excluding DSPs affecting >1 nucleotide residue and those corresponding to indels) in human (114 641 SNPs) and mice (125 693 SNPs). We then determined the ancestral allele or, when not possible, arbitrarily assigned ancestral status to the nucleotide in the reference sequence. Finally, we randomly shifted the position of the SNPs in the 3′-UTR space, yet respecting their trinucleotide context. For instance, a cAt (ancestral) → cGt (derived) transition was moved to a randomly selected cAt trinucleotide within the 3′-UTR space. Substitution rates are indeed known to depend on immediately surrounding nucleotides (29–31), while the trinucleotide composition of the miRNA target motifs differs from the general trinucleotide composition of 3′-UTRs (Supplementary Data). To see this, assume that CpG dinucleotides (known to be C→T mutational hot spots) are enriched in miRNA target sites, shifting the mutated T residues to any C in the 3′-UTRs would reduce the proportion of pSNPs in the simulated data sets. The number of DC, DNC and CNC events was then compiled for this in silico generated SNP set. This operation was repeated 100 times. The number of ‘Patrocles events’ obtained with the true set was then compared with the distribution of number of events across simulations. Functional sites under purifying selection are expected to be more often affected by in silico SNPs than by real SNPs. On the contrary, nonfunctional, neutral sites are expected to be more often affected by real than by in silico SNPs (Supplementary Data).
As expected, there is a strong signature of purifying selection against SNPs that destroy conserved target sites, whether X-targets, L-targets corresponding to mature miRNAs or L-targets corresponding to passenger miRNAs∗ (Figure 3 and Table 2). SNP avoidance is more pronounced in mice than in human, which could be due to a more effective selection against mildly deleterious mutations in the larger effective population of wild mice (prior to domestication) when compared with human, combined with a strong selection against deleterious recessive mutations as a result of inbreeding (after domestication). Purifying selection may have eliminated of the order of 22–35% of SNPs affecting conserved target sites in human versus 53–67% in mice. This observation corroborates the findings of Chen and Rajewsky (32) who noticed a depletion of SNPs in conserved miRNA target sites when compared to other conserved 3′-UTR sequences.
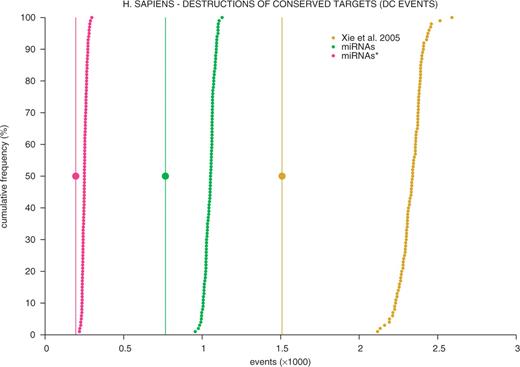
Large dots: number of destructions of X-8-mer targets (yellow), L-8-mer targets corresponding to mature miRNAs (green) or L-8-mer targets corresponding to passenger miRNAs∗ observed with the collection of real human SNPs. Small dots: cumulative frequency distribution of the corresponding number of DC events obtained with 100 matched collections of SNPs generated in silico as described in the text. Corresponding figures for DC, DNC and CNC events in human and mice are summarized in Table 2.
Signatures of purifying selection on pSNPs in human and mice
| DC | DNC | CNC | ||||||||
| X | L | L∗ | X | L | L∗ | X | L | L∗ | ||
| Human | 1509 | 766 | 195 | 7592 | 8160 | 2530 | 9202 | 9005 | 2618 | OBS |
| 0.647 | 0.730 | 0.775 | 0.968 | 0.968 | 1.009 | 0.916 | 0.953 | 0.987 | [OBS/SIM] | |
| −10.832 | −8.843 | −3.766 | −2.249 | −3.302 | 0.503 | −5.743 | −4.489 | −0.559 | [OBS-SIM]/SD_SIM | |
| Mouse | 951 | 410 | 94 | 8850 | 6604 | 1759 | 9598 | 6711 | 1933 | OBS |
| 0.324 | 0.390 | 0.467 | 0.987 | 0.997 | 1.070 | 0.890 | 0.959 | 1.014 | [OBS/SIM] | |
| −23.933 | −18.267 | −8.320 | −0.814 | −0.240 | 2.706 | −8.061 | −2.949 | 0.627 | [OBS-SIM]/SD_SIM | |
X, octamer motifs identified by Xie et al. (27); L, octamer motifs corresponding to 8-mer sites defined as in Lewis et al. (28) based on mature human miRNAs compiled in miRBase (7); L∗, octamer motifs corresponding to 8-mer sites defined as in Lewis et al. (28) based on passenger human miRNAs∗ compiled in miRBase (7); OBS, numbers of corresponding events observed with real SNPs in 3′-UTRs; [OBS/SIM], ratio of the number of events observed with real SNPs divided by the mean number of corresponding events observed with in silico generated SNPs; SD_SIM, standard deviation of the number of corresponding events observed across 100 sets of simulated SNPs.
Interestingly, we also obtained evidence of purifying selection against SNPs that create novel, illegitimate target sites in human and mice (Table 2). Such events are reminiscent of the Texel mutation in sheep (1). The effect was most pronounced for X-targets, but clearly noticeable for L-targets corresponding to mature miRNAs as well. The observed ratios between real and simulated events suggest that as much as 10% of illegitimate target sites might be functional. A more modest signal of purifying selection against SNPs destroying nonconserved target sites (X-target sites and L-target corresponding to mature miRNAs) was also observed in human but not in mice (Table 2).
pDSPs that are most likely to affect gene function include (i) those destroying conserved target sites (DC) and (ii) those creating illegitimate target sites (CNC) in ‘anti-target’ genes. pDSP causing DC events can be selected as such in the Patrocles database. As mentioned before, target sites are considered conserved only when shared by at least one primate, one rodent and one other mammal. As a matter of fact, the DNC set must include a number of DSPs destroying target sites whose function and hence conservation is restricted to specific lineages. The alignment of the 3′-UTRs across a larger number of mammalian species may identify such lineage-specific target sites.
‘Anti-targets’ are genes that are under selective pressure to avoid target sites (33,34). The G + 6723G-A mutation in the ovine MSTN 3′-UTR is a good example of a pSNP that creates an illegitimate target site in an miR-1/206 anti-target and hence an hypomorphic MSTN allele (1). To assist in the identification of other such pDSPs, we provide graphical information about the coexpression of the polymorphic target gene and the cognate miRNA (when known) across tissues. This is achieved in the form of 2D plots in which each point reports the expression level of the corresponding target–miRNA pair in a given tissue. For target genes, expression levels correspond to fluorescence intensities obtained from SymAtlas (23), while for the miRNAs, expression levels correspond either (i) to the number of sequence reads as reported by Landgraf et al. (24) and/or (ii) to the expression level of the host gene in SymAtlas. Indeed, several reports indicate that the expression levels of host genes and intronic miRNAs expressed from the same strand are, in general, positively correlated [e.g. (35–38)]. It is noteworthy that an estimated ∼1/3 of intronic miRNAs are predicted to be under control of an independent promoter (39). For those, host gene expression level may not be an appropriate surrogate of miRNA expression level.
Figure 4 shows an example of a coexpression plot based on the number of sequence reads for a murine pSNP recently shown to affect the binding of miR-133a to a collagen precursor (Col4a3) (40). At present, coexpression plots are available in Patrocles for human and mice.
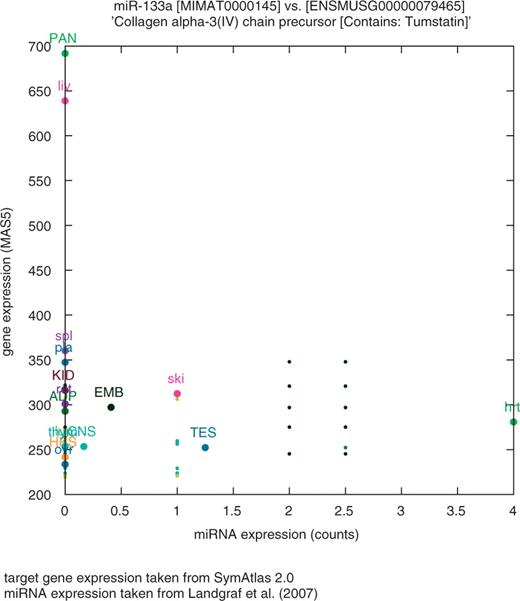
Example of coexpression plot for a miRNA–target pair in mice. Relative expression levels of mir-133a (based on the number of sequence reads reported in Landgraf et al. (24) versus Col4a3 (collagen alpha-3(IV) chain precursor) (based on SymAtlas). The graph shows (i) that mir-133a is muscle specific (hrt) and (ii) that Col4a3 mRNA levels in the heart are lower than in most other tissues. Interestingly, the murine Col4a3 3′-UTR encompasses an experimentally confirmed mir-133a target site corresponding to the ancestral allele (T), this allele being present in all sequenced mice lines (30) except in m.m. Castaneus, which harbours the derived allele (C) (rs30240795). By analyzing allelic imbalance in F1 mice heterozygous for this pSNP, Kim and Bartel (40) convincingly showed a higher mRNA steady state level for the derived allele (C) compared with the ancestral allele (T).
Assuming that a pDSP is truly functional, the steady state mRNA level of the targeted allele is predicted to be lower than that of the untargeted one in tissues where target and miRNA are coexpressed. Genome-wide expression data for cohorts of individuals genotyped for large numbers of SNPs are becoming available in human, albeit today only for lymphoblastoid cell lines. These are being used to examine associations between gene expression levels and SNP genotype across the genome, i.e. eQTL studies [e.g. (13,14)]. We have exploited the corresponding HapMap resource (25) to look for associations between pSNPs and the expression level of the corresponding gene (i.e. cis eQTL effects). Patrocles provides eQTL plots for pSNPs genotyped in the HapMap population. For a functional pSNP, the resulting cis eQTL effect is expected to be consistent across populations (Yerubans, Asians and Europeans). Figure 5 illustrates such a consistent eQTL effect associated with pSNP rs9874 causing the creation of a nonconserved target site for miR-181 in the selenoprotein S (SELS) gene, thereby supporting its functionality.
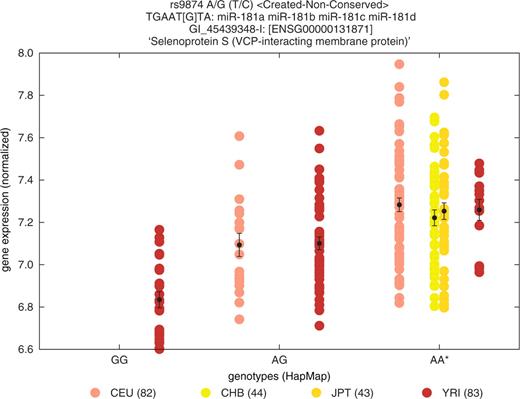
Comparison of the expression levels of SELS in lymphoblastoid cell lines of Yerubans (brown), Han Chinese (yellow), Japanese (orange) and Caucasians (pink), sorted by genotype for pSNP rs9874 predicted to create a nonconserved miR-181 target site. Homozygous genotypic class for the ancestral allele (AA) is marked by an asterisk. Error bars correspond to standard error.
The Patrocles database also lists reported associations between pDSPs and phenotypes. In addition to the Texel mutation in sheep (1), 13 associations between pDSPs and human phenotypes had been reported at the time of writing: (i) miR-189-SLITRK1 and Tourette's syndrome (41–46), (ii) miR-140-REEP1 and hereditary spastic paraplegia (47,48), (iii) miR-206-ERα and breast cancer (49), (iv) miR-155-AGTR1 and hypertension (50), (v) miR-24-DHFR and drug resistance (51) (note that the corresponding rs34764978 SNP lies outside of the target site, yet seems to have a strong effect on miR-24 dependent regulation), (vi) miR148a-HLA-G and childhood asthma (52), (vii) miR-96-HTR1B and aggressive behaviour (53), (viii) five miRNAs-CD86 and colorectal cancer (54), (ix) miR-433-FGF20 and Parkinson disease (55), (x) miR-510-HTR3E and irritable bowel syndrome (56), (xi) let-7-KRAS and nonsmall cell lung cancer (57), (xii) miR-34a-ITGB4 and breast cancer (58) and (xiii) miR-657-IGF2R and Type II diabetes (59). It was recently commented by Sethupathy and Collins (2) that the evidence supporting the majority of associations reported in human should be considered tentative, requiring further confirmation as well as functional and mechanistic support. The Patrocles interface invites the community to assist in updating the list of published associations between pDSPs and phenotypes.
The ‘Polymorphic target’ section of the Patrocles database allows interrogation for pDSPs including filtering by species (presently human, chimpanzee, mouse, rat, dog, cow and chicken), by type of target site (X- and/or L-targets, miRNA identifier or octamer motif), by target gene (gene identifier or chromosomal interval) and by DSP category (effect on target site content, DSP validation status, DSP identifier). The output can be visualized on screen or downloaded as a text file.
Polymorphic miRNAs
To identify DSPs that might affect either the biogenesis or the sequence of miRNAs, we downloaded sequences annotated as pre-miRNAs from miRBase. We then downloaded from Ensembl all DSPs mapping to the corresponding genome coordinates. Table 3 and Supplementary Data summarize the number of pre-miRNAs available in the species analyzed to date, as well as the number of DSPs in them. DSPs are sorted depending on whether they affect the seed sequence (residues 2–8), the mature miRNA outside the seed or other parts of the pre-miRNA. In human for instance, we identified 184 DSPs affecting 136 out of 676 pre-miRNAs. Twelve of these mapped to the miRNA seed and 26 to the mature miRNA outside the seed. It is noteworthy that the 12 human miRNAs with a DSP in their seed sequence are either members of a seed-sharing miRNA family or more recently discovered miRNAs that are likely to be expressed at lower levels [e.g. (60)]. The effect of the DSPs on pre-miRNA structure was evaluated using RNAfold (22) and the predicted secondary structures are viewable in Patrocles. Patrocles includes the DSPs in pre-miRNAs that were previously identified by Iwai and Naraba (61) as well as by Chen and Rajewsky (60).
Patrocles DSPs in miRNA precursors for human and mouse
| Human | Mouse | |
| No. of pre-miRNAs | 676 | 466 |
| DSPs in pre-miRNAs | ||
| No. of affected miRNAs | 136 | 71 |
| Total | 184 | 89 |
| Seed | 12 | 4 |
| Mature non-seed | 26 | 6 |
| Other | 146 | 79 |
| miRNAs in CNVs | ||
| No. of CNVs | 158 | 0 |
| No. of affected miRNAs | 256 | 0 |
| miRNAs hosted in eQTL genes | ||
| No. of eQTL | 78 | ND |
| No. of affected miRNAs | 85 | ND |
ND, non-determined.
For human (10), mouse (11) and rat (12), Patrocles also lists CNVs [e.g. (62,63)] encompassing known miRNAs (Table 3 and Supplementary Data). These dosage differences may cause differences in miRNA concentration and hence influence miRNA-mediated gene regulation. In human, 158 reported CNVs jointly encompass 256 miRNA genes. The corresponding figures may have to be reevaluated in light of recently redefined CNV boundaries (64).
Finally, Patrocles lists host genes with evidence for inherited variation in expression level obtained either from eQTL experiments (13–19) or from genome-wide scans for allelic imbalance (20,21). Inherited variations in host gene expression levels, whether caused by sequence variants in cis- or trans-acting regulators, may affect the concentration of embedded miRNAs, and hence influence miRNA-mediated gene regulation. This information is presently only compiled for human, for which we found 78 eQTL potentially affecting the expression level of 85 miRNAs (Table 3).
Reports of DSPs in miRNAs that have been associated with altered miRNA expression or with a phenotype are listed as such in Patrocles as well. At the time of writing, this includes DSPs modulating miRNA expression level (65) or processing (66), as well as DSPs in miRNAs associated with different cancers (67–74) or with schizophrenia (75). As in the previous section, Patrocles invites the community to contribute in updating the list of published associations between miRNA polymorphisms and phenotypes.
The ‘Polymorphic miRNA’ tables of the Patrocles database can be queried using a variety of filters including species, miRNA (identifier and map position), type of variation (DSP, CNV or eQTL), DSP category (position with respect to miRNA structure, DSP validation status, DSP identifier), CNV identifier and host gene affected by a reported eQTL.
Polymorphic silencing machinery
DSPs in core components of the silencing machinery may affect the efficacy of specific steps in the silencing process. Not all biochemical pathways will be equally sensitive to such perturbations. DSPs affecting the silencing machinery may thus contribute to the genetic variation observed for specific phenotypes.
To aid in the identification of such variants, we established a manually curated list of gene products (Supplementary Data) participating in the silencing process. We then searched for (i) DSPs altering the corresponding coding sequences, (ii) CNVs encompassing the corresponding genes and (iii) evidence for eQTL or allelic imbalance for the corresponding genes. In human for instance, we observed 237 DSPs in 49 genes, 17 CNVs affecting 17 genes and 21 genes with evidence for variation in expression level. Table 4 and Supplementary Data reports the corresponding numbers for the other species.
Patrocles DSPs in components of the silencing machinery for human and mouse
| Human | Mouse | |
| No. of genes | 52 | 51 |
| DSPs in machinery genes | ||
| No. of affected genes | 49 | 35 |
| Total | 237 | 127 |
| Non-synonymous | 151 | 73 |
| Stops/frameshifts | 45 | 2 |
| Splicing sites | 42 | 52 |
| Machinery genes in CNVs | ||
| No. of CNVs | 17 | 0 |
| No. of affected genes | 17 | 0 |
| Machinery genes identified as eQTL | ||
| No. of eQTL/affected genes | 21 | ND |
ND, non-determined.
All these events are listed in the Patrocles database which can be interrogated by species, gene identifier, DSP identifier and chromosomal location.
Patrocles finder
Resequencing efforts will reveal novel, undocumented DSPs in candidate genes of interest. We have generated a tool (Patrocles finder) that allows convenient examination of the miRNA target site content of a sequence of interest and examination of the effect of DSPs in that sequence on target-site content. Target sites are defined as described above, i.e. either as one of the octamer motifs discovered by Xie et al. (27) or as species-specific 8- and 7-mer sites as defined by Lewis et al. (28). Patrocles finder analyzes both isolated sequences as well as alignments of orthologous sequences in FASTA format. When selecting the latter option, Patrocles finder provides direct information about the conservation or not of the identified miRNA target sites.
DISCUSSION
The Patrocles database aims at providing the community with a bioinformatic tool to assist in the identification of DSPs that may affect miRNA-mediated gene regulation and possibly phenotype. Patrocles may be particularly useful in the final stages of a positional cloning effort when a chromosomal region corresponding to a phenotype of interest has been identified either by linkage analysis or association studies.
At present, the majority of the information provided by Patrocles concerns DSPs in putative miRNA target sites. Patrocles reports tens of thousands of pDSPs for human alone.
Evidently, information provided by Patrocles should be considered with appropriate caution. It is worthwhile remembering in this regard that as much as 67% of coexpressed target genes predicted with the most effective packages on the basis of conserved target sites are likely to be false positives given the absence of a detectable response at the mRNA or protein level (76). This figure rises to >85% for target predictions based on nonconserved target sites, despite ample experimental evidence supporting the existence of functional yet nonconserved target sites [e.g. (33,76)]. Predictions are bound to be even less specific when ignoring coexpression information as most packages do.
While cautious interpretation is of the order, population genetic data strongly suggest that Patrocles and related databases contain biologically relevant information. Indeed, in addition to a strong signature of purifying selection against SNPs destroying conserved target sites, we present evidence for purifying selection against a significant proportion of SNPs creating nonconserved target sites in human and mice, and against SNPs destroying nonconserved target sites in human. One could rightfully argue that such signatures are indicative of past selection against SNPs that have since been eliminated from the population. That extant pSNPs affecting nonconserved target sites might affect gene function was supported by the finding of Chen and Rajewsky (32) of a shift towards lower frequencies of the derived allele for pSNPs altering nonconserved target sites for coexpressed miRNAs.
To assist in the prioritization of pDSPs, Patrocles provides convenient access to contextual information, including miRNA-target coexpression and eQTL data. Target site ‘context score’ as defined by Grimson et al. (77) could be considered in future versions of Patrocles to improve pDSP ranking.
The search for pDSPs has been restricted to 3′-UTRs despite accumulating evidence for functional miRNA target sites in coding segments as well [e.g. (76,78)]. However, as the specificity of target site predictions is considerably lower in open reading frames, including coding sequences (representing a much larger sequence space than 3′-UTRs) in our search would have greatly inflated the proportion of false positive pDSP predictions.
Bioinformatic evidence supporting polymorphic miRNA-mediated gene regulation should be testable experimentally. Most approaches described so far rely on the transfection of cultured cells with reporter vectors carrying alternate allelic forms of the predicted target sites in the 3′-UTR, as well as miRNA expression vectors. Whether differential regulation observed in such artificial conditions can be trusted as evidence for what happens in vivo is a matter of debate. To overcome these limitations, we have successfully developed an allelic imbalance test following coimminupreciptation of RNA-induced silencing complex-bound mRNAs from tissue samples of individuals heterozygous for the candidate pDSPs (H. Takeda et al., unpublished data). Combined with hybridization on genome-wide, high-density SNP arrays, this and related approaches such as high-throughput sequencing of RNAs isolated by cross-linking immunoprecipitation [e.g. (79)] could be used to systematically scan the genome for polymorphic miRNA-mediated gene regulation. Recently, Kim and Bartel (40) tested the effect of 67 pDSPs altering target sites for miR-1/206, miR-133 and miR-122 in the 3′-UTR of coexpressed genes using allelic imbalance sequencing. They estimated that ∼15% of their pDSPs were indeed functional, resulting in a ∼2-fold difference in expression level between the mRNA allelomorphs. Thus, between any pair of mouse strains, >100 genes might be differentially regulated as a result of pDSPs. These experimental data emphasize the importance of polymorphic miRNA-mediated gene regulation and the utility of the Patrocles database.
SUPPLEMENTARY DATA
Supplementary Data are available at NAR Online.
ACKNOWLEDGEMENTS
We are grateful to Xavier Tordoir for his help with early versions of Patrocles.
FUNDING
European Union's Framework 6 (Callimir STREP, Epigenome NoE, Eadgene NoE); Belgian Science Policy organisation (SSTC Genefunc, BioMAGNet PAI); Belgian Fonds National de la Recherche Scientifique; Communauté Française de Belgique (Game, BIOMOD ARC); University of Liège. C.C. is Chercheur Qualifié of the Fonds National de la Recherche Scientifique.
Conflict of interest statement. None declared.
REFERENCES

Comments