


ABSTRACT
The broad aim of biomedical science in the postgenomic era is to link genomic and phenotype information to allow deeper understanding of the processes leading from genomic changes to altered phenotype and disease. The EuroPhenome project (http://www.EuroPhenome.org) is a comprehensive resource for raw and annotated high-throughput phenotyping data arising from projects such as EUMODIC. EUMODIC is gathering data from the EMPReSSslim pipeline (http://www.empress.har.mrc.ac.uk/) which is performed on inbred mouse strains and knock-out lines arising from the EUCOMM project. The EuroPhenome interface allows the user to access the data via the phenotype or genotype. It also allows the user to access the data in a variety of ways, including graphical display, statistical analysis and access to the raw data via web services. The raw phenotyping data captured in EuroPhenome is annotated by an annotation pipeline which automatically identifies statistically different mutants from the appropriate baseline and assigns ontology terms for that specific test. Mutant phenotypes can be quickly identified using two EuroPhenome tools: PhenoMap, a graphical representation of statistically relevant phenotypes, and mining for a mutant using ontology terms. To assist with data definition and cross-database comparisons, phenotype data is annotated using combinations of terms from biological ontologies.
INTRODUCTION
The laboratory mouse is fundamental to the understanding of mammalian biology and the investigation of human disease (1,2). There is now a wealth of genotypic information available as a result of the sequencing the mouse genome, and a central challenge in the identification of mouse disease models is the attribution of function to individual genes. The classical genetics approach of relating genotype to phenotype—the introduction of mutations into the genome of an experimental organism and the identification of novel phenotypes—can be furthered on a high-throughput scale with the establishment of projects devoted to the manufacture of mouse gene knockout lines. The International Knockout Mouse Consortium (IKMC; http://www.knockoutmouse.org) (3) is made up of the four major projects: (i) EUCOMM (http://www.eucomm.org), (ii) KOMP (http://www.nih.gov/science/models/mouse/knockout/), (iii) TIGM (http://www.tigm.org) and (iv) NorCOMM (http://www.norcomm.org) and is in the process of generating mutations in ES cells for all known protein coding genes.
The European Mouse Disease Clinic programme (EUMODIC; http://www.eumodic.org) in collaboration with EUCOMM (4) is in the process of generating mouse mutant lines from ES cell resource and aims to provide a phenotype assessment of 500 mouse mutant lines. The Eumorphia programme (http://www.eumorphia.org) (5) was the predecessor to EUMODIC and generated baseline phenotype data for four inbred mouse lines besides developing the European Mouse Phenotyping Resource for Standardised Screens (EMPReSS) (6,7), which can be utilized for mouse phenotyping. The EuroPhenome Resource (http://www.EuroPhenome.org) originally contained and presented the baseline data derived during Eumorphia (8). Our previous article in NAR described this data and the web tools we had developed to analyse and display them. Since this initial effort, EuroPhenome has undergone significant development; most notable is that EuroPhenome now captures and annotates mutant mouse phenotyping data from EUMODIC, presenting putative phenovariants to users.
Three critical steps have been achieved within the EUMODIC programme, which allow the comprehensive analysis and interpretation of the generated phenotype data. First, the phenotype data is generated using community-agreed phenotyping platforms that provide standardized methods, so that the results can be compared between laboratories and over time. All of the phenotyping procedures executed during the EUMODIC screens are part of the publicly available EMPReSS resource (http://empress.har.mrc.ac.uk) and organized into two phenotyping pipelines, collectively termed EMPReSSslim (http://www.eumodic.org/EMPReSSslim.html). Second, the raw phenotype data, which is generated by the participating research institutions, is collected within EuroPhenome which serves as a community database with open access. And third, ontologies provide the structured description of the phenotypes within EuroPhenome to allow the data to be interpreted in a consistent manner.
DATA IN EUROPHENOME
EMPReSSslim consists of 20 phenotyping screens described by standard operating procedures (SOPs). These examine the broad biological domains of body morphology; metabolism, heart morphology and blood pressure, body fat and bone composition and skeletal morphology, behaviour and sensory testing, haematology; clinical chemistry, FACs analysis of leukocytes and immunoglobulin concentration. Data measured in each SOP are recorded as individual parameters. The parameters for each screen are given a unique identifier. These are listed in EMPReSS. The parameters are of two types: phenotype parameters and metadata parameters. The phenotype parameter defines a characteristic of the mouse which can be measured and so is analogous to a mouse trait. The data obtained for each phenotype parameter during the execution of the SOP is captured and analysed within EuroPhenome. Metadata parameters capture technical aspects of the SOP which could make an impact in the comparison of phenotype parameters between executions of the same SOP, for example equipment models and settings. Currently, 622 phenotype parameters are recorded in the EMPReSSslim screen. EuroPhenome contains data for 76 mutant mouse strains (in some cases representing alleles in both homozygous and heterozygous states), making a total of 2.1 million data points.
The mouse clinics (Institut Clinique de la Souris, France; Helmholtz Zentrum Munich, Germany; MRC Harwell; and Wellcome Trust Sanger Institute, UK) which are part of EUMODIC process mutant mouse lines through EMPReSSslim, capturing the phenotype data in their local Laboratory Information Management Systems (LIMS). The database architectures of the various LIMS differ markedly, so a common data format is needed for the exchange of data from the LIMS to EuroPhenome. An XML data format is used for this purpose whereby the phenotype data for each individual mouse making up a mutant strain cohort, which for the EUMODIC project is defined as seven or more individuals, can be submitted for each procedure carried out. Each procedure is defined using the Minimal Information for Mouse Phenotyping Procedures (MIMPP) standard, which was developed as part of the larger community-wide effort for minimum information for biological and biomedical investigations (MIBBI) (9), and is captured using its associated XML data format. The phenotype data XML files are uploaded to the institution's FTP site which EuroPhenome scans daily for new data. Each uploaded XML file is validated to ensure all required data points are present and the data for each parameter is of the correct type.
ANNOTATION PIPELINE
An SOP measures parameters which produce direct primary phenotype measurements. In combination with other primary phenotypes, these can be used to infer qualitative or descriptive phenotypes. For example, data for a mutant line for the hotplate test might include a time in seconds before the first response and the observation of a recognized response to heat. Where the time in seconds is less than the comparative background strain, the phenotype of ‘decreased thermal nociceptive threshold’ could be inferred. EuroPhenome describes the traits and phenotypes using ontologies, where both the pre-composed Mammalian Phenotype (MP) ontology (10) and the post-composed Entity and Quality (EQ) PATO (11) model are employed. The phenotype parameter (or mouse trait) is defined using EQ; for example, ‘coat hair’ + ‘texture’. The resulting phenotype is also defined using EQ where the phenotype quality is a child term to parameter quality within the PATO ontology; for example ‘coat hair’ + ‘greasy’. The quality terms ‘texture’ and ‘greasy’ share a parent-to-child relationship within PATO. Currently EuroPhenome annotates phenotypes using MP terms, where each MP term is the closest equivalent to the EQ phenotype description. The EQ annotations of parameters and the EQ and MP annotations of phenotypes are available at http://www.EuroPhenome.org/parameters.html.
EuroPhenome performs statistical comparisons of mutant line phenotype parameter data to baseline inbred strain phenotype parameter data to identify phenovariants. The statistical comparison takes place between related datasets only when critical metadata parameters are identical. Pearson's Chi-square test of independence is applied to categorical data and the Student's t-test and the Mann–Whitney U test are applied to quantitative data. These tests were chosen because they are familiar to the community and computationally tractable for the size of data set. Phenovariants are mutant lines which show a phenotype to be present to a greater or lesser extent compared to the baseline inbred strains. EuroPhenome stores all possible annotations and automatically applies the relevant MP term to the mutant line depending on the direction (increased or decreased) of the phenovariant. For a more detailed description of the use of ontologies in the annotation of EuroPhenome data, refer Beck et al. (12).
EUROPHENOME FUNCTIONALITY
The majority of users access EuroPhenome through the web interface and so a critical aim of the project has been to develop visual methods enabling quick and easy data access. The complexity and size of data generated from high-throughput phenotyping projects is a new challenge for bioinformatics and hence new methods and approaches to displaying this data are required.
EuroPhenome allows users to access the raw data and the annotated data described above through three new integrated web tools; the ‘Phenome Data Viewer’, the ‘PhenoMap’ and the ‘Ontology Tree’ Tool. In our previous NAR paper, we described the data browser for the visualization of the Eumorphia data; this browser is still available through the EuroPhenome portal by clicking on the ‘Eumorphia data browser’ link.
Phenome Data Viewer
The Phenome Data Viewer is the primary tool enabling users navigate through the raw phenotyping data from both the inbred mouse strains and the mutant strains to view dynamically generated graphs and overview statistics built from user entered selections. The type of graph displayed is preset depending on the parameter type: single quantitative parameters are displayed as bar charts, time series quantitative parameters are shown as line graphs and qualitative data is displayed in a stacked bar graph.
The left-hand panel of the viewer displays a number of selection boxes which the user can click to build the specific query of interest. The inbred mouse data option presents users with a number of choices (centre, strain, sex and procedure) allowing them to build the specific query they are interested in; for example, to compare data from an EMPReSSlim procedure between two inbred strains, the user would choose the strains of interest in the Strains selection box (e.g. C57BL/6NTac and C57BL/6J), the procedure and parameter/s from the relevant selection boxes (e.g. IPGTT and Blood glucose concentration) and click view data. The data view returned would be a line graph showing how blood glucose concentration varied over time (Figure 1a). This data view enables the user to drill further into the data and view the specific metadata parameters used when the data was collected, download the raw data used in generating the graph as well as viewing overview statistics.
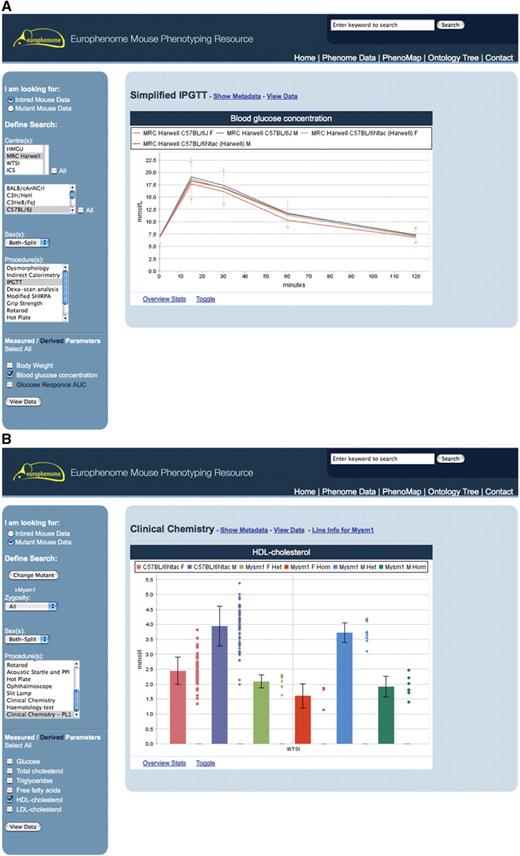
This interface shows the results of two queries using the Phenome Data Viewer. (A) The query builder menu on the left-hand side and the results panel on the right which displays a line graph of Blood glucose concentration from the Intraperitoneal glucose tolerance test (IPGTT) procedure performed on inbred mouse strains C57BL/6Ntac and C57BL/6J. (B) The same query builder for mutant data on the left-hand side and on the right, the bar chart graph of HDL-cholesterol for the Mysm-1 mutant.
The mutant mouse data viewer enables the user to choose one or more mutants of interest from the ‘Select Mutants’ list, before selecting the zygosity of interest, sex and the procedure and parameter in the same way as before (e.g. Mysm1, Clinical Chemistry PL1 and HDL cholesterol). The data view returned to the user comprises a graph, which now shows the results for the relevant baseline strain as well as the mutant line split by zygosity and sex, if chosen. In addition to the graph, the user can access overview statistics, which include the mean, standard deviation, standard error, results from the statistical tests shown as ‘Not significant, Significant, Highly Significant’ as well as highlighting differences in metadata (Figure 1b). The levels for these annotations are: not significant, P > 0.05; significant, P < 0.05; and highly significant, P < 0.001.
PhenoMap
Interaction with the scientific user community in EUMODIC identified that the majority of users of EuroPhenome would want to ask ‘Can I quickly find a phenovariant/s with the phenotype/s of interest?’. The PhenoMap (Figure 2) is a graphical representation of statistically significant phenovariants produced from the annotation pipeline described above. The left-hand panel of the PhenoMap allows user to view all mutant lines in EuroPhenome or to choose those of interest. The top panel has functionality for the user to choose the phenotyping pipeline (relating to EMPReSSslim) of interest, the sex, the P value range and the effect size of interest. Grey boxes in the map depict a procedure for which we currently do not hold data, the green boxes depict when data is available but no significant annotations were found at the current P-value and effect size. The red boxes show a significant annotation at the current P-value and effect size. Further information about the significant annotation can be easily accessed by hovering over the red box. At this point, the user can jump directly to the relevant graph in the phenome viewer. A user can also drill down into a specific procedure to view the annotations at a parameter level by clicking on the procedure name.
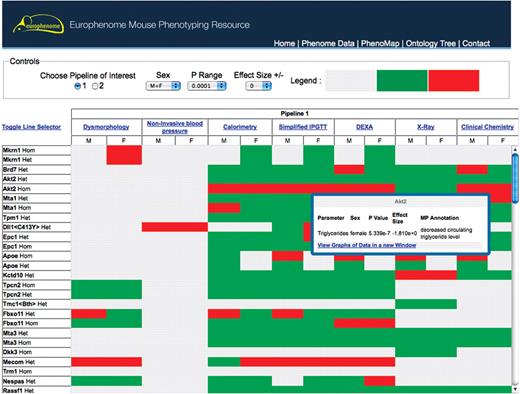
This interface shows the EuroPhenome PhenoMap tool, which is a heatmap representation of statistically significant phenovariants produced from the annotation pipeline. The top panel is an interactive tool to change the phenotyping pipeline (relating to EMPReSS) of interest, the sex, the P range and the effect size. Grey boxes in the map depict a procedure for which we currently do not hold data, the green boxes depict when data is available but no significant annotations were found at the current P-value and effect size. The red boxes show a significant annotation at the current P-value and effect size. Further details on red boxes can be obtained by hovering over the box.
Ontology Tree
The ‘Ontology Tree’ tool enables the user to move through the MP ontology tree to view ontology annotations produced from the annotation pipeline for each line (Figure 3). Selecting a MP term of interest displays a table in the right-hand panel showing the mutant line, the procedure, the parameter and the ontology term it was annotated with. Again, the user can quickly jump to the phenome data viewer graph of interest by clicking on the graph link.
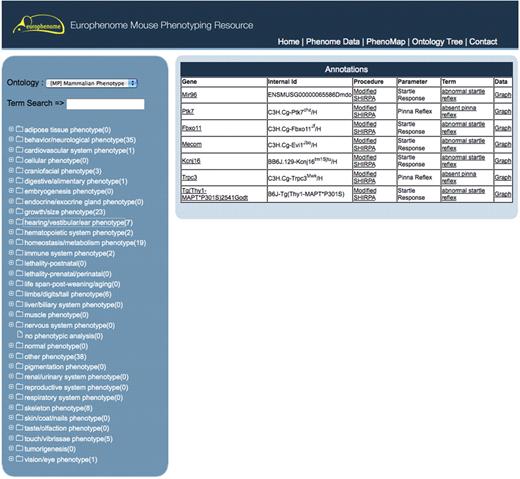
This interface shows the EuroPhenome Ontology Tree tool, with the MP ontology tree on the left-hand panel and six mutants on the right-hand panel, that have been identified from the annotation pipeline as having ‘hearing/vestibular/ear phenotypes’. A direct link to the graphical display for the procedures can be accessed from the data column.
IMPLEMENTATION
The XML generation, validation and export is automated using a Java library available under the GPL at http://sourceforge.net/projects/EuroPhenome/. This is implemented at the mouse clinics and allows a common process of validation and XML generation as well as minimizing the work required to export data to EuroPhenome.
When new data is entered into EuroPhenome, a number of processes are automatically performed. The annotation pipeline is implemented as a Java application that uses the same code that generates the statistical information on the website. If a statistically significant phenovariant is discovered, the data is inserted into a database called the Ontology Annotation sysTem at Harwell (OATH). This stores information about the mutant (such as gene affected and zygosity of group showing difference), the parameter and detected trait along with the results of the statistical test. This allows the ontology visualization tools to tailor the result to the user-specified values.
If new mutant lines are uploaded, a number of resources are used to collect the genotype information. These include the external web services of EUCOMM, EMMA and KERMITS for EUCOMM lines and an internal copy of the MGI database for non-EUCOMM lines.
The EuroPhenome database is implemented in MySQL (http://www.mysql.com/) running on Solaris, and interacts with the OATH and EMPReSS databases running on the same platform. The Phenome Data Viewer is implemented as a Java Servlet and the PhenoMap and Ontology Tree are implemented in PHP. The website is styled using css. The Ontology Tree uses DHTML and AJAX to provide the relevant information as the tree is traversed, and an auto suggest function to find a term of interest. The PhenoMap uses JavaScript to provide user functionality, including the Prototip library to provide the hover-over information. The Phenome Data Viewer uses JavaScript to provide the user filter selection, including providing the user with only relevant options depending on their selection. The images are generated by JFreeChart (http://www.jfree.org/jfreechart/). Memcached (http://www.danga.com/memcached/) is used to improve performance.
The statistics are calculated using the Apache Commons Math library for the Pearson's chi-square test, Student's t-test and the descriptive statistics, and the Java Statistical Classes library for the Mann–Whitney U-test.
FUTURE DIRECTIONS
The systematic acquisition of phenotype data on mutant mouse lines will be central to the functional annotation of the mouse genome over the coming decades (13,14). These data will be equivalent to that produced by genome projects in providing the fundamental information upon which detailed characterization of mammalian gene function can be built. Because of the fundamental role of these resources there is a strong move to make both material mouse resources and data about them freely accessible (15). The EUMODIC consortium is laying the foundations of this phenotyping effort but wider plans are being developed to build an International Mouse Phenotype Consortium (IMPC) to carry out this systematic phenotyping.
Both physical and bioinformatics infrastructure will be needed to support such a major project. EuroPhenome represents the first step towards developing the bioinformatics infrastructure. Major developments can be expected in future in ways of collecting, representing and visualizing phenotype data in conjunction with other data, such as genomic data, to make them more readily interpretable by the bench biologist. Novel modes of data analysis, including a more refined approach to statistical analysis, will also be needed to provide the maximum value from phenotyping data. EuroPhenome aims to extend its scope beyond EUMODIC to allow systematically acquired phenotype data from different sources to be presented within the same framework, adding value to all of these data sets by integrating them with others.
ACKNOWLEDGEMENTS
The authors thank the members of the EUMODIC Bioinformatics workpackage, the EUMODIC consortium and the members of the mouse clinics who worked very hard to produce and export the data. They also thank their IT colleagues at EMMA and EUCOMM for feedback on EuroPhenome and help with data integration and Karen Pickford, the scientific curator at Harwell, who helped to ensure the nomenclature of the mutant lines is correct.
FUNDING
European Commission within its FP6 Programme (contract number LSHG-CT-2006-037188 to EUMODIC; UK Medical Research Council and the NGFN (National Genome Research Network) (grant number 01GS0850). Funding for open access charge: EUMODIC FP6 Programme.
Conflict of interest statement. None declared.
REFERENCES
APPENDIX 1: THE EUMODIC CONSORTIUM
Autonomous University of Barcelona (UAB), Spain
Fatima Bosch1, Jesús Ruberte1, Tura Ferre1, Anna Pujol1, Pedro Otaegui1, Sylvie Franckhauser1
Ani.Rhône-Alpes Lyon, France
Jacqueline Marvel2, Veronique Queste2, Romain Dacquin2, Sophia Djebali2, Pierre Jurdic2
Alexander Fleming Biomedical Sciences Research Center, Athens, Greece
George Kollias3, Christina Chandras3, Eleni Douni3, Vassilis Aidinis3
CNIO, Madrid, Spain
Mariano Barbacid4, Marta Cañamero4, Pierre Dubus5
Helmholtz Centre for Infection Research (HZI), Braunschweig, Germany
Rudi Balling9, Hansjörg Hauser9, Bastian Pasche9, Werner Müller10, Andreas Lengeling11
CNR, IBC Monterotondo, Italy
Glauco Tocchini-Valentini6, Silvia Mandillo6, Elisabetta Golini6, Daniela Marazziti6, Giancarlo Deidda6, Nicoletta Rossi6, Rafaele Matteoni6, Marcello Raspa6, Ferdinando Scavizzi6, Richard Hugh Butler6, Gianfranco Di Segni6, Paolo Fruscoloni6, Patrizia Calandra6, Cecilia Mannironi6, Daniela Scarabino6, Giuseppe D. Tocchini-Valentini6, Michela Zamboni6, Sabrina Putti6, Chiara Di Pietro6, Serena Gastaldi6
CNRS, Institut de Transgenose, Orleans, France
Yann Herault7, Bernard Ryffel7, Marc le Bert7, Patricia Lopes Pereirea7, Véronique Brault7, Emilie Dalloneau7, Stéphanie Pothion7
EMBL Mouse Biology Monterotondo, Italy
Nadia Rosenthal8, Mumna Al Banchaabouchi8, Raffaele Migliozzi8, Ekaterina Salimova8
Helmholtz Zentrum München, German Research Center for Environmental Health, Munich, Germany
Martin Hrabé de Angelis12,a, Valérie Gailus-Durner12, Helmut Fuchs12, Thure Adler12,14, Antonio Aguilar-Pimentel12,b, Lore Becker12,c, Raffi Bekeredjian12,d, Dirk H. Busch14, Julia Calzada-Wacke, Patricia Da Silva-Buttkuse, Irene Espositoe, Jack Favorf, Wolfgang Fleischmann12, Lilian Garrett13, Lisa Glasl13, Alexander Götzg, Jochen Graw13, Wolfgang Hans12, Sabine M. Hölter-Koch13, Boris Ivandic12,d, Hugo A. Katus12,d, Martin Klingenspor12,h, Thomas Klopstock12,c, Christoph Lengger12, Tonia Ludwig12, Holger Maier12, Kateryna Micklich12, Sun Minxuan13, Beatrix Naton12, Frauke Neffe, Markus Ollert12,b, Oliver Puk13, Leticia Quintanilla-Fende, Ildiko Racz12,i, Birgit Rathkolb12,j, Jan Rozman12,h, Karl-Heinz Schäble12, Evelyn Schiller12, Anja Schrewe12, Ralf Steinkamp12, Claudia Stöger12, Tobias Stögerg, Holger Schulzg, Monica Toste, Irina Treise12, Daniela Vogt-Weisenhorn13, Monja Willershäuser12, Eckhard Wolf12, Annemarie Wolff-Muscate13, Wolfgang Wurst13,k, Ramona Zeh12, Andreas Zimmer12,i
Institut Clinique de la Souris, Strasbourg, France
Jean-Louis Mandel15, Yann Hérault15, Marie-France Champy15, Mohammed Selloum15, Hamid Meziane15, Laurent Monassier15, Roy Combe15, Michel Roux15, Abdel Ayadi15, Stéphanie Muller15, Elodie Bedu15, Julien Becker15, Sophie Leblanc15, Tania Sorg15, Laurent Vasseur15
MRC Human Genetics Unit, Edinburgh, UK
Ian Jackson18, Sally Cross18, Russell Joynson18, Shalini Jadeja18
Tel Aviv University, Israel
Karen Avraham19, Amiel Dror19, Shaked Shivatzki19
Telethon Institute of Genetics and Medicine (TIGEM), Italy
Andrea Ballabio20, Graciana Diez-Roux20
MRC Harwell (MGU and MLC), UK
Steve Brown16, Hilary Gates16, Niels Adams17, Sarah Atkins16, Tim Beck16, Andy Blake16, Kan Pai Chiev16, Andre Chouankam16, Roger Cox16, Paul Denny16, Irina Emelyanova16, Martin Fray17, Simon Greenaway16, John Hancock16, Tertius Hough17, Kelly Hunt16, Rachel Kendall16, Kirsty Lee16, Ann-Marie Mallon16, Hugh Morgan16, Pat Nolan16, Paul Potter17, Michelle Stewart17, Lydia Teboul17, Simon Vowell16, Sara Wells17, Joe Wood17, Rumana Zaman16
University of Cambridge, UK
Paul Schofield21, Michael Gruenberger21, Jules Griffin22
University of Lausanne, Switzerland
Walter Wahli23, Frederic Preitner23, Maria Belen Delgado23, Béatrice Desvergne23, Liliane Michalik23, Elodie Bedu23
University of Manchester, UK
Ludwig Neyses24, Elizabeth Cartwright25, Sukhpal Prehar25, Min Zi25
The Wellcome Trust Sanger Institute, Cambridge, UK
Ramiro Ramirez-Solis26, Karen Steel26, Jacqui White26, Dave Sunter26, David Melvin26, Anna Karin Gerdin26, Natalia Igosheva26, Jeanne Estabel26, Sophie Messager26, Natasha Karp26, Carl Shannon26, Laura Roberson26, David Richardson26, Christine Podrini26, Mark Lucas26
1Centre of Animal Biotechnology and Gene Therapy, School of Veterinary Medicine, Autonomous University of Barcelona, 08193 Bellaterra, Spain
2Ani.Rhone-Alpes, IFR128, 21 Avenue Tony Garnier, Lyon Cedex 07, France
3Alexander Fleming Biomedical Sciences Research Center, Athens, Greece
4Centro Nacional de Investigaciones Oncologicas (CNIO), Molecular Oncology & Comparative Pathology, Melchor Fernandez Almagro 3, 28029 Madrid, Spain
5Histology and Molecular Pathology Department, University of Bordeaux, EA2406, 146 Rue Leo Saignat, 33076 Bordeaux, France
6IBC-CNR, Campus ‘A.Buzzati-Traverso’, via Ramarini 32 00016 Monterotondo Scalo, Rome, Italy
7CNRS Institut de Transgenose, IEM, 3B rue de la ferollerie 45071 Orleans cedex 2, France
8EMBL Monterotondo, Mouse Phenotyping Facility, ‘A.Buzzati-Traverso Campus’, via Ramarini 32, 00015 Monterotondo Scalo, Rome, Italy
9Helmholtz Centre for Infection Research (HZI), Mascheroder Weg1, 38124, Braunschweig, Germany
10The University of Manchester, AV Hill Building, Oxford Road, Manchester, M13 9PT, UK
11The Roslin Institute, University of Edinburgh, Easter Bush Veterinary Research Centre, Roslin, Midlothian, EH25 9RG, UK
12Helmholtz Zentrum München, German Research Center for Environmental Health, Institute of Experimental Genetics and German Mouse Clinic, Ingolstaedter Landstrasse 1, D-85764 Neuherberg, Germany
13Helmholtz Zentrum München, German Research Center for Environmental Health, Institute of Developmental Genetics, Ingolstaedter Landstrasse 1, D-85764 Neuherberg, Germany
14Institute for Medical Microbiology, Immunology and Hygeine, Technische Universität München, Trogerstrasse 9, 81675 Munich, Germany
15Institut Clinique de la Souris (ICS), 1 Rue Laurent Fries, BP10142, 67404 Illkirch, Cedex, France
16Medical Research Council Mammalian Genetics Unit, Harwell, Oxfordshire, OX11 0RD, UK
17Medical Research Council Mary Lyon Centre, Harwell, Oxfordshire, OX11 0RD, UK
18Medical Research Council Human Genetics Unit, Comparative and Developmental Genetics Department, Western General Hospital, Crewe Road, Edinburgh, EH4 2XU, UK
19Department of Human Molecular Genetics and Biochemistry, Sackler Faculty of Medicine, Tel Aviv University, Tel Aviv, Israel
20Telethon Institute of Genetics and Medicine, Via Pietro Castellino 111, 80131 Napoli, Italy
21Department of Physiology, Development and Neuroscience, University of Cambridge, Downing Street, Cambridge, CB2 3DY, UK
22Department of Clinical Biochemistry, University of Cambridge, Addenbrooke's Hospital, Box 232, Hills Road, Cambridge CB2 2QR, UK
23Center for Integrative Genomics, National Centre of Research ‘Frontiers in Genetics’, University of Lausanne, BEP, CH-1015 Lausanne, Switzerland
24Manchester Heart Centre, Manchester Royal Infirmary, University of Manchester, Oxford Road, Manchester M13 9WL, UK
25Medical School, Rm 1.302, Stopford Building, University of Manchester, Oxford Road, Manchester, M13 9PT, UK
26The Wellcome Trust Sanger Institute, Wellcome Trust Genome Campus, Hinxton, Cambridge, CB10 1SA, UK
aChair of Experimental Genetics, Center of Life and Food Sciences Weihenstephan, Technische Universität München, Ingolstädter Landstr. 1, 85764 Neuherberg, Germany
bDivision of Environmental Dermatology and Allergy (UDA), Helmholtz Zentrum München/Technische Universität München, and Clinical Research Division of Molecular and Clinical Allergotoxicology, Department of Dermatology and Allergy, Technische Universität München, Munich, Germany
cNeurological Clinic, Friedrich–Baur-Institute, Ludwig–Maximialians-Universität, Ziemssenstr. 1a, 80336 Munich, Germany
dHeidelberg University Hospital, Im Neuenheimer Feld 410, 69120 Heidelberg, Germany
eInstitute of Pathology, Helmholtz Zentrum München, German Research Center for Environmental Health GmbH, Ingolstädter Landstr. 1, 85764 Neuherberg, Germany
fInstitute of Human Genetics, Helmholtz Zentrum München, German Research Center for Environmental Health GmbH, Ingolstädter Landstr. 1, 85764 Neuherberg, Germany
gInstitute of Lung Biology and Disease, Helmholtz Zentrum München, German Research Center for Environmental Health GmbH, Ingolstädter Landstr. 1, 85764 Neuherberg, Germany
hTechnische Universität München, Molecular Nutrional Medicine, Else Kröner-Fresenius Center, Am Forum 8, 85354 Freising-Weihenstephan, Germany
iInstitute of Molecular Psychiatry, Life & Brain Center, University of Bonn, Sigmund Freud Str. 25, 53127 Bonn, Germany
jGene Center, Institute of Molecular Animal Breeding and Biotechnology, Ludwigs-Maximilians-University München, Feodor-Lynen Str. 25, 81377 Munich, Germany
kChair of Developmental Genetics, Center of Life and Food Sciences Weihenstephan, Technische Universität München, Ingolstädter Landstr. 1, 85764 Neuherberg, Germany
Author notes
†The members of the EUMODIC Consortium are listed in the Appendix 1.

Comments