


Abstract
KorA is a global repressor in RP4 which regulates cooperatively the expression of plasmid genes whose products are involved in replication, conjugative transfer and stable inheritance. The structure of KorA bound to an 18-bp DNA duplex that contains the symmetric operator sequence and incorporates 5-bromo-deoxyuridine nucleosides has been determined by multiple-wavelength anomalous diffraction phasing at 1.96-Å resolution. KorA is present as a symmetric dimer and contacts DNA via a helix–turn–helix motif. Each half-site of the symmetric operator DNA binds one copy of the protein in the major groove. As confirmed by mutagenesis, recognition specificity is based on two KorA side chains forming hydrogen bonds to four bases within each operator half-site. KorA has a unique dimerization module shared by the RP4 proteins TrbA and KlcB. We propose that these proteins cooperate with the global RP4 repressor KorB in a similar manner via this dimerization module and thus regulate RP4 inheritance.
INTRODUCTION
Plasmids of the incompatibility group IncP are capable of transfer and stable inheritance in most Gram-negative bacteria (1). Besides various bacterial hosts, they can also transfer to yeast (2) and some higher eukaryotic cells (3). IncP-1 plasmids are divided into several subgroups, α, β, γ and δ (4,5). The best-studied family members share a common backbone and fall in the α and β subgroups (6): RP4 (indistinguishable from RK2, R18, R68 and RP1) for IncP-1α (7) and R751 for IncP-1β (8). Their regulatory circuit, which coordinates partition, replication and transfer functions, is controlled by the global repressor proteins KorA, KorB and TrbA, each repressing several operons, while each operon is regulated by more than one repressor (9).
The stable maintenance of low-copy genomes like RP4 (60 099 bp with four to seven copies per chromosome) is based on accurate DNA segregation before cell division. This active partition (par) system of RP4 is encoded in the complex korAB operon. It carries the genes of its transcriptional repressors KorA and KorB (7) as well as the gene responsible for incompatibility, incC (10). IncC is made in two forms by two different translational starts in the same reading frame (11). The incC1 (full-length gene product of 364 aa) and incC2 (encoding an N-terminally truncated version of 259 aa) starting regions are overlapped by the start and stop codon of korA, respectively, in the second reading frame. This remarkable korA/incC1/incC2 arrangement of overlapping genes, by tandem in-frame initiation regions or by using the coding capacity of a different reading frame is conserved throughout the P-plasmids (7). While KorA contains a HTH motif, IncC1 is neither a DNA-binding protein nor a transcriptional repressor.
KorA consists of 101 residues (11 306 Da, pI = 10.4) and exists as a dimer in solution. It recognizes and binds a 12-bp symmetric operator OA (consensus sequence 5′-GTT TAG CTA AAC-3′) found at seven promoter sites on RP4 with different affinities (12). At five promoter regions a KorB operator site (OB) is also present, separated from OA center-to-center by 32 bp (korAp), 33 bp (trfAp, klaAp), 36 bp (kfrAp) or 92 bp (kleAp). Interaction of both proteins is important to accomplish strong repression. KorB acts very flexibly and cooperates with other repressor proteins from various distances with no particular helical position required (13,14). KorA interacts with KorB directly through its C-terminus (15). This domain exhibits a high level of conservation between KorA and two other RP4 proteins, TrbA and KlcB (16,17).
To elucidate the binding of the KorA repressor protein to its operator sequence and reveal the molecular determinants of gene regulation by KorA, we have analyzed the structure of the KorA homodimer complexed to an 18-bp oligonucleotide containing the operator binding site OA. The architecture of the KorA–operator complex leads us to propose a model for gene regulation at OA/OB promoters in which KorB binds to the KorA dimerization interface from various distances through interactions involving the KorB N-terminus, while both proteins bind their operator sites.
MATERIALS AND METHODS
Recombinant expression, protein purification, complex formation and crystallization
The coding region for the KorA protein (residues 1–101) was inserted into the bacterial expression vector pMS470Δ8 (18). Mutant variants were generated using the QuikChange mutagenesis protocol (Stratagene, Heidelberg). Escherichia coli BL21 (DE3) carrying the appropriate wild-type (wt) or mutant korA expression plasmid was cultured at 37°C. Transcription in cells was induced at A600 = 0.8 by addition of 1 mM isopropyl-1-thio-β-d-galactopyranoside. Growth was continued for 4 h.
After harvesting, cells were resuspended in 20 mM Tris–HCl (pH 7.5), 1 M NaCl, 10% (v/v) glycerol, 1 mM DTT and 1 mM Pefablock and lysed using a French Press. KorA and mutants were purified essentially according to (12). In the final purification step, the proteins were subjected to size-exclusion chromatography (Superdex 75, Pharmacia), equilibrated with 20 mM Tris/HCl (pH 8.0), 100 mM NaCl and 3 mM MgCl2. The proteins migrate as a single peak and elute as dimers at a volume corresponding to 22 kDa. Proteins were further concentrated in a 5-K-cutoff Ultrafree Millipore membrane. The full-length wt KorA was stable in solution as confirmed by mass spectrometry and analytical ultracentrifugation. It did not crystallize under any condition tested.
HPLC-purified 18-bp oligonucleotides (OA*, 5′-CBrUBrU GTT TAG CTA AAC ABrUT-3′ and 5′-AAT GTT TAG CTA AAC AAG-3′), purchased from BioTeZ (Berlin), were used for crystallization. The brominated DNA was kept in the dark at all time. Strands were mixed in 1:1 ratio, annealed and purified on a gel-filtration column (Superdex 75, Pharmacia), equilibrated with 20 mM Tris/HCl (pH 8.0), 100 mM NaCl and 3 mM MgCl2. KorA and DNA were mixed in a 2.5:1 molar ratio, incubated at 37°C for 20 min, and subjected to size-exclusion chromatography to separate the KorA–OA complex at 33 kDa from free DNA and protein. Ultracentrifugation confirmed that one KorA dimer binds to one OA site. The complex was concentrated to 3.8 mg/ml.
Crystallization conditions were identified by the hanging-drop vapor diffusion method. The best crystals of the complex were obtained by mixing 2 µl of KorA–OA* complex (3.8 mg/ml) with 1 µl of reservoir solution of 0.5 M (NH4)2SO4, 0.1 M Na+ citrate (pH 5.6) and 1.0 M Li2SO4. Monoclinic crystals grew in 3–5 days at 20°C in the dark.
In vitro binding assays
The 436-bp DNA fragment containing OA1 was PCR-amplified using RP4 as template. The primers used are OA1_cw (5′-AAT GTT AGT TAA CAG CTG TGT GGC TTC CCA TCG ACT AA-3′) and OA1_ccw (5′-AAT GTT AGT TAA AAG CTT ATC GGC GCG ATC CTG GCG-3′). The competitor DNA (348 bp, 745 bp and 1082 bp) without the OA sequence was also generated by PCR.
The standard reaction mixture (10 µl) contained 20 mM Tris/HCl (pH 8.0), 100 mM NaCl and 3 mM MgCl2. We used 0.15 pmol of each PCR construct throughout. The reactions were then incubated with purified protein at a molar ratio of 1:50 for 20 min at 37°C. After incubation the reactions were analyzed by electrophoresis on a nondenaturing 7.5% polyacrylamide gel in 1 × TBE running buffer at 8 V/cm, stained with ethidium bromide.
Isothermal titration calorimetry (ITC) measurements
For ITC experiments, purified KorA and 18-bp oligonucleotides (OA, 5′-CTT GTT TAG CTA AAC ATT-3′ and 5′-AAT GTT TAG CTA AAC AAG-3′), were dialyzed against the buffer, 20 mM Tris/HCl pH 8, 100 mM NaCl and 3 mM MgCl2. Samples were degassed for ∼5 min by vacuum aspiration prior to loading, and all titrations were carried out at 310 K. Experiments were performed on a VP MicroCal VP-ITC titration calorimeter (MicroCal Inc., Northampton, MA) using the VPViewer 2000 software for instrument control and data acquisition. KorA solution measuring 40 µM was filled in a stirred (310 r.p.m.) reaction cell of 1.4 ml. Injections, each of 10-µl volume (first injection always 5-µl volume) and 10-s duration with a 4-min interval between injections, were carried out using a syringe filled with 200 µM 18-mer OA (Figure 5C) solution. Thermogram analysis was performed using the software ORIGIN (version 7.0) provided by the manufacturer.
X-ray data collection and processing
Two crystals were frozen in liquid nitrogen, and the solution for cryoprotection contained the reservoir solution with 15% (v/v) of glycerol. A two-wavelength MAD experiment was carried out at 100 K in the dark using synchrotron radiation at beamline BL 14.1 (19) at BESSY (Berlin) on a fast scanning 225 mm CCD-mosaic detector from MAR Research (Norderstedt). Following the fluorescence scan the program ‘CHOOCH’ (20) calculated the anomalous scattering curves, and the wavelengths for the peak and inflection point were chosen. Data processing and scaling were carried out with XDS (21). The refinement statistics are given in Table 1. The KorA–OA* complex crystallized in space group P21 with cell parameters of a = 44.83 Å, b = 115.45 Å, c = 49.88 Å, β = 114.0°. The asymmetric unit contains one copy of the 33-kDa complex, with a solvent content of 65%.
Data collection and refinement statistics
| Data set | Peak | Inflection point | Native-like merged peak |
|---|---|---|---|
| Data collection | |||
| Wavelength (Å) | 0.91991 | 0.92004 | 0.91991 |
| Resolution range (Å)a | 50–1.96 (2.08–1.96) | 50–1.96 (2.08–1.96) | 50–1.96 (2.08–1.96) |
| Total reflectionsa,b | 229 922 (19 830) | 216 313 (18 556) | 230 648 (20 085) |
| Unique reflectionsa | 60 942 (7376)b | 60 954 (7347)b | 31 085 (3817) |
| Completeness (%)a | 92.6 (68.4) | 92.5 (68.0) | 93.3 (70.1) |
| <I/σ(I)>a | 32.2 (12.7) | 37.1 (11.4) | 42.5 (17.4) |
| Rsym (%)a | 2.5 (6.5) | 2.2 (7.5) | 2.7 (7.4) |
| Rmeas (%)a,c | 2.9 (8.3) | 2.5 (9.7) | 2.9 (8.2) |
| Refinement | |||
| Resolution range (Å) | 50–1.85 | ||
| Rwork (%) | 17.0 | ||
| Rfree (%) | 20.1 | ||
| Reflections in Rwork | 32 666 | ||
| Reflections in Rfree | 1753 | ||
| R.m.s. deviations | |||
| Bond lengths (Å) | 0.006 | ||
| Bond angles (°) | 1.522 | ||
| No. of atoms | |||
| Protein and DNA | 2961 | ||
| Water oxygens | 317 | ||
| Ramachandran (%) | |||
| Most favored | 98.8 | ||
| Additional allowed | 1.2 |
aValues in parentheses are for the highest resolution shell.
bFriedel pairs not merged.
cMultiplicity-corrected Rsym as defined by Diederichs and Karplus (41).
Structure analysis and refinement
The structure of the complex containing KorA (1–101) and the 18-bp OA* oligomer, in which three thymine residues were replaced by 5-bromodeoxyuracil (Figure 4A), was solved by multiple-wavelength anomalous diffraction (MAD). The program HKL2MAP (22) located six heavy atom sites, differing in relative occupancy and anomalous contribution. The number and position of the bromine sites was the first indication of a 2-fold disorder of the OA* duplex.
To improve the quality of the electron density map, the density modification program DM (23) was used. The noncrystallographic symmetry (NCS) of the heavy atoms in the ASU permitted subsequent phase improvement by DM, including automatic solvent and NCS masking as well as solvent flattening. warpNtrace implemented in the ARP/wARP software package (24) automatically built a first protein model (chain A 4–31, A 34–54, B 25–37 and B 47–61). This model was then manually adjusted and extended in O (25). Superposition of the A and B chains of KorA in LSQKAB (26) helped extend the model (chain A 3–61 and B 12–62). It was refined using Refmac5 and loose NCS restraints (27). Five percent of the reflections were set aside for cross-validation, and Rfree was used to monitor model refinement strategy and progress. After five runs of warpNtrace an 18-mer DNA model (strands E and F), created with MAKE-NA (http://structure.usc.edu/make-na/), was inserted manually into the positive Fo–Fc difference density and adjusted, guided by three bromine positions. Water molecules were added to the model (chains A 3–93 and B 5–93) using ARP/wARP. Strong positive density was observed at the three terminal base pairs on both ends (Figure 4C). This was satisfied by superimposing the DNA duplex in two orientations, and fitting the second double strand into the density using the three nonoccupied bromine positions. The occupancy of all DNA atoms was adjusted to 0.5, and the six bromine positions were set to 0.25. Although the light-sensitive brominated oligonucleotides were kept in the dark during purification, crystallization and the MAD experiments, the heavy atom sites were thus not fully occupied. Final refinement steps resulted in Rfree and Rwork of 20.1% and 17.0%, respectively (Table 1). Diffraction data and atomic coordinates are available from the RCSB Protein Data Bank under 2w7n.
The refined structure shows excellent stereochemistry according to PROCHECK (28) and WHATCHECK (29) and contains one KorA (chains A 2–95 and B 3–97) dimer, one complete 18-bp OA* duplex with a 2-fold disorder, and 317 solvent molecules. Figures were generated with PyMOL (30). Surface charges were calculated with APBS (31) in a range from −10 kT (red) to +10 kT (blue).
RESULTS
Structure determination
We crystallized the full-length transcriptional repressor KorA (residues 1–101) bound to a pseudo-symmetric 18-bp oligonucleotide, OA*, of sequence 5′-CBrUBrU GTTTAG CTA AAC ABrUT-3′ (OA consensus sequence underlined). Outside of the 12-bp operator sequence three 5-bromo-deoxyuridine nucleosides were introduced into one DNA strand, and the crystal structure was solved by MAD phasing at a resolution of 1.96 Å (Figure 1). The asymmetric unit of the crystal contains one KorA dimer bound to OA*. The structure was refined to Rwork = 17.0% and Rfree = 20.1% (Table 1). The electron density of the complex is well defined. Alternative side chain conformations were observed for Glu63 (chains A and B of KorA) as well as Glu25 and Asp64 (chain B). These three solvent-exposed residues are not involved in KorA dimerization or DNA binding, and therefore the arrangement of the complex is not affected. All protein residues could be built into the electron density apart from several N- and C-terminal residues, so that the final model contains residues 2–95 of chain A and 3–97 of chain B.
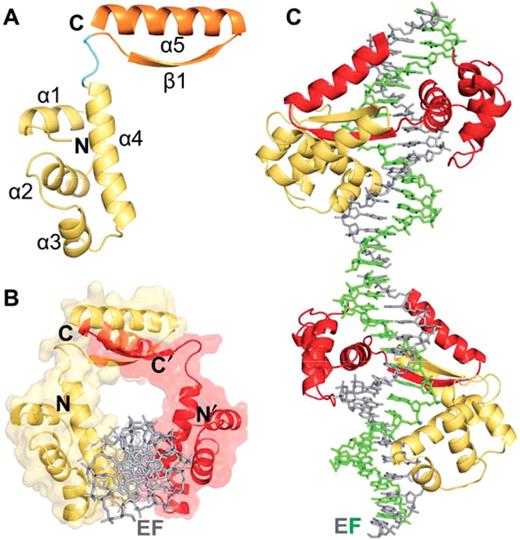
Overall structure of the KorA-OA* complex. (A) Schematic representation of the KorA monomer with the N-terminal DNA-binding domain (yellow), the linker (cyan) and the C-terminal dimerization module (orange). (B) Image of the KorA dimer (yellow and red) on a semitransparent molecular surface bound to its operator site, looking down the DNA axis. For clarity, the DNA (gray) is shown in only one of the two orientations present in the complex. (C) Pseudo-continuously stacked operator DNA bound to the KorA dimer (yellow and red). The DNA is shown with strands E (gray) and F (green) of one duplex.
KorA structure
The KorA monomer is composed of two distinct domains connected by a linker consisting of residues 66–69. A four-helical assembly (α1, residues 7–14; α2, 21–31; α3, 37–44; α4, 48–65) forms the N-terminal DNA-binding unit. The predicted HTH motif is comprised of α3, the scaffold helix and α4, the recognition helix. On one side, the recognition helix is flanked by the three short helices α1–α3, going up and down perpendicular to α4. One right-twisted β-strand (β1, 72–78) and the adjacent C-terminal helix (α5, 80–97) form the dimerization module. The helix α5 is positioned antiparallel to β1 resulting in a gripper-like shape (Figure 1A).
KorA dimerization
With their C-terminal gripper the KorA monomers interlock into a very tight homodimer. The β-strands associate to form an antiparallel β-ladder, and the C-terminal α-helices form a two-helical bundle with an interaxial angle of ∼20° (Figure 1B). In this arrangement, the helices stretch out along the curved surface of the β-sheet, and residues within the entire length of the α5-helices interact with residues of the β-sheet. Interactions modeling the dimer interface initiate in the linker region at residue Leu67 and continue toward the C-terminus of each monomer. The surface area buried in the dimerization interface covers 14.7% (2115 Å2) of the total solvent-accessible surface area, ASA, (14 345 Å2) for both KorA monomers, calculated using the PISA server (32) with a probe radius of 1.4 Å. Across the interface, side chain interactions are hydrophobic in the core region with the tightly packed aliphatic side chains of Val74, Leu78 and Val86 (Figure 2A). The strongest van der Waals interactions (ΔASA > 40 Å2) arise from residues Tyr71-Pro79 of the β1-strand, and the α5 residues Gln82 and Val86-Glu90, symmetrically contributed by each monomer. The β-strands are connected to an antiparallel β-ladder by eight hydrogen bonds formed between opposite main chain atoms (Ala72, Val74, Ala76 and Leu78) and the hydrogen bonded side chains of Thr75 directly in the center of the sheet. Hydrogen bonding between backbone atoms of Gly70 and Glu80 positions the N-terminus of helices α5 and α5′ on top of the N-terminus of the strands β1′ and β1, respectively.

Interactions within the KorA dimerization module. (A) Stereo image of the KorA dimerization interface. All residues involved in dimerization are shown for both monomers (yellow and red). (B) Stereo representation of the KorA dimerization module (yellow and red). Residues involved in stabilization of the ring-like assembly are shown as sticks.
Ring-like complex assembly
In the crystal structure, the dimerization module of the KorA dimer is displaced from the DNA-binding domain, bound to its operator OA. The C-terminal domain is elevated above the DNA-binding part of KorA and stabilized through various interactions. First, residues from the linker and dimerization region are involved in stacking-like van der Waals interactions. Side chains of Pro68-A, Tyr71-A and Pro79-B are arranged on top of each other in a sandwich formation with Tyr71-A positioned in the center (Figure 2A). This arrangement is continued with stacking-like van der Waals interactions of Gln82-B, contacting Pro79-B and Trp89-A. Due to the 2-fold pseudo-symmetry of dimeric KorA, these interactions occur twice in the interface. Second, the hydrogen bonded side chains of Asp64 and Arg73, each belonging to a different subdomain within one KorA monomer, are stabilizing the assembly. In chain B this interaction is water mediated (Figure 2B). The spatial separation of the dimerization subdomain from the major groove of the DNA results in a ring-like appearance of the complex assembly with an inner diameter of ∼20 Å (Figure 1 B).
In solution, the ring-like assembly of the KorA–DNA complex may be expected to be deformable, and a flexible attachment of the C-terminal domain to the DNA-bound core of the protein is most likely biologically relevant. KorA is known to cooperate with another major RP4 repressor protein, KorB, via its C-terminal domain from various distances (33). For these direct interactions the ring-like assembly could potentially serve as an adaptable anchor site.
Proposed KorA–KorB interaction site
To understand the interaction between KorA and KorB in transcriptional regulation of RP4 genes we aligned the sequences of RP4 and R751 proteins KorA, TrbA and KlcB, all known to cooperate with KorB (16) using CLUSTALW (34). KorA and TrbA are global repressors in these plasmids, but the function of KlcB is still unknown (17). Over the length of the matched sequences, a variable degree of sequence conservation is observed (Figure 3A), indicating similar three-dimensional structures. The repressor proteins KorA and TrbA share a predicted HTH motif. Sequence conservation within this motif is limited, reflecting the different operator sequences on the RP4 or R751 genomes to which the repressors bind. A strikingly high degree of sequence conservation characterizes the dimerization module with identical residues at 10 sequence positions between Pro68 and Lys96 of KorARP4. For the KorA and TrbA proteins this conservation is found at the C-terminus, KlcBRP4 and KlcBR751 include additional 116 or 154 residues, respectively, adjacent to this region.
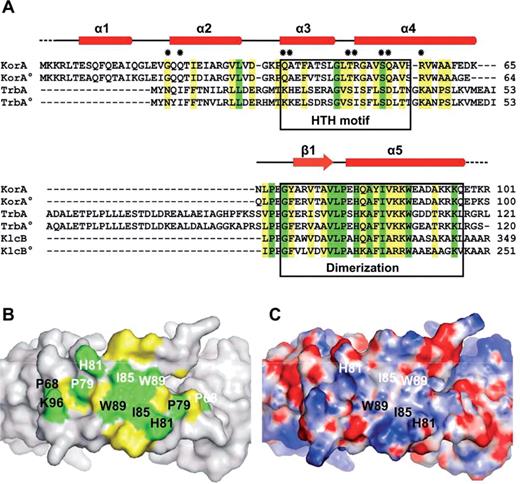
The dimerization module of KorA. (A) Multiple sequence alignment of RP4 and R751 (R751 members marked with °) proteins KorA, TrbA and KlcB (accession numbers as listed above and shared identity toward full-length KorARP4: P03052, 100%; Q57423, 79%; Q01716, 51%; Q56468, 59%; P52605, 32%; and P52604, 41%). The secondary structure elements of KorA are represented above the aligned sequences. Identical and similar residues are highlighted in green and yellow, respectively. Dots mark KorA residues specifically involved in DNA interaction. Sequences corresponding to the HTH or dimerization motifs are enclosed in boxes. (B) The molecular surface of the KorA dimerization region (top view) reveals a patch of highly conserved residues. Side chains of identical and similar residues, as seen in the sequence alignment (A), are highlighted in green and yellow, respectively. Residues of one KorA monomer are labeled with the same color (black or white). (C) Electrostatic surface potential of the KorA dimerization region (top view); positive charge in blue, negative charge in red. Residues possibly involved in protein–protein interactions are labeled in black and white.
Highlighting the preserved region on the exposed molecular surface of KorA reveals a large patch of identical and type-conserved amino acids at the top of the dimer region (Figure 3B). Positioned directly in the center are the exposed hydrophobic side chains of Ile85 and the polar aromatic residues Trp89, His81 and Tyr84 of each monomer (Figure 3C). All four residues are known to favor protein–protein interface locations (35). Together, they create a surface patch which could serve as the site of interaction with KorB, a finding, which is consistent with a recent NMR study that identified Tyr84 as a critical residue for KorA-KorB cooperativity (15). It would seem formally possible that, alternatively, protein interactions would involve the opposite, inner side of the dimerization region which faces the DNA. In KorA, the distance between this inner surface and the DNA helix is large enough to permit further intermolecular interactions, also possible for TrbA, which seems to include a longer linker region, resulting in a considerably increased diameter of its ring-like assembly. KlcB has no predicted DNA-binding ability and therefore retains no ring-like conformation. However, in the KorA structure the exposed residues of the inner side of the dimerization module are Arg73 and Thr75 (Figure 2B). These residues show no conservation in our alignment (Figure 3A). We conclude, therefore, that the outer surface of the dimerization regions of KorA, TrbA and KlcB serves as contact site for the flexible and structurally unknown N-terminal domain of KorB.
DNA-binding domain
In the DNA-binding domain of KorA four compactly folded helices (α1–α4) are arranged around a core of hydrophobic residues, oriented toward the interior of the bundle. Sharp turns between the four helices are mediated by three glycine residues, Gly16, Gly34 and Gly45. Helices α1 and α3 sandwich α2, all three being positioned on one side of α4. The three N-terminal helices are tethered to α4 by van der Waals interactions, stabilizing the relative orientation of the scaffold and recognition helices (α3 and α4) of the HTH motif. Glu12 of α1 forms hydrogen bonds with the C-terminal Lys65 and Asn66 side chains of α4, and also the Thr23 (α2) and Arg57 (α4) side chains are hydrogen bonded.
Structural similarity searches using DALI (36) found no homolog for the full-length KorA. If the search is limited to the DNA-binding unit (residues 2–65) a good resemblance to the YlxM/p13-like family can be found, such as the hypothetical UPF0122 transcription factor SAV1236 from Staphylococcus aureus (PDB entry 1xsv) with a DALI Z-score of 7.7 and an r.m.s. deviation of 2.2 Å. If the search is focused on the DNA recognition region, the orientation of the scaffold and the recognition helix reveal structural homology to the C-terminal σ4 domain of FliA (σ28) from Aquifex aeolicus (1rp3) and to the C-terminal HTH motif of the GerE-like TraR from Agrobacterium tumefaciens (1h0m) with Z-scores of 4.1 and 3.6, and r.m.s. deviations of 1.3 Å and 1.8 Å, respectively. Sigma factors and members of the GerE-like family are key regulators of bacterial transcription; σ4 specifically recognizes the −35 promoter element with its HTH motif.
Orientation of the operator site
The synthetic 18-bp OA* DNA duplex is perfectly symmetric within the 12-bp operator site. The 3 bp on both ends outside the consensus sequence lack in symmetry. They contain three brominated deoxyuridine nucleosides at positions 2, 16 and 17 on the antisense strand (Figure 4A). Upon analyzing the heavy-atom substructure, six bromine sites were detected, permitting to fit the DNA into the electron density in two alternative orientations. After refining the complex with only one orientation present, prominent difference density at the terminal base pairs occurred (Figure 4C). The DNA thus adopts a 2-fold disorder with ∼50% occupancy for each orientation (Figure 4B). The structures of the two oligonucleotides (strands EF and GH) superimpose well with an r.m.s. deviation of 1.068 Å for all atoms, as calculated with LSQKAB (26). Within the symmetric 12-bp operator site the r.m.s. deviation reduces to 0.659 Å for all atoms. In the crystal, the 18-bp oligonucleotides are stacked with negative twist at the junction along the crystallographic b axis, giving rise to a pseudo-continuous double helix (Figure 1C).
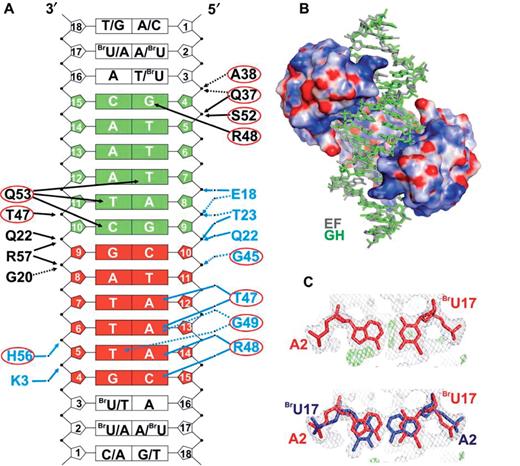
KorA binds its operator binding site. (A) OA* with the central 12-bp consensus operator sequence in red and green. (In OA the BrU bases are replaced by T.) The symmetric operator has two half-sites, each of which binds one KorA monomer in identical geometry. Two different types of protein–DNA interactions are shown in the two half-sites. In the top half-site (green), only direct protein–DNA contacts are shown, whereas water-mediated interactions are shown in the bottom half-site. Both types of interactions occur simultaneously in both half-sites of the operator DNA. Amino acids circled in red are from the HTH motif of KorA. Direct hydrogen-bonded contacts, involving protein side chains and DNA, are indicated by black solid arrows, those between protein backbone and DNA by black dotted arrows. Contacts mediated by water molecules are marked by blue arrows, those between protein side chains and DNA by blue solid lines, and those between protein backbone and DNA by blue dotted lines. (B) Electrostatic surface potential of KorA; positive charge of the protein in blue and negative charge in red. The DNA is bound to the KorA dimer in two orientations with duplexes EF (gray) and GH (green). (C) Two-fold disorder of KorA-bound OA* DNA. Left, base pair A2-BrU17 with electron density before allowing for 2-fold disorder of the KorA-bound DNA. Right, A2-BrU17 base pairs of the superimposed DNA duplexes EF (red) and GH (blue) after refinement. The 2Fo–Fc density (gray) is contoured at 1.0 σ, the Fo–Fc difference density (green) is contoured at 3.0 σ.
The KorA dimer binds to the operator site
KorA binds the 18-mer DNA as a dimer, with each monomer contacting one half-site of the operator fragment. The electrostatic surface potential of the DNA-binding domain reveals a positively charged patch facing the bound DNA (Figure 4B). KorA recognizes the operator sequence specifically through the recognition helix, which is inserted into consecutive major grooves of the operator site, as observed in many prokaryotic HTH-containing proteins. The N-terminus of the recognition helix is imbedded in the major groove making direct base contacts through its side chains. The recognition helix is oriented perpendicular to the helical axis of the DNA and profoundly penetrates into the major groove. The DNA is bent so as to allow full access of KorA side chains into the adjacent major grooves. The position of the recognition helix is stabilized by hydrogen bonds between residues at the N-termini of helices α1–α3 and the sugar-phosphate backbone of the DNA, sealing the major groove above the contact site of the recognition helix. Contacts to the minor groove of the DNA are not observed.
Arg48 and Gln53 are essential for specific DNA binding
In the structure each KorA monomer engages in a total of 27 identical contacts, of which 13 are direct and 14 are water mediated (Figure 4A). The 2-fold disorder of the DNA does not affect protein–DNA interactions, because KorA contacts only the perfectly palindromic 12-bp operator sequence and not the flanking three terminal base pairs, which lack in symmetry.
The specificity of KorA for its OA site is primarily based on two side chain interactions from the recognition helix (α4) reaching deep into the major groove to make several base contacts (Figure 5A, Table 2). The Arg48 side chain binds to the O6 and N7 atoms of G4, and Gln53 contacts the three bases T7 (O4), C10 (N4) and T11 (O4). This is consistent with the finding that the seven KorA operators fall into two classes. Class I operators (korAp, klaAp and trfAp) are perfectly symmetric with KD values of 13–20 nM while class II operators (klcAp, kfrAp, kleAp and kleCp), with more then 10-fold higher KD values, are lacking either G4 (contacted by Arg48) or T7 (contacted by Gln53) in one half-site of the consensus sequence (12). Each specific contact is made to the up- and to the down-oriented DNA duplex with very similar hydrogen bond lengths (Table 2).
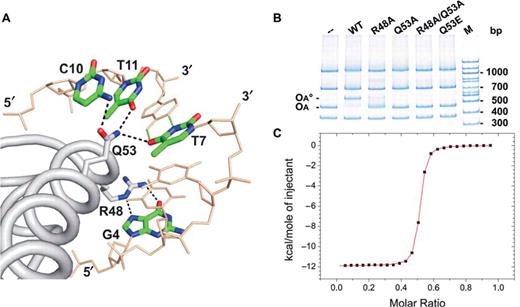
Specific binding of KorA to its operator-binding site. (A) Specific KorA-OA* contacts in the crystal. Arg48 and Gln53 of the recognition helix (α4) of one KorA monomer form specific hydrogen bonds to G4, T7, C10 and T11, in one half-site of the symmetric operator sequence. (B) In vitro binding assay of purified wt KorA and mutants binding to DNA. The 436-bp fragment carries the class I OA site (korAp) of plasmid RP4, the other fragments serve as competitor DNA; 7.5 pmol of wt and each mutant protein were applied. The DNA mixture contained 0.15 pmol of each fragment. OA, DNA fragment containing OA; OA°, complex of OA with wt KorA; M, 100-bp DNA ladder. (C) Calorimetric titration of KorA with 18-bp OA. The panel shows the integrated heat released after correction of dilution (data points, squares) and the curve of best fit (red) for one KorA dimer binding to a single OA site.
Specific binding of Arg48 and Gln53 to OA
| KorA | OA* | Bond lengths (Å)a |
|---|---|---|
| R48 (Nη2) | G4 (O6) | 3.11 ± 0.15 |
| R48 (Nε) | G4 (N7) | 3.08 ± 0.11 |
| Q53 (Oε1) | C10 (N4) | 3.07 ± 0.31 |
| Q53 (Nε2) | T11 (O4) T7 (O4) | 2.92 ± 0.06 2.90 ± 0.17 |
| KorA | OA* | Bond lengths (Å)a |
|---|---|---|
| R48 (Nη2) | G4 (O6) | 3.11 ± 0.15 |
| R48 (Nε) | G4 (N7) | 3.08 ± 0.11 |
| Q53 (Oε1) | C10 (N4) | 3.07 ± 0.31 |
| Q53 (Nε2) | T11 (O4) T7 (O4) | 2.92 ± 0.06 2.90 ± 0.17 |
aCalculated from four different bond lengths derived from contacts of the symmetric KorA dimer to the 2-fold disordered 18-bp OA* DNA.
The importance of specific contacts between KorA and the operator OA is supported by electrophoretic mobility shift assays. Four KorA variants were designed. In two mutants exactly one of the two specific DNA-binding residues was changed to alanine (R48A and Q53A), in a third we replaced both specific binders (R48A/Q53A). According to the binding observed in the crystal structure (Figure 5A), truncation of the Arg48 side chain would remove two hydrogen bonds per operator half-site, and the Q53A mutation would lead to the loss of three hydrogen bonds per half-site. Furthermore, we changed Gln53 to the isosteric Glu53, causing the loss of two out of three hydrogen bonds.
We purified wt and mutants of KorA and tested for binding to a 436-bp DNA duplex containing the class I OA site of korAp (Figure 5B). wt KorA associates specifically with OA, and no retardation was observed with the nonspecific control DNA fragments that do not carry an OA site. The introduction of Q53A, R48A/Q53A and Q53E mutations completely abolished the ability of KorA to bind specifically to OA in all cases. R48A retains reduced capability to shift the operator fragment and shows some nonspecific binding in addition. As a whole, the gel-shift assays strongly suggest that the binding mode observed in the crystal reflects the mode of operator recognition by KorA in solution and identifies Gln53 as the crucial residue for specific operator binding.
To validate the strong binding capacity of wt KorA, we performed ITC-binding studies using the nonbrominated 18-mer duplex OA containing the class I operator sequence. ITC data yielded KD values of 23.3 ± 0.7 nM for KorA:DNA (2:1) binding at 37°C (Figure 5C).
DNA conformation of OA
CURVES 5.3 analysis (37) shows that the DNA in the crystal is smoothly bent by 14° and adopts, essentially, a standard B-DNA form with a mean twist of 33.3° and rise of 3.3 Å per base-pair step. The major grooves are widened from 11 to 15 Å upon insertion of the recognition helix. The binding of the Arg48 side chain to the G4 base is associated with a local overwinding of the DNA helix at the G4-T5/A14-C15 and the T5-T6/A13-A14 base-pair steps (twist values of 36° and 42°, respectively). Similarly, the Gln53 binding to bases T7, C10 and T11 is linked with a slight overwinding of the helix at these base-pair steps (Figure 4A).
DISCUSSION
The expression of RP4 genes is tightly controlled, and reacts very sensitively to fluctuations in repressor levels. During exponential growth of the host there are ∼2000 KorA and 1500 KorB dimers in the cell (12,14) binding to three different classes of operator sites with different affinities. It is not clearly understood, if second- or third-class operators only play a supporting role in this control circuit, and how crucial cooperativity between repressor proteins really is. Interaction between repressor molecules probably increases association rates by helping proteins to locate and bind their operator sites more easily, especially at low protein concentrations. This is important, because KorA or KorB alone might arrest transcription of their own genes at the korAp site (class I) before any of the low-affinity binding sites are bound.
The structure of the KorA–OA* complex shows a remarkable structural complementarity between the repressor's DNA-binding domain and the 12-bp operator-binding site. KorA binds the palindromic DNA symmetrically with its HTH motif. Each monomer contacts the major groove on one half-site of OA. The crystal structure indicates that the KorA dimer is very stable. This is supported by gel filtration and analytical ultracentrifugation experiments where KorA was always found to be dimeric (data not shown).
KorARP4 and KorAR751 (Figure 3A; sequence identity 79%) recognize the exact same operator sequence but prefer binding to their own plasmid-specific OA sites which only differ in the flanking DNA sequences (38). All residues of KorARP4 seen to participate in direct protein–DNA contacts in the crystal structure (Figure 4B) are identical in both proteins except for Arg48, shown above to be important for operator recognition which is a lysine residue in KorAR751. Moreover, His56, involved in water-mediated DNA interactions, is found to be a serine in KorAR751. Mutagenesis of H56S in KorARP4 leads to an increased affinity for all operators, especially for OA/R751 (38). Most likely, both KorA proteins exhibit the same fold. Replacing Arg48 by a long and flexible lysine residue would probably also result in specific recognition of the G4 base within the OA site, but one hydrogen bond will be lost. It seems unlikely, however, that Ser56 could contact the DNA phosphate backbone in the same way as His56. Therefore, the DNA needs to be bent more than seen in our crystal structure, and maybe the flanking sequences of the operator sites, AT-rich in RP4 and GC-rich in R751, are important for the extent of DNA bending. It remains noteworthy that both KorA repressors function only suboptimally on their own plasmids, but equally strong if compared to each other.
The structure of the KorA–OA* complex provides the first view of a global transcriptional regulator of the RP4 plasmid that cooperates with the repressor protein KorB. Our findings reveal how KorA dimerizes and how the KorA dimer specifically contacts its operator site, suggesting a plausible model for the complicated repressor cooperation mechanism in RP4.
On the molecular surface of the KorA dimerization domain we identified a prominent patch of residues favoring protein–protein interactions, which are conserved in RP4 repressor proteins that interact with KorB. The crystal structure of the C-terminal dimerization region of KorB, KorB-C, with interlocking SH3-like domains (aa 299–358) (39), and the DNA-binding domain KorB-O (aa 137–252) (40) are known. The highly flexible N-terminal domain (aa 1–136) could not be crystallized. We propose that KorB contacts KorA via its mobile N-terminus, which could permit repressor–repressor interactions over variable OB–OA distances. The center-to-center distance between the operator sites varies from 32 bp (korAp) to 33 bp (trfAp and klaAp) and 36 bp (kfrAp). Assuming standard B-form, as seen in the KorA and KorB operator complexes, also for the linker DNA, the flexible N-terminal domains of KorB and the interacting surface on the KorA dimerization module are located at nearly opposite sides of the DNA helix in korAp (Figure 6). As the operator sites are moving further apart to 33 or 36 bp in trfAp/klaAp and kfrAp, the helix twist puts the interacting repressor moieties successively on the same side of the DNA, keeping the effective KorB–KorA separation approximately constant. Given the observed flexibility of the KorB N-terminus, this model may explain the cooperation between KorB and KorA at RP4 promoters with variably spaced OB and OA sites and may be a structural template for KorB's interaction with the TrbA repressors and KlcB that share the predicted interaction surface. The reported cooperation between KorA and KorB over a spacing of 92 bp at the kleA promoter is not explained by this model and may require looping of the DNA as suggested by Bingle et al. (13).
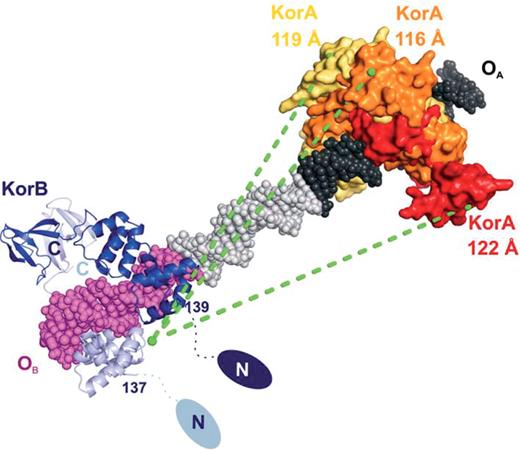
Model for the interaction between KorA and KorB at RP4 promoters. Crystal structures of the RP4 repressor proteins KorA (yellow, orange and red, each representing the molecular surface of one dimer, respectively) and KorB (chain A, blue, and chain B, light blue; PDB entries 1r71 for DNA-binding domain KorB-O, residues 137–252, and 1igu for the C-terminal domain, residues 299–358) (40,39) bound to their operator sites. OA (black) and OB (magenta) were joined by standard B-form DNA (gray), generated with MAKE-NA (http://structure.usc.edu/make-na/) representing the linker region at the korAp site. OA and OB midpoints are separated by 32 bp (KorA = yellow), by 33 bp (trfAp and klaAp, KorA = orange) and by 36 bp (kfrAp, KorA = red). The structurally unknown N-terminal residues 1–136 of each KorB monomer are symbolized by two ellipsoids in blue and light blue. The distances between the KorB N-terminal region and the KorA dimerization domains in their different settings are indicated by green dashed lines.
FUNDING
The Fonds der Chemischen Industrie. Funding for open access charge: Max Delbrück Center for Molecular Medicine, Berlin-Buch.
Conflict of interest statement. None declared.
ACKNOWLEDGEMENTS
We thank F. Skole and M. Terne for technical assistance, E.-C. Müller and A. Otto for mass spectrometry, J. Behlke (all Max-Delbrück Center, Berlin) for analytical ultracentrifugation, S. Keller and group (Research Institute for Molecular Pharmacology, Berlin) for useful discussions and help with the ITC experiment, and the staff at BESSY, Berlin, for beamline support.

Comments