


Abstract
Transcriptional regulation by transcriptional regulatory factors (TRFs) of their target TRF genes is central to the control of gene expression. To study a static multi-tiered inter-TRF regulatory network in the human hepatoma cells, we have applied a Matrix RNAi approach in which siRNA knockdown and quantitative RT-PCR are used in combination on the same set of TRFs to determine their interdependencies. This approach focusing on several liver-enriched TRF families, each of which consists of structurally homologous members, revealed many significant regulatory relationships. These include the cross-talks between hepatocyte nuclear factors (HNFs) and the other TRF groups such as CCAAT/enhancer-binding proteins (CEBPs), retinoic acid receptors (RARs), retinoid receptors (RXRs) and RAR-related orphan receptors (RORs), which play key regulatory functions in human hepatocytes and liver. In addition, various multi-component regulatory motifs, which make up the complex inter-TRF regulatory network, were identified. A large part of the regulatory edges identified by the Matrix RNAi approach could be confirmed by chromatin immunoprecipitation. The resultant significant edges enabled us to depict the inter-TRF TRN forming an apparent regulatory hierarchy of (FOXA1, RXRA) → TCF1 → (HNF4A, ONECUT1) → (RORC, CEBPA) as the main streamline.
INTRODUCTION
Gene expression is primarily controlled at a transcriptional level through physical interactions between transcriptional regulatory factors (TRFs) and their cognate binding regions ( cis -regulatory modules) on their target genes ( 1–3 ). Identification of regulatory edges between TRFs is vital to unravel a functional transcriptional regulatory network (TRN) relevant to the biological event in question ( 4 ). Edges between a TRF and its targets under given conditions can be explored by multiple approaches. For example, time-course analysis of expression profiles ( 5 ), expression analysis before and after perturbation by genetic disruption, typically RNAi knockdown with a target-specific siRNA ( 6 ) or gene knockout ( 7 , 8 ), detection of the physical binding between a TRF and its cis-regulatory DNA sequences by cross-linking chromatin immunoprecipitation (X-ChIP) ( 1 , 2 ) have all been used to deduce TRF-target edges.
We previously found that RNAi knockdown of a TRF gene (mouse Tcf2) caused significant perturbations of expression of a number of genes including several downstream TRF genes ( 9 ). This drove us to apply RNAi knockdown to explore an inter-TRF TRN consisting of various TRFs and their genes as nodes and their regulatory interactions as edges.
The RNAi-based systematic gene knockdown has been primarily employed to screen a variety of genes in question, for example, longevity genes ( 10 ) and genes related to growth and viability ( 11 ), in lower model animals such as the nematode Caenorhabditis elegans and the fly Drosophila melanogaster under the favour of high knockdown efficiencies and feasible screening. Genome-wide siRNA transfection screening was also used to search for human kinases required for endocytosis ( 12 , 13 ) and monitor cell viability in HeLa cells ( 14 ).
As for TRN analysis, systematic RNAi has been used to define lineage-specific regulatory networks in C. elegans ( 15 , 16 ). The use of systematic RNAi perturbation of multiple TRF genes in TRN analysis has several advantages. First, RNAi knockdown targeting a specific TRF gene induces directional regulatory responses in perturbation of the immediate downstream TRF genes, enabling us to pursue the directly regulated TRF genes, decreasing the noise in identifying real regulatory edges. Second, acute ablation by RNAi could bypass compensatory mechanisms, especially relevant for examining functionally redundant TRF families ( 17 ). Because of the expected higher redundancy of TRF families in human being, the application of a systematic RNAi knockdown to the analysis of TRNs in human cells is highly challenging as compared with those in lower animals. The systematic perturbation of TRF genes by knockdown of a set of TRFs with siRNAs aiming at TRN analysis is named Matrix RNAi here.
In this study, as a model for the Matrix RNAi-based investigation of an inter-TRF TRN, we focused on the human hepatoma cell line HepG2 in which several known liver-enriched TRFs showing high redundancy are suggested and partly demonstrated to play key roles in the regulation of hepatic functions and maintenance of homeostasis ( 18–20 ). Extensive studies of the hepatic TRN focused on several specific TRFs have been made and the network circuitry was demonstrated ( 21 , 22 ), but the overall regulatory interrelationships among these liver-enriched TRF family members remain to be elucidated. In this report, we show the successful application of Matrix RNAi approach to identification of a complex inter TRF-TRN consisting of a number of redundant family members. We also found novel cross-talks among the liver-enriched TRF families and a clear hierarchical assembly of the network cascades in the human hepatoma cells.
MATERIALS AND METHODS
siRNA
Stealth siRNAs designed by Invitrogen were used for RNAi knockdown of TRF genes. Two kinds of stealth siRNA were tested for their RNAi activities against each target gene and the one that gave a higher level of knockdown was selected to be used for Matrix RNAi. Selected siRNAs were described in Supplementary Table 1 . Negative control 2 (Ambion Inc., Austin, Texas, USA) was used as the calibrator siRNA.
Cell culturing, transfection and RNA extraction
HepG2 cells (HSRRB JCRB1054) were cultured in minimum essential medium (Eagle) with 1 mM sodium pyruvate and 10% FBS in 5% CO 2 at 37°C. Reverse transfection was performed with 10 nM (final concentration) of each stealth siRNA, Opti-MEM (Invitrogen, Carlsbad, CA, USA) and Lipofectamine 2000 (Invitrogen), according to the manufacturer's instructions. RNAs were extracted 48 h after transfection with NucleoSpin (Macherey-Nagel, GmbH & Co. KG, Düren, Germany), according to the manufacturer's instructions. RNA was quantified with NanoDrop (NanoDrop Technologies, Wilmington, DE, USA).
qRT-PCR
Expression levels of TRF genes both in the cells treated with the specific siRNA targeting a TRF and with the calibrator negative control siRNA were estimated by qRT-PCR in triplicate with each of the specific primer sets ( Supplementary Table 2 ) and each of the RNA samples extracted. Glyceraldehyde-3-phosphate dehydrogenase (GAPDH) mRNA level was determined with a specific primer set (5′-GAAGGTGAAGGTCGGAGT-3′ and 5′-GAAGATGGTGATGGGATTTC-3′). A total of four biological replicates were assayed. Reverse transcription reaction was performed with ExScript RT-PCR Kit (Perfect Real Time, TAKARA BIO) and GeneAmp PCR System 9700 (Applied Biosystems, Foster City, CA, USA), according to the manufacturer's instructions. Quantitative PCR reaction was done in 10 μl reaction mixture with SYBR Premix Ex Taq™ (Perfect Real Time) (TAKARA BIO) on an ABI 7500 Fast real-time PCR system (Applied Biosystems). PCR parameters consisted of heating at 94°C for 5 s, followed by 40 cycles of 94°C for 5 s and 62.5°C for 20 s. The relative amount (expression ratio) of the target gene mRNA was normalized to the endogenous GAPDH mRNA using the ΔΔC T method ( 23 ). The difference in the threshold cycle of sample [ΔC T (sample)] was measured by subtracting the threshold cycle of GAPDH mRNA from that of the target TRF mRNA in the RNA samples extracted from HepG2 cells transfected with the target TRF-specific siRNA. The difference in the threshold cycle of calibrator [ΔC T (calibrator)] was measured by subtracting the threshold cycle of GAPDH mRNA from that of the target TRF mRNA in the RNA samples extracted from HepG2 cells transfected with negative-control siRNA. ΔΔC T was calculated by subtracting ΔC T (sample) from ΔC T (calibrator) and used for the calculation of expression ratio. Standard deviation (SD) of ΔΔC T in four biological replicates was calculated, and the cut-off value was arbitrarily defined as 2 SD above the mean. Perturbation fold was calculated by dividing 1.0 by the average expression ratio when it is smaller than 1.0. When the expression ratio exceeded 1.0, it represented the perturbation fold. To evaluate the interferon response that might be induced by siRNA administration, we examined the levels of expression of several interferon-responsive genes such as OAS1 and PKR genes. However, no significant changes in their expressions were detected.
Search for the potential TRF-binding sites
The upstream regions (5.5 kb) extending from –5000 bp to + 500 bp relative to the transcription start sites (TSSs) of the 21 liver-enriched TRF genes were extracted from ENSEMBL database. DNA sequences homologous to the recognition sequences characterized for each of the 19 TRFs used for Matrix RNAi were searched with specific matrix identifiers ( Supplementary Table 3 ) of match program ( 24 ) in Transfac 10.4 (Biobase Biological Databases, GmbH). The cut-off to minimize false-positive matches (minFP) was applied for searching the DNA sequences.
TRF-binding assay by X-ChIP/qPCR
The procedures for X-ChIP were essentially as described previously ( 9 , 22 , 25 ) with some modifications. The soluble chromatin prepared from 1 × 10 7 cells was incubated with anti-TCF1, FOXA1, FOXA2, HNF4A, ONECUT1 or RXRA-specific antibody (sc-6547, sc-22841, sc-9187, sc-6556, sc-13050 and sc-553, respectively; Santa Cruz Biotechnology, Santa Cruz, CA) for more than 12 h at 4°C. The chromatin–antibody mixture was incubated with Dynabeads Protein G (Dynal Biotech, Oslo, Norway) for 1 h at 4°C and the immunoprecipitates were captured by using magnets. The immunoprecipitates recovered were washed once with IP wash buffer low (2 mM EDTA, 20 mM Tris–HCl pH 8.0, 150 mM NaCl, 1% Triton X-100, 0.1% SDS), once with IP wash buffer high (2 mM EDTA, 20 mM Tris–HCl pH 8.0, 500 mM NaCl, 1% Triton X-100, 0.1% SDS), once with IP wash buffer LiCl (1 mM EDTA, 10 mM Tris–HCl pH 8.0, 250 mM LiCl, 0.5% NP-40, 0.5% sodium deoxycholate) and twice with TE buffer (10 mM Tris–HCl pH 8.0, 1 mM EDTA). The washed protein–DNA complexes were released from Dynabeads Protein G twice with Elution Buffer (100 mM Sodium bicarbonate, 1% SDS). NaCl was added to the protein–DNA complexes for adjusting the final concentration of 20 mM; then the mixture was incubated at 65°C for 3.5 h for reversal of formaldehyde-induced cross-linking and treated with 0.05 mg/ml RNase A (Nippon Gene, Tokyo, Japan) at 65°C for 30 min. After the addition of Tris–HCl (pH 6.8) and EDTA (pH 8.0) to final concentrations of 40 mM and 10 mM, respectively, the reversed samples were treated with 0.25 mg/ml protease K (Nippon Gene) at 45°C for 1 h. DNA released was then extracted with phenol and phenol:chloroform:isoamylalcohol (25:24:1), isopropanol precipitated with Ethachinmate (Nippon Gene), and then dissolved in 100 µl of H 2 O. DNA obtained by ChIP with specific antibody, prepared from the precipitates without any antibody and input DNA (total chromatin DNA) were used as templates for qPCR assay. The procedures of qPCR were essentially the same as those described in the section of qRT-PCR. Enrichment of the target DNA fragments was assessed by subtraction of the C T values observed for the ChIP samples with specific antibody from the C T s observed without any antibody (ΔC T ). Sequences of the primers used for ChIP/qPCR were described at Supplementary Table 4 .
ChIP experiments were performed in triplicate with each different batch of cell pellets, and qPCRs were performed triplicate with each primer set and each chromatin sample. The ΔC T values obtained were averaged for each of the TRF–TRF gene-edge pairs and the edge pairs that gave ΔC T values less than twice of SD values and high P -values (> 0.05) were excluded from the binding analysis. The antibodies used for the ChIP of FOXA1 and ONECUT1 showed lower degrees of specific target DNA enrichment as compared to others (TCF1, FOXA2, HNF4A and RXRA). For evaluation of DNA fragment enrichment in the experiments, we set the threshold to 1.0 ΔC T and P -value of 0.05.
Statistics
To evaluate the significance of RNAi knockdowns, perturbations and enrichment of the specific DNA fragments that were bound by each of the TRF proteins, a two-tailed Student's t -test was used for generating P -values.
RESULTS
Expression levels of the selected liver-enriched TRFs and evaluation of their RNAi knockdown
Human liver-enriched TRFs used in Matrix RNAi are as follows: HNF1A (TCF1), HNF1B (TCF2), HNF3A (FOXA1), HNF3B (FOXA2), HNF3G (FOXA3), HNF4A, HNF4G, HNF6A (ONECUT1), CEBPA, CEBPB, CEBPD, PPARA, PPARD, PPARG, RARA, RARB, RARG, RXRA, RXRB, RXRG, RORA and RORC. TCF1 and TCF2 share identical DNA-binding domains but exhibit distinct transcriptional regulatory properties ( 26 , 27 ). FOXA1, FOXA2 and FOXA3 share strong homology in their winged-helix/forkhead DNA-binding domains and can recognize the same target DNA sequence, but their known roles in transcriptional regulation of liver-specific genes are distinct from each other ( 19 ). HNF4A is essential for hepatic gene expression ( 28 ) but the function of the structural homolog HNF4G, approximately 70% homologous to HNF4A ( 29 ), is unclear. ONECUT1 regulates genes coding for enzymes involved in glucose metabolism ( 30 ) as well as HNF4 and FOXA2 genes ( 31 ). The interrelationships among TCF1, FOXA2, HNF4A and ONECUT1 have been examined by location analysis ( 21 , 22 ). C/EBP family members (CEBPA, B and D), which are highly homologous to each other in their DNA-binding basic leucine zipper regions, are also essential for liver function ( 18 ). Nuclear receptors are key regulators of lipid and glucose homeostasis in liver ( 32 ). Peroxisome proliferator-activated receptors (PPAR; NR1C) A, D and G regulate genes involved in lipid metabolism and glucose homeostasis in various tissues including liver ( 32 ). These three PPAR subtypes share a highly homologous DNA-binding domain (80% identical), whereas their ligand-binding domains exhibit a lower degree of identity ( 33 ). Retinoic acid receptor (RAR; NR1B) A, B and G, and retinoid X receptors (RXR; NR2B) A, B and G mediate a variety of biological effects of retinoids through binding, as homodimers and/or heterodimers, to specific sequences in the promoters of target genes ( 34 ). RARs share highly homologous DNA- and retinoic acid-binding domains ( 35 ). The RXRs, which also exhibit structural homology, regulate common target sequences and respond to common ligands ( 36 ). RAR-related orphan receptors (ROR; NR1F) A and C share 50% sequence identity ( 37 ) and are suggested to play important roles in the control of metabolic homeostasis in liver ( 38 ).
We first examined the expression levels of the above-described 22 liver-enriched TRF genes in HepG2 cells cultured normally and found that all but RXRG gene were significantly expressed in HepG2 cells. We then evaluated RNAi knockdown of these 21 TRF genes 48 h after transfection of the respective specific siRNAs using quantitative real-time RT-PCR (qRT-PCR). The 48 h time point was chosen because RNA levels of both the TRF and its direct target genes tend to reach minimum 36–48 h after siRNA transfection (see ref. 8 for the typical example).
Chemically modified siRNAs (Stealth siRNAs; Supplementary Table 1 ) were used for RNAi knockdown of HepG2 TRF genes. Although we attempted knockdowns of CEBPB and RARB, no highly effective siRNAs against these TRF genes were obtained. Therefore, we investigated perturbation of expressions of the 21 TRF genes by siRNA-mediated knockdown of the 19 TRF genes in the present Matrix RNAi analysis. The siRNA-induced changes in expression levels of the 21 TRF genes were quantified by qRT-PCR with specific primer sets ( Supplementary Table 2 ). Ten nanomolar siRNAs were sufficient to cause more than 70% knockdown against all TRF genes but RARA gene (60.3% knockdown) ( Figure 1 ).

RNAi knockdown of 19 TRF genes in HepG2 cells. Knockdown ratio was calculated according to the ΔΔC T method ( 23 ) and the averages of the ΔΔC T values in four biological replicates are indicated with SD (error bar).
Matrix RNAi and perturbation of each TRF gene
RNAi knockdown of each TRF gene resulted in significant expression perturbation of different sets of TRF genes ( Table 1 for an inter-HNFs matrix and Supplementary Table 5 for the entire data, respectively). RNAi knockdown and perturbation were evaluated as follows by the conventional comparative threshold cycle (C T ) method (ΔΔC T method) ( 23 ). ΔΔC T was calculated by subtracting ΔC T (sample) from ΔC T (calibrator) (see qRT-PCR in Materials and methods section). We filtered the perturbation data according to two criteria, SD and P -value of the ΔΔC T for each edge. The edges exhibiting mean ΔΔC T smaller or larger than 2 SD and P -values higher or lower than 0.05 were divided into two separate groups consisting of 295 non-significant and 85 significant edges. When we plotted these edges according to their ΔΔC T values, the two separate groups showed distinct distribution patterns ( Figure 2 ). The non-significant group consisting of the edges that exhibited high SD and/or P -values was found to be the population that mainly consisted of the edges whose ΔΔC T values were low and peaked at 0.4-0.5 ΔΔC T (average ΔΔC T 0.471; Figure 3 ). By contrast, another group (significant group) of the edges that exhibited low SD and P -values were peaked around at high ΔΔC T (1.1 ∼ 1.2) and the average ΔΔC T was approximately 1.263 ( Figure 3 ). A total of 85 significant edges consisted of 63 downregulated and 22 upregulated ones.

Distribution of perturbation magnitudes between significant and non-significant edges. The 85 edges showed a low SD (mean > 2 SD) and a low P -value ( P < 0.05) in Student's t -test were selected as significant edge candidates. The remaining 295 edges, except 19 autoregulatory edges, were grouped together as non-significant edges. The edges in each group were divided according to their perturbation magnitudes, which were represented by absolute ΔΔC T , in every 0.2 absolute ΔΔC T and the percentages of the number of edges in each fraction to the total number of the edges were plotted. Perturbation magnitude was calculated on the basis of the data of qRT-PCR assay (see qRT-PCR in Materials and Methods section for details). White bars represent the percentage of the number of significant edges and black bars are for non-significant edges.
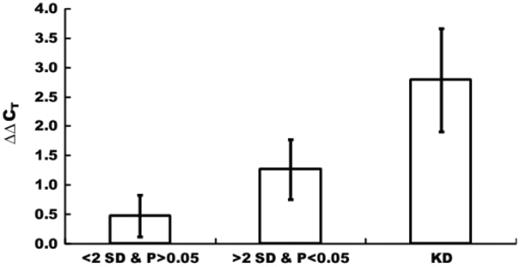
Magnitude of perturbation for high and low SD and P -value groups. The edges exhibiting a mean ΔΔC T smaller or larger than 2 SD and a P -value higher or lower than 0.05 were divided into two separate groups consisting of 85 significant and 295 non-significant edges. Mean and SD values of ΔΔC T s of high (<2 SD and P > 0.05) and low (>2 SD and P < 0.05) SD and P -value groups were calculated. ΔΔC T values for knockdown (KD) of the TRF genes are much larger than perturbation magnitudes, indicating that the influences of KD of TRF genes on their downstream TRF genes tend to attenuate.
Matrix RNAi among HNFs
| Perturbed TRF genes | Knocked down TRF gene | ||||||||
|---|---|---|---|---|---|---|---|---|---|
| TCF1 | TCF2 | FOXA1 | FOXA2 | FOXA3 | HNF4A | HNF4G | ONECUT1 | ||
| TCF1 | ΔΔCT | –2.6208333 | –0.4641667 | –1.3508333 | –0.67 | –1.0008333 | –0.9491667 | –0.865 | –1.47625 |
| ΔΔCT SD | 0.2166392 | 0.3597254 | 0.364969 | 0.2155686 | 0.2728902 | 0.2039744 | 0.3655958 | 0.5987373 | |
| P -value | 5.83E–07 | 0.038143 | 0.0004084 | 0.0057176 | 0.0001371 | 0.0010823 | 0.0024617 | 0.017984 | |
| TCF2 | ΔΔCT | –1.2591667 | –3.0958333 | –1.0241667 | –0.4608333 | 0.0908333 | –0.21 | –0.3291667 | –0.9295833 |
| ΔΔCT SD | 0.3568102 | 0.5012421 | 0.3536914 | 0.2335968 | 0.1490153 | 0.2488322 | 0.4580488 | 0.8778892 | |
| P -value | 0.0005702 | 3.304E–05 | 0.0194871 | 0.2262878 | 0.747752 | 0.5046373 | 0.2364003 | 0.1433739 | |
| FOXA1 | ΔΔCT | –0.875 | 0.8333333 | –2.8466667 | –0.06 | –0.285 | –0.2558333 | 0.1216667 | –0.3483333 |
| ΔΔCT SD | 0.4781014 | 0.3389995 | 0.3731717 | 0.4891846 | 0.776543 | 0.7088416 | 0.4074505 | 1.0545216 | |
| P -value | 0.0066018 | 0.0044526 | 1.261E–05 | 0.8042594 | 0.4843524 | 0.4454617 | 0.5590495 | 0.4865551 | |
| FOXA2 | ΔΔCT | –0.9733333 | –0.2275 | –0.5408333 | –2.0508333 | –0.8491667 | –0.5416667 | 0.2816667 | –0.38625 |
| ΔΔCT SD | 0.3805009 | 0.5449734 | 0.3656555 | 0.6575634 | 0.8432209 | 0.7664658 | 0.6226645 | 0.6472584 | |
| P -value | 0.0092891 | 0.4924436 | 0.1712209 | 0.0009421 | 0.0578368 | 0.2080605 | 0.420319 | 0.5361367 | |
| FOXA3 | ΔΔCT | 0.5058333 | –0.1616667 | –0.9508333 | –1.1141667 | –4.6725 | –0.0908333 | –0.3416667 | –0.9470833 |
| ΔΔCT SD | 0.4289698 | 0.4932207 | 0.5931293 | 0.494027 | 0.5595853 | 0.5556228 | 0.3918171 | 0.3815078 | |
| P -value | 0.3825842 | 0.7652557 | 0.2896109 | 0.1194374 | 0.0004207 | 0.8144588 | 0.2667267 | 0.1582385 | |
| HNF4A | ΔΔCT | –1.24125 | –0.0025 | –0.6975 | –0.3758333 | –0.7408333 | –2.6116667 | –0.2575 | –0.8670833 |
| ΔΔCT SD | 0.1852171 | 0.2156625 | 0.3150951 | 0.2856057 | 0.3782111 | 0.1717603 | 0.3282892 | 0.6722532 | |
| P -value | 3.218E–05 | 0.9831399 | 0.0058856 | 0.031243 | 0.00296 | 1.017E–05 | 0.161717 | 0.0906656 | |
| HNF4G | ΔΔCT | 1.8383333 | 0.4266667 | 0.9883333 | 0.3075 | 0.9508333 | 1.5033333 | –1.9116667 | 0.59625 |
| ΔΔCT SD | 0.5398501 | 0.4613782 | 0.3567134 | 0.3026379 | 0.3312446 | 0.2381943 | 0.5630444 | 0.4410708 | |
| P -value | 0.0048796 | 0.1195892 | 0.0099967 | 0.1646301 | 0.0015777 | 6.017E–05 | 0.0025926 | 0.1667225 | |
| ONECUT1 | ΔΔCT | –2.0233333 | 1.1308333 | –1.3333333 | –0.2558333 | –0.3725 | –0.17 | 0.5225 | –3.4158333 |
| ΔΔCT SD | 0.2820222 | 0.475604 | 0.4150655 | 0.1899603 | 0.381325 | 0.3294729 | 0.339382 | 0.4198365 | |
| P -value | 0.0140675 | 0.0828868 | 0.0137168 | 0.4971287 | 0.2927379 | 0.6868694 | 0.3131551 | 0.0029555 | |
HepG2 cells were transfected with an individual siRNA species against each of the TRF genes. The total RNA was extracted 48 h after the transfection and used for qRT-PCR. The changes in expression levels (perturbations) were evaluated by ΔΔC T calculated according to the method described by Livak et al. [Livak, K.J. and Schmittgen, T.D. Methods, 25 , 402–408 (2001)].
Tetraplicated experiments were carried out to obtain the average ΔΔC T , SD and P -value. Only the edges that provided low SD and P -value were used for drawing a putative perturbation network in Figures 5, 8 and Supplementary Figure 1 .
Assessment of off-target effects on Matrix RNAi-based TRN analysis
It has been known that siRNAs with only partial complementarity to mRNAs can also cause a reduction in the RNA levels (39−43). Because unintended siRNA-mediated gene silencing (off-target effects) could occur to affect the robustness of the analysis of specific transcriptional regulation by each TRF, we assessed the probability of such interfering effects. For this purpose, we knocked down each of the three selected TRFs (FOXA1, ONECUT1 and RXRA) with two discrete siRNAs that targeted different sites in each of the TRF mRNAs. The RNAi knockdown of each of the target TRF genes and the perturbation of their downstream TRF genes would be expected to be well correlated if each of the two siRNA species used would be specific to each target TRF gene. We used Stealth siRNAs (Invitrogen) for the present Matrix RNAi knockdown of liver-enriched TRF genes. Stealth siRNAs are designed to minimize the off-target effects and interferon responses by introducing the modified nucleotides in the passenger strand interfering it from being incorporated into RISC to function as well as by selecting a nucleotide sequence of minimum homology to any other stretches in the human genome and transcriptome.
Comparison of the perturbation patterns of the 21 TRF genes examined in the present study revealed high correlations (Pearson's product–moment correlation coefficients 0.86, 0.94 and 0.93 for FOXA1, ONECUT1 and RXRA, respectively) among the perturbation patterns by the two different siRNAs for each of the three TRFs ( Figure 4 and Supplementary Table 6 ). These results suggest that there are no evident off-target effects within these 21 genes enabling us to use the data for depicting a perturbation network in the human hepatoma cells.
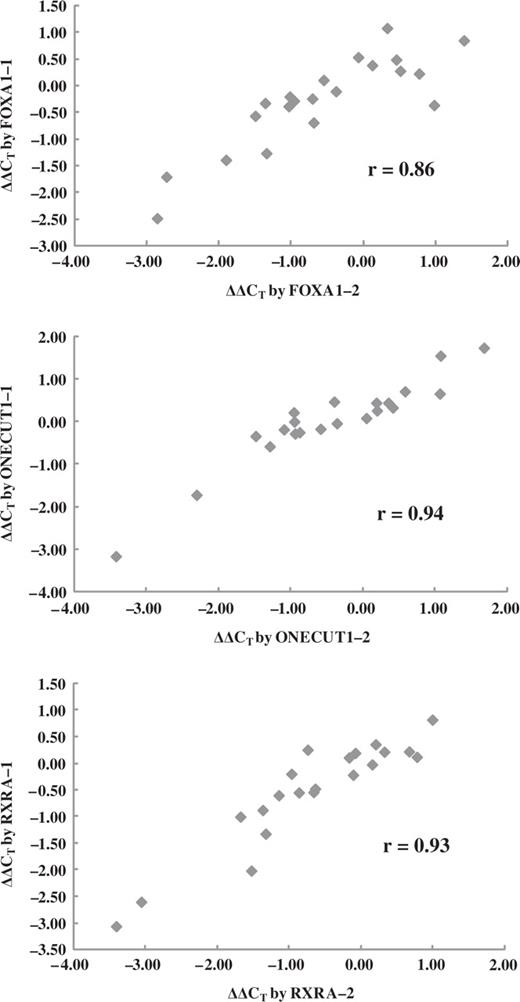
Perturbation of the TRF gene expression by two different siRNA species. Each of the three TRF genes was individually knocked down in HepG2 cells by either of the two different siRNAs specific to each of them, and changes in expression levels of 21 TRF genes were measured by qRT-PCR. The average ΔΔC T , SD and P values were obtained from triplicated experiments. Correlation coefficients were calculated on the basis of average ΔΔC T values.
Perturbation network
RNAi knockdown experiments revealed a regulatory pattern characteristic to each of the TRFs and TRF genes ( Table 1 for an inter-HNFs matrix and Supplementary Table 5 for the entire data, respectively). When TCF2 or RARA was individually knocked down, upregulation of various TRF genes was induced in the HepG2 cells. In contrast, knockdown of TCF1, FOXA1, FOXA3, CEBPD, PPARA, RXRA, RXRB, RORA and RORC was biased towards downregulation of their potential downstream TRF genes. PPARG, RARB, RARG, RORA and, most typically, HNF4G genes are in almost all cases upregulated by knockdown of any of the corresponding TRF genes. By contrast, TCF1, TCF2, FOXA2, HNF4A, ONECUT1, CEBPA, PPARD, RXRA, RXRB and RORC genes are almost exclusively downregulated by knockdown of each of several TRFs. Perturbation of a TRF gene by RNAi can lead to expression changes of its direct (immediate downstream) and indirect target genes; therefore, a putative regulatory network inferred by perturbation analysis data provides a powerful guide for the subsequent investigation of the real TRN similar to the way that TRF binding (ChIP) analysis has demonstrated ( 21 , 22 ).
Perturbation network depicted based on the Matrix RNAi data ( Figure 5 for inter-HNFs and Supplementary Figure 1 for the entire perturbation matrices, respectively) showed TCF1, ONECUT1, HNF4A and RXRA represent key hubs to emit multiple outputting regulatory signals and accept multiple inputting ones in the static HepG2 TRN. RXRA predominantly functions as a multiple outputting node and conversely RORC, CEBPA and HNF4G receive regulatory information from a lot of TRFs. Besides RORC, CEBPA and HNF4G, two PPARs (PPARG and PPARD) appear to be peripherally located because these TRF genes exclusively function as acceptors and, by contrast, PPARA primarily functions as an outputting node and thus appears to be epistatic in this perturbation network. PPAR and RAR families seem less related to other TRF families as compared with inter HNFs, RXR and ROR families, significantly connected to each other.

Perturbation network among HNFs. For depiction of the putative network, only significant edges (>2 SD and P < 0.05) among HNFs (TCF1, TCF2, FOXA1, FOXA2, FOXA3, HNF4A, HNF4G and ONECUT1) were extracted on the basis of Matrix RNAi data ( Table 1 ). The network graph was drawn by Cytoscape ( 50 ). In this graph, TRFs and TRF genes regulated by them are not distinguished from each other, but the nodes emitting and accepting an arrow represent the putative regulators and regulated genes, respectively.
Demonstration of directional regulatory relationships in the perturbation network
The directional regulatory relationships between the TRFs and their target TRF genes as well as their autoregulation can be strongly supported by integrating the data of RNAi knockdown and perturbation with that of binding analysis by using X-ChIP/quantitative real-time PCR (X-ChIP/qPCR) ( 44 ). To evaluate our present Matrix RNAi approach for probing the transcriptional regulatory edges, we selected 6 TRFs (TCF1, FOXA1, FOXA2, HNF4A, ONECUT1 and RXRA) and performed X-ChIP/qPCR analysis of their regulatory edges. Searching the upstream regions (from –5000 bp to +500 bp around the respective TSSs) of the Matrix RNAi members confirmed that 67% of the perturbation-positive edges contained potential binding sequences for each of the targeting TRFs (see Supplementary Table 3 for the matrix identifiers).
Three distinct DNA regions of approximately 500 bp in length, which were located around 500, 1000 and 1500 bp (1000, 1500 and 2000 bp only in the case of the CEBPA gene) from the TSS of each of the 21 TRF genes examined, were amplified from the chromatin of the unperturbed HepG2 cells with specific primer sets ( Supplementary Table 4 ). The threshold cycle (C T )-values of the specific DNA regions derived from the immunoprecipitates recovered with or without the TRF-specific antibodies were determined and the differences among them (ΔC T ) were measured for evaluation of enrichment of specific DNA regions. The data showing high SD values, i.e. ΔC T < 2 SD, in three separate X-ChIP/qPCR experiments were excluded from the evaluation of edges. We set the thresholds of positive TRF binding to ΔC T = 1.0 corresponding to 2-fold enrichment of the TRF-specific DNA fragments and P = 0.05 in Student's t -test ( Supplementary Table 7 ).
X-ChIP/qPCR analysis detected a total of 73 edges for physical TRF–TRF gene interactions besides their self-interactions ( Figure 6 ). Interestingly, bindings of all TRFs examined to the upstream region of their own genes were demonstrated, indicating their autoregulation. Odom et al. also reported the transcriptional regulatory circuitry, in the human hepatocyte, which contained TCF1, FOXA2, HNF4A and ONECUT1 on the basis of TRF–TRF gene binding assays ( 21 ).

X-ChIP/qPCR analysis of six selected TRFs. TRF–TRF gene binding analysis was performed for six TRFs (TCF1, FOXA1, FOXA2, HNF4A, ONECUT1 and RXRA) by using the chromatin samples prepared from the siRNA-untreated HepG2 cells. Enrichment of the specific DNA fragments that are bound by a TRF is indicated by ΔC T (difference in the C T values observed for the ChIP samples with specific antibody and those observed without any antibody; see TRF binding assay by X-ChIP/qPCR in Materials and methods section for details). Error bars represent the SD between three separate experiments. Only the TRF genes exhibited the enrichment threshold (ΔC T >1.0, mean > 2 SD and P < 0.05) are shown. Black bars indicate autoregulatory edges.
Integration of perturbation and ChIP data for the analysis of the inter-TRF TRN
The edges whose TRF gene bindings were demonstrated included 30 perturbation-positive edges, making up more than 41% of the 73 edges deduced by the perturbation analysis with six TRFs that were tested by both Matrix RNAi and X-ChIP/qPCR ( Figure 7 ). On the other hand, binding-positive edges constitute 75% (30 in 40 edges) of the perturbation-positive edges. The high concordance between the perturbation and chromatin binding suggests that the Matrix RNAi approach is highly effective in identifying real edges between TRFs.
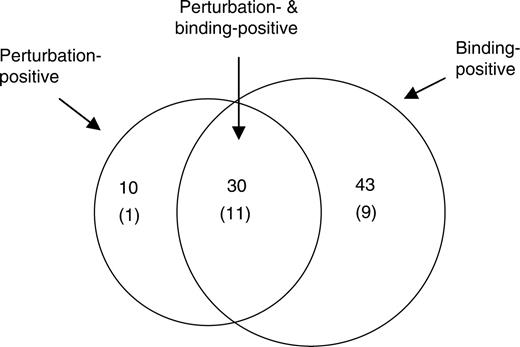
Correlation between TRF binding- and perturbation-positive edges. A total of 40 regulatory edges that showed a perturbation with a low 2 SD value and a low P -value (<0.05) targeted by any of the six TRFs whose chromatin bindings were examined and were selected to determine the correlation with TRF–TRF gene interaction. Binding-positive 73 TRF edges that showed more than 1.0 of the enrichment index ΔC T with a low 2 SD value and P < 0.05 in Student's t -test were also selected. Autoregulatory edges are not included in this figure because Matrix RNAi cannot identify them through perturbation. Numbers in parentheses indicate the edges that have been reported in literature ( Supplementary Table 8 ).
By using these identified significant edges, we depicted the inter-TRF TRN in HepG2 cells ( Figure 8 ). Thick lines in Figure 8 are the set of finally validated 30 edges (25 downregulated and 5 upregulated) and comprise a static inter-TRF TRN in HepG2 cells. Figure 8 indicates that TCF1 and FOXA1 share a common set of regulated TRF genes (RORC, HNF4A, TCF2, ONECUT1, CEBPA, HNF4G and RXRA (suggested by only perturbation data). There is a negative feedback loop of FOXA1 → TCF1 → TCF2 ⊣ FOXA1. Various reciprocal regulations were also found between TCF1 and FOXA2, HNF4A, ONECUT1, RXRA as well as between FOXA1 and RXRA or RXRA and ONECUT1. Moreover, several regulatory circuitries were also found, for example, FOXA1 → TCF1 → RXRA → FOXA1, RXRA → TCF1 → ONECUT1 → RXRA, and TCF1 → RXRA → FOXA1 → HNF4A → TCF1. These molecular regulatory patterns characterize the static inter-TRF TRN in the human hepatoma cells. Figure 9 shows the outline of the strategy of Matrix RNAi-based inter-TRF TRN analysis used in the present investigation.
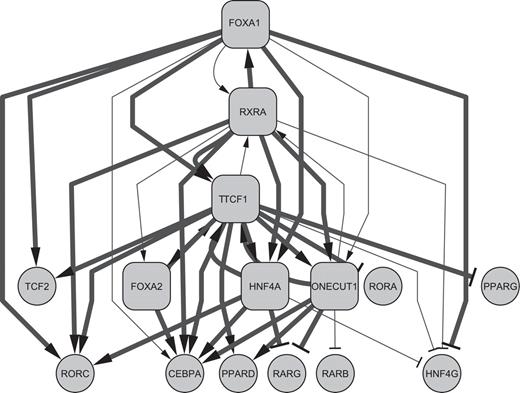
A highly probable static inter-TRF TRN in HepG2 cells. The edges presented were identified by Matrix RNAi perturbation. Highly significant edges confirmed by X-ChIP/qPCR are drawn in thick lines. Rhombus boxes represent TRFs that were tested in X-ChIP/qPCR. TRFs lacking a significant binding data are excluded from this figure. Autoregulation of all of these six TRFs was demonstrated but not drawn for clarity. Lines with arrowheads and T-shaped termini show positive and negative regulatory edges, respectively.
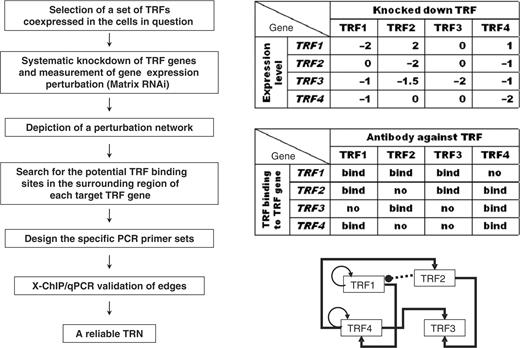
Strategy flow of matrix RNAi-based TRN analysis. (Left) The experimental flow chart, (right) top, example of matrix RNAi results; middle, example of TRF binding results; bottom, example of the validated TRN (TRF1 and TRF4 are autoregulated; black arrows indicate a positive regulatory edge, and the dashed line with a black circle from TRF2 to TRF1 indicates negative regulation.
DISCUSSION
The results obtained from this study suggest several aspects of a static inter-TRF TRN of the human hepatoma cells. ( 1 ) Most TRF genes were regulated by multiple TRFs either directly or even indirectly. In particular, TCF1, CEBPA ad RORC genes are downregulated upon knockdown of each of more than 10 TRFs, raising the possibility of their prominent combinatorial regulation. ( 2 ) Most of the genes regulated directly by a TRF are significantly downregulated upon knockdown of the regulator. ( 3 ) The TRN depicted is highly nested and complicated by multiple inputs and outputs, autoregulatory nodes, reciprocal regulatory edges, regulatory circuitries and either positive or negative regulatory edges. Therefore, it is hard to find simple transcriptional regulatory cascades. ( 4 ) There are a few hubs with key roles in the TRN. ( 5 ) Individual members of each of the TRF families play different roles in the static HepG2 TRN irrespective of their structural homologies. ( 6 ) The inter-TRF TRN depicted reveals cross-talks between HNFs and C/EBPs, PPARs, RARs, RXRs and orphan receptor RORs. ( 7 ) An apparent regulatory hierarchy of (FOXA1, RXRA) → TCF1 → (HNF4A, ONECUT1) → (RORC, CEBPA) constitutes the main streamline in the inter-TRF TRN.
The Matrix RNAi has already been proved to be very useful to identify the TRFs and the regulatory regions of their target genes that are involved in a combinatorial regulation ( 45 ). To depict the inter-TRN in more detail including the combinatorial regulations, we need to increase the number of TRFs to be examined. For this purpose, the systems for high-throughput RNAi knockdown and qRT-PCR analysis should be introduced and cell microarray and multiplex qRT-PCR techniques may be promising tools to be used. In addition, the high-throughput ChIP analysis system is also a powerful tool to probe a big TRN including edges between TRFs and non-TRF genes that work for exhibiting the functions characteristic to a specific cell type in question.
It is usually difficult to estimate the specificity of edges in a given TRN investigated due to the inevitable missing of a part of the true edges (false negatives). On the other hand, minimum sensitivity of edge identification can be estimated on the basis of the accumulated knowledge about transcriptional regulations in which TRFs in question are involved. We assessed 41.7% (30 perturbation- and binding-positive edges/73 binding-positive edges) of the minimum sensitivity of the present TRN analysis with Matrix RNAi and TRF–TRF gene binding analysis data by searching for the published literatures ( Supplementary Table 8 ) because 11 in 30 perturbation- and binding-positive edges have been already reported ( Figure 7 ). This percentage is significantly higher than either only the perturbation-positive (1 in 16) or binding-positive edges (9 in 43) ( Figure 7 ), suggesting that perturbation- and binding-positive edges may be much more eligible ones as compared with the edges inferred by only one of the assays.
It should be noted that some edges showed little expression perturbations, but clear TRF bindings, and others did high levels of expression changes with modest or poor enrichments of the target DNA. The regulatory edges that failed to be confirmed by X-ChIP could be real ones because the primer sets used in the present experiments might not cover the actual TRF binding sites if they would be located far from the TSSs. Another plausible explanation is that weak interactions between TRFs and their target genes may also be functionally important for transcriptional regulation as indicated in yeast genome ( 46 ). In addition, binding of a TRF to the regulatory region of the target gene may not necessarily result in its fruitful transcriptional regulation ( 47 ). Each of the TRFs that are involved in the combinatorial regulation can differentially contribute to the transcriptional regulation of a target gene. Binding of a TRF to DNA occurs stochastically and in almost all cases through interactions with other TRFs and transcription factors (TFs) such as general TFs, cofactors and mediators, explaining at least partially several discrepancies between the levels of perturbation and chromatin binding.
Our Matrix RNAi in combination with X-ChIP/qPCR analysis strongly suggests that a number of TRFs are involved in transcriptional regulations of TRF genes to form intricate regulatory circuitries, mediating pleiotropic regulatory effects. Such complexity may enhance the difficulty in computational inference of TRNs. Our experiment-based approach to the identification of the complicated mammalian TRN was challenged by a computational analysis based on simple perturbation data. Modular response analysis (MRA) developed by Kholodenko et al. ( 48 ) was found successfully applicable to the analysis of a signal transduction cascade of MAPK ( 49 ). However, when the MRA analysis was applied to the matrix RNAi-based TRN analysis, several unreasonable results were derived. For example, our perturbation data clearly suggested that TCF1 and HNF4A positively regulate CEBPA, but MRA conversely proposed its negative regulation by these two TRFs. The obvious discrepancy between the experimental results and computational predictions might be due to the difference in the complexity of the analysis object, for example, the number of nodes (regulators and their regulated genes) or the type of network tested. MRA has been applied to cellular networks consisting of defining only a few subunits (modules) that can be analyzed separately.
It is very intriguing to know the species specificity in the TRN construction. To obtain information about evolutional conservation and divergence in the TRN of liver-enriched TRF genes between human and mouse, we tried to do the Matrix RNAi analysis with mouse Hepa 1-6 cell line; however, because of the inefficient RNAi knockdown of many mouse TRF genes examined, the amount of data with high confidence was too small to depict clearly the mouse TRN. However, several regulatory edges found in the HepG2 TRN are missing in the Hepa 1-6 cells and vice versa, suggesting the significant difference between the two TRNs. At the present time, we do not know the reason for this difference, either among species (human and mouse) or among cell lines. The putative evolutionary driving forces may be co-evolution of TRF genes and conservation of the TRF's target DNA elements as well as the physiological requirements, for example, glucose homeostasis, lipid metabolism and detoxification for hepatocytes.
Maintenance of homeostasis at static states of the cells may need a complicated TRN containing various regulatory circuits to keep its robustness, differing from regulatory hierarchical framework predominant in dynamically differentiating cell systems. Because of the pinpointed targeting of the specific TRF genes resulting in direct perturbation effects on their downstream TRF genes, the Matrix RNAi, in particular by a combination with X-ChIP analysis, whose strategy is outlined in Figure 9 , should also be useful for probing mammalian dynamic as well as static TRNs with high complexity.
FUNDING
This work was supported by a Research Grant for the RIKEN Genome Exploration Research Project from the Ministry of Education, Culture, Sports, Science and Technology of Japan, and a grant of the Genome Network Project from the Ministry of Education, Culture, Sports, Science and Technology of Japan to Y.H. Funding for open access charges: the grant to the Genome Network Project.
Conflict of interest statement . None declared.
ACKNOWLEDGEMENTS
The authors would like to thank Alistair Forrest for his critical reading of the initial manuscript.

Comments