


Abstract
Snap (Single Nucleotide Polymorphism Annotation Platform) is a server designed to comprehensively analyze single genes and relationships between genes basing on SNPs in the human genome. The aim of the platform is to facilitate the study of SNP finding and analysis within the framework of medical research. Using a user-friendly web interface, genes can be searched by name, description, position, SNP ID or clone name. Several public databases are integrated, including gene information from Ensembl, protein features from Uniprot/SWISS-PROT, Pfam and DAS-CBS. Gene relationships are fetched from BIND, MINT, KEGG and are integrated with ortholog data from TreeFam to extend the current interaction networks. Integrated tools for primer-design and mis-splicing analysis have been developed to facilitate experimental analysis of individual genes with focus on their variation. Snap is available at Author Webpage and at Author Webpage.
INTRODUCTION
The large amount of ‘omics’ data coming from the complete map of the human genome and downstream work such as transcriptomics, proteomics and variation analyses opens new avenues for decoding sequence data. A long-term strategy of our data management system is to integrate large scale ‘omics’ data with bio-medical focus into a practical setting that supports genetic research in complex human disease. The SNP Annotation Platform (Snap) server is produced to this end and establishes the foundation of an analytic system for single genes and relationships between genes with focus on effects produced by SNPs. Two individuals are 99.9% identical at the DNA level; however, the remaining 0.1% has high medical importance. They define the traits that make us unique and underlie our susceptibility to disease and changes in drug response.
Information from the public domains [Ensembl v38 (1), Uniprot 8.0 (2), Pfam (3), CBS-DAS (4), MINT (5), BIND (6), KEGG 0.6.1 (7)] has been combined with our database with ongoing work to keep the content current and relevant. Moreover, we have integrated our animal model platforms CVDB (8) and PigGIS (9), own comparative genomics platform TreeFam (10) and a protein interaction analysis system currently under construction.
For each gene in Snap, a SeqView entry describes basic genome information and SNPs information. Mapping of protein features to the DNA level, primer design for resequencing and RT–PCR and comparative mis-splicing analysis of both known and user-requested SNPs are available in the SeqView. In addition, a RelationView can be selected for a visual organization of gene networks centered on the selected gene. By integrating evolutionary connections from TreeFam, current interaction networks can be dramatically extended.
The purpose of Snap is to organize and integrate data of medical importance in a user-friendly manner and add a number of convenient tools to aid further analysis of genes and variations within them.
DATA SOURCE AND METHODS
Mapping protein features
The complete human gene and SNP sets from Ensembl (v38), annotated protein features from Swiss-Prot (r132) (11) and predicted features through the CBS-DAS protein annotation viewer were downloaded to a local server. Protein features were mapped to the human genome and SNPs were added by aligning Ensembl proteins and UniProt proteins using the BLAST program (12) with the assistance from the cross-references provided by Ensembl.
Predicting protein interactions
We have featured gene–gene relationships using protein–protein interactions. Information from the experimentally verified database MINT and the computational assistance-based database BIND are combined and data from KEGG are integrated to rank relationships between genes. Furthermore, orthologs defined by TreeFam are employed to transfer protein relationships of other species to the human system. An interaction between two human genes is established when one of the following conditions can be satisfied: (1) Gene A interacts with gene B in MINT or BIND; (2) Gene A and B are both involved in the same metabolic pathway provided by KEGG; (3) one ortholog of gene A interacts with one ortholog of gene B in other species.
DATABASE CONTENT AND ORGANIZATION
SNP index
The current version (v3) of Snap contains 23 710 human genes representing 48 218 individual transcripts and 3 480 292 SNPs from Ensembl v38, 123 884 of which lie in coding regions and 68 072 of these are nonsynonymous.
SNP annotation at transcripts level—prediction of protein features
The protein features from Swiss-Prot and Pfam numbering 2 115 643 are mapped to the DNA sequence to assign further biological meaning to each gene. We classify protein features referring to the category index of Swiss-Prot, and make use of Pfam and DAS-CBS data for complementarity. Five protein feature types with 39 sub-types from Swiss-Prot and two types of features with 11 sub-types from DAS-CBS are imported into Snap, covering ‘protein sorting’, ‘post-translational modifications’ and ‘protein structure and function’. ‘Amino-acid modifications’, ‘change indicators’, ‘regions’, ‘secondary structures’ and ‘others’—including several subunits separately—are features organized and provided in SeqView. 25 562 nonsynonymous SNPs (nsSNPs) are positionally co-localized in the sequence with protein features, comprising 37% of the nsSNPs. See supplementary data Table 1 for a list of all features.
Gene network—gene–gene relationship
Figuratively speaking, genes are spots and relations between them are roads that connect them. Snap presents 197 467 predicted interactions between human genes, of which 67 270 are contained in BIND, 47 826 in MINT, 2120 in KEGG and 80 251 are transferred from orthologous relationships in other species. To generate and show connections between genes, we have produced RelationView to describe networks centering on selected genes. Three formats are provided in Snap to show gene connections: RelationMap, RelationTree and RelationList.
RelationMap is generated by GraphViz (13) (Graph Visualization Software) and the different genes and connections are graphically distinctive by different types of borders and lines. Four levels of genes are shown; the root-gene is level-zero, this level connects with level-one genes, level-one genes connect with level-two genes, and so forth. All extensions for level-zero are always shown. To simplify the picture, extensions from each level-one and level-two gene are shown only if three or less exist. Additionally, the interaction network can be re-centered around any gene by clicking it. The RelationTree supports the RelationMap and presents all relations in the graphical tree detailing their data sources and levels of relationships. Both formats give hierarchical descriptions of gene connections. We also adopt a simple heuristic method, which accounts the number and quality of the supporting sources. All relations were rated and assigned a score reflecting their reliability. In the RelationList, the score was calculated for every two genes in a given map using an internal method based on their source quality. A higher ‘score’ reflects a shorter ‘distance’ between the genes. See supplementary data Table 2 for detailed algorithms.
Web service
(1) Primer design
An online service for PCR primer-design is provided to design primers for any region in the SeqView. Primers can be designed for resequencing individual SNPs, individual introns with flanking regions, individual exons with flanking regions, specific regions of interest or the entire sequence with or without introns. The service runs Primer3 (14) and individual primer pairs are checked for uniqueness using the UCSC In Silico PCR tool (15).
(2) Mis-splicing prediction
In recent years it has become clear that pre-translational regulation is complex and has shown vulnerable to sequence variation not only within the splice site consensus regions but also in a number of intronic and exonic cis-elements important for correct splice-site identification (16). The service ‘Mis-splicing’ estimates the degree of splicing defects resulting from a given nucleotide variation; either a SNP from the database or any base selected by the user. Six different tools are integrated in Snap [NNSplice (17), SpliceView (18), NetGene2 (19), ESEfinder (20), Rescue-ESE (21) and FAS-ESS (22)] to calculate various splicing parameters, and the results from both reference and SNP containing sequences are listed (see supplementary data Table 3 for details).
INTERFACE AND ACCESS
Snap is developed and maintained in a non-profit academic setting and can be directly accessed publicly (see Figure 1).
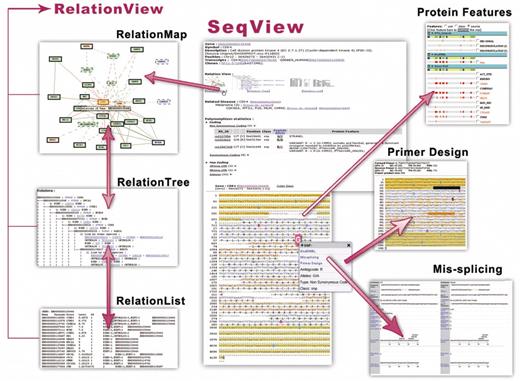
Main contents of Snap. From one central gene, SeqView and RelationView cover disease relevant aspects within the gene and within the gene's interaction network.
A search is simply done by inserting a gene ID, synonym name, SNP identifier or accession code from Ensembl Uniprot/SWISS-PROT. In SeqView, the primary result window, basic information about the gene is shown including description, position, transcripts, related diseases and polymorphism statistics with direct links to the information sources. The main part of SeqView is a gene map highlighting SNPs in combination with protein features from SWISS-PROT, Pfam and DAS-CBS selected by the user. The list of protein features can be reorganized by ‘use’, ‘class’ or ‘source’. If a protein feature name is marked in red (e.g. Pfam), clicking the feature bar will highlight SNPs contained in regions positive for the feature. By clicking the ‘redraw’ button, the feature is shaded in yellow in the sequence map. The overall interface focuses at annotating features from the transcript level to the DNA level and, most importantly, to the SNP level.
There are three links in the interface of SeqView that can lead to the RelationView, which is another part of Snap created from the perspective of gene–gene interactions. In the RelationMap, a web interface developed to visualize the network in a user-friendly way, three border patterns represent the number of outside links from the gene: (1) no outside links, (2) appropriate number of outside links and (3) too many outside links (threshold: 250). Relations between human genes are joined by bold lines, whereas those based on ortholog data are joined by dashed lines. Genes can be graphically grouped according to their ortholog data to clarify dependence on information from other species or all ortholog data can be disabled and only human gene relations are shown. Five types of layouts, three formats of figures and three levels of relationships are available to honor users' requirements. Gene relations from BIND and orthologs are displayed by default. In the RelationTree, we employed a plus sign ‘+’ to stand for the existing of more relationships, while a backslash ‘\’ to represent no more extended connections. The detailed underlying data can be seen in the RelationList views also.
The primer-design and mis-splicing services are accessible by clicking on the individual SNPs in ‘Polymorphisms Statistics’ or in the gene map in the SeqView. Furthermore, any base can be selected from the sequence and submitted from the panel to the right. For each design, two pairs of primers are given satisfying the parameters of primer size, TM value and product size; all parameters can be changed freely. A list of primer pairs for resequencing can be calculated for an entire mRNA or genomic sequence overlapping one by one, and covering the whole region of interest. The overlap is 100 bp by default. For RT–PCR use, primers are designed on mRNA and span introns specified by the user. Each primer pair must be at least 700 bp apart on the mRNA level and 1500 bp on the genome level. In addition, primers surrounding specified introns including flanking regions can be requested also.
CONCLUDING REMARKS
Complex diseases involve complex interactions of many aspects such as genetically coded variations, epigenetic modification and environmental influences. We need to define heterogeneous patterns of gene variations and their genetic modifiers to fully describe the genetic background of a common disease. The biggest challenge in achieving this aim is to organize the individual genes into one immense network. The three types of RelationView presented in Snap is a, still ongoing, attempt in this field.
The authors wish to thank Pia P. Madsen and Brage S. Andresen for discussions on splicing. This project was supported by Chinese Academy of Sciences (KSCX2-YW-N-023; GJHZ0518), Ministry of Science and Technology under high-tech program 863, Ministry of Education (XXBKYHT2006001), National Natural Science Foundation of China (90608010; 90208019; 90403130; 30221004; 90612019; 30392130), and China National Grid. The work was further supported by the Danish Platform for Integrative Biology, the Ole Rømer grant from the Danish Natural Science Research Council and the Danish Medical Research Council. Funding to pay the Open Access publication charges for this article was provided by the Danish National Research Foundation.
Conflict of interest statement. None declared.
REFERENCES
Author notes
*Correspondence may also be addressed to Lars Bolund. Tel: +45 89421675; Fax: +45 86123173; Email: [email protected]
The authors wish it to be known that, in their opinion, the first four authors should be regarded as joint First Authors

Comments