


Abstract
To provide an integrated bioinformatics platform for a systems biology approach to the biology of pseudomonads in infection and biotechnology the database SYSTOMONAS (SYSTems biology of pseudOMONAS) was established. Besides our own experimental metabolome, proteome and transcriptome data, various additional predictions of cellular processes, such as gene-regulatory networks were stored. Reconstruction of metabolic networks in SYSTOMONAS was achieved via comparative genomics. Broad data integration is realized using SOAP interfaces for the well established databases BRENDA, KEGG and PRODORIC. Several tools for the analysis of stored data and for the visualization of the corresponding results are provided, enabling a quick understanding of metabolic pathways, genomic arrangements or promoter structures of interest. The focus of SYSTOMONAS is on pseudomonads and in particular Pseudomonas aeruginosa, an opportunistic human pathogen. With this database we would like to encourage the Pseudomonas community to elucidate cellular processes of interest using an integrated systems biology strategy. The database is accessible at Author Webpage.
MOTIVATION
Traditionally, metabolic and gene-regulatory networks were analysed separately. There are various tools for metabolic network reconstruction [e.g. (1–3)], and for the generation of gene-regulatory networks (4), i.e. the prediction of the regulation of certain genes by specific transcription factors. However, there still exist only a few tools combining both networks such as the Pathway Tools Omics Viewer (5). This poor connectivity between the two outlined approaches might be due to the fact that the required information is stored in different databases. Information on transcription factor binding sites can be found for example in RegulonDB (6) or PRODORIC (7), while metabolic reactions or pathways need to be retrieved from other database, such as BRENDA (8), BioCyc (5), KEGG (9), PseudoCyc (10), and UM-BDD (11). Combining knowledge from multiple disciplines and data resources will drive our understanding of cellular processes and lead to the prediction of the cellular behaviour in its entirety.
Consequently, we constructed the database SYSTOMONAS, which provides the basis for a systems biology approach. Here we focus on data integration for the biotechnologically and medically relevant group of bacteria, the pseudomonads.
CONTENT OF SYSTOMONAS
The complexity of a systems biology approach requires the focus on a certain well investigated organism. We have chosen the Gram negative proteobacterium Pseudomonas aeruginosa. This organism is a versatile soil bacterium and an important opportunistic pathogen causing persistent infection in immunocompromised patients (12). Our long term goal is the development of a dynamic model simulating the behaviour of P.aeruginosa during infection. The basis of our approach is SYSTOMONAS, a comprehensive database that includes data from all levels of analysis as microarray and proteomics data, metabolite measurements, sequence data, gene-regulatory networks and corresponding enzyme data.
Our database comprises information on eight different Pseudomonas species and strains, which genomes have been completely sequenced and functionally annotated. Besides the medically relevant P.aeruginosa the genera Pseudomonas contains various important plant pathogens and biotechnologically as well as ecologically interesting species.
Our initial focus was on metabolomics. However, all current information coming from genomics, transcriptomics and proteomics (13) is also stored in our database as data warehouse (14) or dynamically accessible via web services using SOAP interfaces (15), a platform-independent data transfer protocol (see section ‘Database Techniques’). Besides other research groups and our own experimental results further data are retrieved from major general data resources. Major external sources of SYSTOMONAS are KEGG [Kyoto Encyclopedia of Genes and Genomes (9)], Pseudomonas Genome Database v2 [PGDv2 (16)], PRODORIC [PROcaryotIC Database Of gene-Regulation (4)], and BRENDA (8). KEGG provided metabolic reactions, compounds, glycans and pathways; PGDv2 and PRODORIC supplied protein, gene annotation, gene-regulatory and genome structure data. BRENDA supports kinetic and disease information. ENZYME (17) and BioCyc (5) provide further functional characterization of proteins.
Currently, SYSTOMONAS contains 10 034 proteins identified as enzymes, 195 transcription factor–gene relations, 14 250 measuring points of three independent metabolome experiments. Moreover, 11 exemplary protein spots from one proteome experiment were entered. Transcriptome data are provided by PRODORIC via SOAP (see section ‘Database Techniques’). For P.aeruginosa PAO1 1509 unique proteins were annotated in SYSTOMONAS as enzymes. The 1509 annotated enzymes were retrieved from KEGG (1003), PGDv2 (1017), BioCyc (493), ENZYME (393) and from our own annotation (241). The corresponding annotation process is described in the following sections. By comparison, PseudoCyc contains 738 enzymes (version 9.6, Author Webpage).
COMPARATIVE GENOMICS AND REGULATORY NETWORK PREDICTION
Comparing a Pseudomonas protein of interest with other well-characterized proteins may deliver useful insights into the evolution, distribution and species specific function. Therefore, we searched for all deduced proteins of the SYSTOMONAS database for orthologous proteins in other Pseudomonas species to obtain orthologous protein clusters. First, a restricted BLAST analysis (18) was performed on the protein sequences followed by a pairwise global alignment using the tool stretcher of the EMBOSS package (19). The homologous protein pairs can be obtained from the SYSTOMONAS protein table and visualized as multiple alignments, which are produced by MUSCLE [MUltiple Sequence Comparison by Log-Expectation (20)]. A more dynamic and flexible tool for the visualization of multiple alignments is provided by Jalview (21), which is also accessible from SYSTOMONAS. This tool does not only display multiple alignments but is also able to generate a phylogenetic tree for the protein group by different algorithms. The E-value of BLAST and the identity calculated by stretcher can be retrieved by activating the two multiple alignment tools.
Graphical maps of corresponding gene regions can be retrieved via a hyperlink to the BRENDA Genome Explorer, a tool within the BRENDA package (8). BRENDA Genome Explorer visualizes orthologous gene regions, which have a sequence identity of at least 50% in different organisms.
If the user is interested in the prediction of transcription factor binding sites and the deduction of corresponding regulons the tool Virtual Footprint (4) can be employed. We adapted this tool to SYSTOMONAS by limiting the analysis on Pseudomonas species.
Metabolic network reconstruction
Genes and proteins of eight Pseudomonas species and strains are carefully annotated by the Pseudomonas community and involved genome projects (16). PGDv2 is the resource for the continually updated P.aeruginosa PAO1 genome annotation. It also refers to genome annotation web sites of other Pseudomonas genome projects for the most up-to-date information. To reconstruct metabolic networks, we transferred known EC numbers of each Pseudomonas protein to its homologous partners. The enzyme designation of proteins was determined in three steps. First, the external databases KEGG (9), PGDv2 (16), ENZYME (17), BioCyc (5) provide EC numbers for the proteins. Second, homology analyses lead to putative orthologous protein pairs (see section ‘Comparative Genomics’). Third, if the identity of the global alignment (stretcher) equals or exceeds 60%, all EC number connections to proteins were transferred to their orthologous protein partners. The EC number source on the website is indicated accordingly. EC numbers newly identified by our method are declared as ‘predicted’. In order to improve the metabolic network reconstruction by applying another method, we also used the tool metaSHARK (1). This tool is able to identify potential enzyme-encoding genes in raw DNA sequences, which are not annotated yet. All newly detected EC numbers by metaSHARK are also indicated as ‘predicted’ in SYSTOMONAS. Table 1 lists parts of the corresponding database content.
Statistics of the metabolic network reconstruction for various Pseudomonas species in SYSTOMONAS
| Enzyme annotation | |||||||
|---|---|---|---|---|---|---|---|
| Organism | Proteins | In total | via KEGG | via PGDv2 | via ENZYME | via BioCyc | Predicted |
| P.aeruginosa PAO1 | 5651 | 1509 | 1003 | 1017 | 393 | 493 | 241 |
| P.aeruginosa PA14 | 6107 | 1442 | −* | 1139 | — | — | 303 |
| P.fluorescens Pf-5 | 6137 | 1332 | 1067 | — | — | — | 265 |
| P.fluorescens PfO-1 | 5736 | 1235 | 985 | — | — | — | 250 |
| P.putida KT2440 | 5351 | 1168 | 897 | — | 23 | — | 268 |
| P.syringae pv phaseolicola | 5121 | 1118 | 938 | — | — | — | 180 |
| P.syringae pv syringae | 5089 | 1130 | 871 | — | — | — | 259 |
| P.syringae pv tomato | 5608 | 1100 | 851 | — | 5 | — | 249 |
Most enzyme information was provided by KEGG. PGD2, BioCyc, ENZYME also contributed to the functional annotation of enzymes. Further enzymes were annotated by comparative genomics (column ‘Predicted’), which were missing in the databases mentioned afore. * strain absent in KEGG (version 13th April 2006).
Next, we imported KEGG-pathway data and enabled links to pathway maps via the SOAP interface provided by KEGG (9), in which P.aeruginosa enzymes are highlighted. A metabolic network including all involved enzymes, metabolic reactions and metabolites of all pseudomonads is delivered by our own adapted tool, which is based on GraphViz (22) and creates clickable image maps (Figure 1). The user immediately recognizes enzymatic reactions unique to one Pseudomonas species. All necessary information concerning this reaction is provided by mouse click.
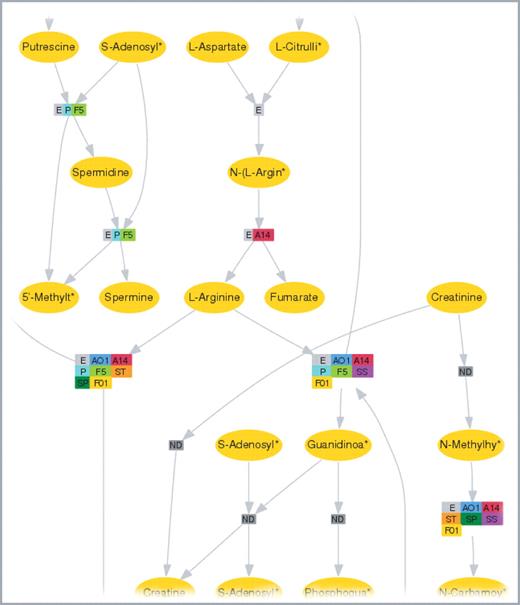
The visualization of metabolic pathways from KEGG in SYSTOMONAS is based on GraphViz using the dot layout. All known metabolic reactions are depicted here for the ‘Urea cycle and metabolism of amino groups’ pathway. Rectangles depict metabolic reactions, ellipses represent metabolites whose names are abbreviated with an asterisk * when the length exceeds 10 letters. Both types of nodes are clickable. Different colours for rectangles specify distinct Pseudomonas species, which catalyse the corresponding reaction. These pathways can be obtained from metabolic pathway entries. An abbreviation code for the species is provided with the visualization output (AO1 = P.aeruginosa PAO1, A14 = P.aeruginosa PA14, P = P.putida KT2440, Pf-5 = P.fluorescens F5, F01 = P.fluorescens PfO-1, ST = P.syringae pv tomato, SP = P.syringae pv phaseolicola, SS = P.syringae pv syringae)
METABOLOMICS DATA
The database structure of SYSTOMONAS is suitable for the simple storage of various types of experimental data. All currently available transcriptome and proteome data are deposited in the database. For a start, we included our own experimental data obtained for the P.aeruginosa strain PAO1 measured under different growth conditions. Our raw data analysed by GC/MS can be accessed via the query form ‘omics data’. As an extra feature, the metabolomics data obtained for one specific growth condition can be plotted against another dataset using gnuplot (Author Webpage). Data points are clickable and lead to the corresponding metabolite of the database (Figure 2). If the levels of specific metabolites differ significantly between different conditions, the measured values are found distinct to a fictive diagonal line. Experimental conditions and methods are indicated along with the raw data.
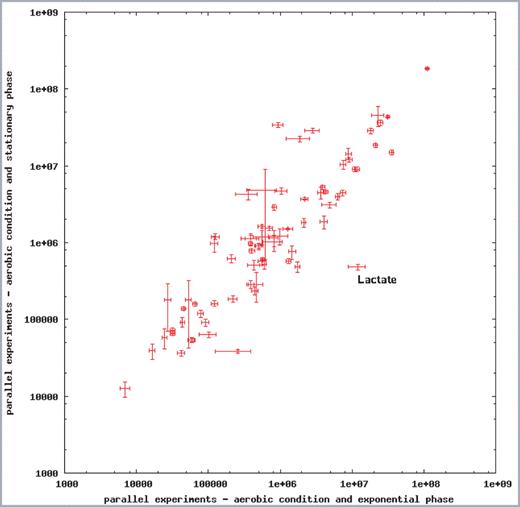
Semi-quantitative scatter plot for the comparison of metabolic profiles measured for P.aeruginosa PAO1 grown under aerobic conditions. Metabolites were analysed by GC/MS. Mean peak areas and standard deviations for the metabolites were calculated and plotted on a logarithmic scale using gnuplot (Author Webpage). Metabolites measured from samples of exponentially growing cells under aerobic conditions are plotted along the x-axis against metabolites from samples of resting cells along the y-axis. The metabolite name for every data point is shown as tooltip while moving the mouse over the point (e.g. for the data point ‘Lactate’) and linked back to the corresponding database entry. If the metabolic profile during one experimental condition is similar to the condition compared, data points will arrange closely to the diagonal line.
DATABASE TECHNIQUES
We have chosen the open source object-relational database management system PostgreSQL 8.0.3 (Author Webpage) for our database. This database is accessed with the scripting language PHP (Author Webpage), which also allows the dynamic generation of the web interface. The web server is Apache 2.0 (Author Webpage).
Data integration with SYSTOMONAS combines two different principle concepts, the data warehouse concept (14) and dynamic web services via SOAP. The advantage of a data warehouse is mainly its fast performance during the data retrieval. For this purpose, a major portion of the data of SYSTOMONAS, such as KEGG compounds, reactions or PRODORIC transcription factor—gene interactions is locally stored. The major advantage of SOAP is its up-to-dateness, since SOAP-transmitted information is corresponding to the most recent data of the consulted database. Several databases provide web services via SOAP, such as the major sequence databases (23–25). Several other databases, such as Atlas (26) are organized as data warehouses. The main data sources of SYSTOMONAS are stored and matched in an intermediate data container ‘metabold’, which supplies data to SYSTOMONAS (Figure 3). The web services via SOAP, which are used on the websites of SYSTOMONAS, are listed in Table 2. Whenever a webpage with these web services is accessed, the data is retrieved from the actual external database and amends the locally stored data of SYSTOMONAS. The API (application programming interface) is constructed by the SOAP extension of PHP.
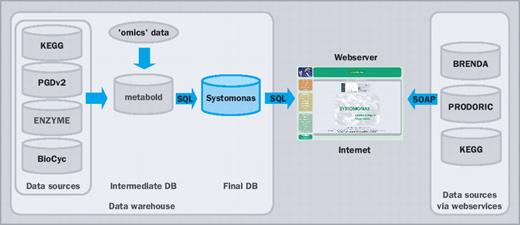
SYSTOMONAS architecture: combining the data warehouse concept and web services to provide a quick and dynamically updated data integration.
External web services implemented on the SYSTOMONAS (S.) websites via SOAP
| Database | Name | Function | S. website form |
|---|---|---|---|
| BRENDA Author Webpage | getFunctionalData() | Kinetic data and corresponding references | EC |
| getDisease() | Diseases and corresponding references | EC | |
| PRODORIC Author Webpage | getOperon() | Operon data and corresponding references | Gene |
| getRegulatorsFromGene() | Transcription factors, DNA binding sites, and corresponding references | Interaction | |
| getProfile() | Experimental conditions for expression profile experiments | Transcriptomics | |
| getProfileParameter() | Expression profiles experiments and corresponding references | Transcriptomics | |
| KEGG Author Webpage | soap_kegg_pathway() | Visualization of metabolic pathway maps | Pathway |
These services complement a specific record of the indicated SYSTOMONAS website form by transferring the appropriate information from the given external database.
AVAILABILITY
Currently, the data of SYSTOMONAS along with its visualization tools and web services can be accessed freely via a web-based user interface (Author Webpage). Additional information, such as kinetic data, operon structures or transcriptomics data are retrieved on-the-fly via web services from PRODORIC, BRENDA and KEGG (Table 2). We provide SBML (27) formatted files for downloading our metabolic and gene-regulatory networks along with a database copy at the SYSTOMONAS website.
The authors are much obliged to Frank Klawonn for advising in the statistical part of metabolomics comparison. Many thanks go to Mathias Krull and Barbara Schulz, who proof-read this paper. This work was funded by the German Bundesministerium für Bildung und Forschung (BMBF) for the National Genome Research Network (NGFN2-EP, grant no. 0313398A), BMBF for the Bioinformatics Competence Center Intergenomics (Grant No. 031U110A/031U210A) and the Volkswagen Foundation.
Conflict of interest statement. None declared.

Comments