


Abstract
Knowledge of protein localisation contributes towards our understanding of protein function and of biological inter-relationships. A variety of experimental methods are currently being used to produce localisation data that need to be made accessible in an integrated manner. Chimeric fluorescent fusion proteins have been used to define subcellular localisations with at least 1100 related experiments completed in Arabidopsis. More recently, many studies have employed mass spectrometry to undertake proteomic surveys of subcellular components in Arabidopsis yielding localisation information for ∼2600 proteins. Further protein localisation information may be obtained from other literature references to analysis of locations (AmiGO: ∼900 proteins), location information from Swiss-Prot annotations (∼2000 proteins); and location inferred from gene descriptions (∼2700 proteins). Additionally, an increasing volume of available software provides location prediction information for proteins based on amino acid sequence. We have undertaken to bring these various data sources together to build SUBA, a SUBcellular location database for Arabidopsis proteins. The localisation data in SUBA encompasses 10 distinct subcellular locations, >6743 non-redundant proteins and represents the proteins encoded in the transcripts responsible for 51% of Arabidopsis expressed sequence tags. The SUBA database provides a powerful means by which to assess protein subcellular localisation in Arabidopsis (Author Webpage).
INTRODUCTION
Genomic sequencing efforts of the past decade have provided the scientific community with a vast array of basic information regarding the structure of genomes and their coding capacities. In plants, recent years have seen genome sequencing efforts completed on the model dicot species Arabidopsis (1) and on the important agronomic monocot species, rice (2,3). Curation and analysis of the Arabidopsis genome by The Institute for Genomic Research (TIGR) (4) and more recently by The Arabidopsis Information Resource (TAIR) (5) has produced an annotated genome of high quality (6) that is currently in its sixth revision. While these studies and resources have provided significant insights into the genetic composition of Arabidopsis, the function of many proteins remains poorly understood. A common method employed to assist in the attribution of function to a protein is to establish subcellular location (7). Separate subcellular locations often represent distinct cellular environments and proteins found within such locales share similar attributes and fundamentally play roles in defining the function of a subcellular compartment.
The subcellular location of a protein can be predicted from the primary protein sequence using bioinformatic means. A variety of these bioinformatic programs are available and several studies have assessed their performances using genome wide prediction of localisation (8,9). Experimental approaches can also be used for subcellular determination and commonly utilize cellular fractionation, centrifugation-based purification of organelles or cellular compartments, and mass spectrometry to identify peptides and have been used to define sets of proteins grouped by subcellular location (10–12). Such approaches have been extensively undertaken in Arabidopsis with a number of studies producing significant protein sets from major compartments and locations such as plastids (13–19), the nucleus (20–22), the plasma membrane (23) and the mitochondrion (24,25). A complementary approach to mass spectrometry is the expression and visualisation of fluorescent proteins (FPs) attached to proteins of interest. Many hundreds of Arabidopsis proteins have been visualised in this manner to date and form an important dataset for determining subcellular location (26–29). Importantly, they represent the only subcellular location data for intact, living cell structures. Swiss-Prot is a managed database of protein entries that allows hand-annotation, by researchers, of important data regarding a protein's catalytic action, cellular location and broader functional role in biology (30,31). This represents a rich source of data collected over several decades directly from researchers and indirectly from the literature. The Genome Ontology (GO) database maintained by The Gene Ontology Consortium is searchable using the AmiGO browser (32) and contains an array of information regarding genes and associated data that conforms to a consistent and well defined vocabulary.
Currently, the data in most of these literature sources and compiled datasets are relatively inaccessible to the wider research community and the specific proteins localised in some reports are often so numerous that they do not appear in the text, title or abstract of a paper of interest. While TAIR represents the primary source for the majority of information concerning Arabidopsis, it tends to focus on genomic and transcript data. Currently subcellular targeting prediction information is only available for one program (TargetP), while subcellular proteomes and FP targeting information are limited and not accessible as defined sets. Although GO annotations and descriptor fields can be readily searched at TAIR, all these data cannot be collectively investigated as defined sets using Boolean queries. Previously using SUBA we have demonstrated that an analysis of a variety of localisation data sources can be readily utilized to assess subcellular prediction and protein family localisation (9,33). By bringing together additional protein localisation information provided by prediction algorithms, mass spectrometry, GFP studies, Swiss-Prot annotation, AmiGO data and TAIR annotation in the context of defining the subcellular location of proteins in Arabidopsis, we have aimed to provide a one-stop-shop for protein localisation in this model plant.
DATABASE STRUCTURE AND INTERFACE
SUBA is a MySQL relational database, operating on a UNIX-based system. The non-redundant nuclear protein dataset originally utilized to populate the database was obtained from TIGR contained in the file ATH1.pep (release 5) comprising 28 952 non-redundant proteins. Arabidopsis mitochondrial (117) and chloroplast (87) open reading frame sets were obtained from GenBank. Updating of the database to keep pace with new gene model data is an ongoing process. SUBA currently contains a total of 29 156 proteins. Data used to populate the database has been derived from a multitude of sources details of which can be found in Supplementary Data.
SUBA consists of a web-browser based GUI (Graphical User Interface) written in DHTML (Dynamic HTML) that makes use of AJAX (Asynchronous Javascript and XML) to interact with the SUBA server. The back-end of SUBA consists of a number of PHP programs that interact with the MySQL tables that house SUBA data. The SUBA GUI has been designed to allow users with no prior knowledge of SQL (structured query language) to dynamically construct moderately complex SQL queries in a point and click manner. For more advanced users, SQL queries may be manually defined although for security reasons queries are restricted to SELECT type only. The GUI is accessible via Author Webpage (Figure 1) and is suitable for use with most modern web browsers, although we recommend using the Firefox web browser as it handles the DHTML of SUBA in a significantly faster manner than other common browsers. The interface utilises a tabbed design and refreshes content via AJAX, removing the need for users to depend upon the ‘back’ button of their browsers. The ‘Search’ tab is designed for ease of use consisting of pull down menus and simple text boxes. Complex Boolean queries can be performed using AND, OR and appropriate bracketing. For more advanced users, the ‘SQL search’ tab allows direct entry of SQL queries. Query results are accessed via the ‘Results’ tab in a tabular format with each row containing, by default, protein Arabidopsis genome initiative (AGI) identifier and localisation summary information. The ‘Columns’ tab allows users to control exactly which data columns are loaded whilst the ‘Format’ tab allows users to control which data column are visible and the order in which they are displayed. Some control over column order and visibility is also provided directly via the ‘Results’ tab. Finally, the ‘Rows’ tab keeps a record of all proteins selected by the user via the ‘Results’ tab allowing for simple cutting and pasting of lists and filtering of results. If desired, the results from a query may be downloaded as a tab delimited file for further analysis.
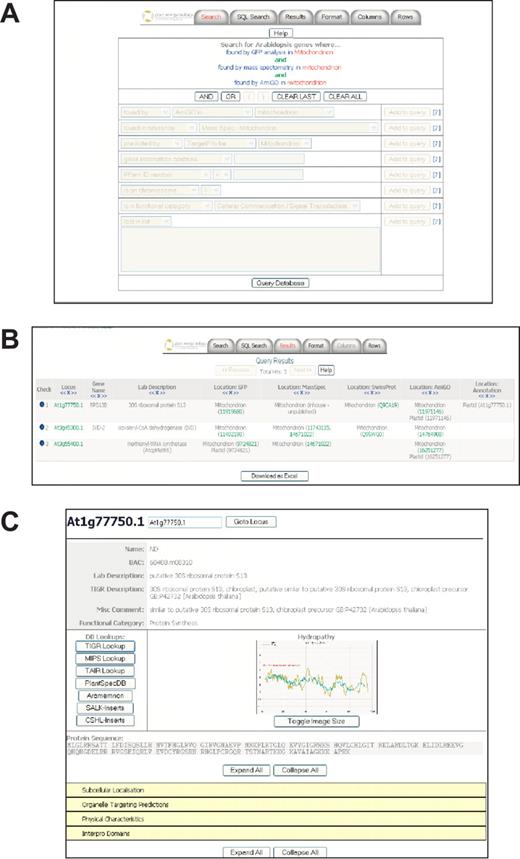
The SUBA graphical user interface showing a search (A) where complex queriescan be built from pull down menus and visualised in the sentence structure represented in the text box. In this case for proteins localised to mitochondria by three different experimental data sets. The results (B) of this search is shown, and the AGI page (C) for one of these identifications giving links and information on the requested protein.
Each protein match in the result table is hyperlinked to a flatfile that displays further information and provides links to related resources such as BLAST and other Arabidopsis databases including TAIR, TIGR, MIPS Arabidopsis thaliana Database (MAtDB) (34), The Plant Specific Database (35), ARAMEMNON (36), Salk Insertion Sequence Database (37).
NUMERICAL ASSESSMENT OF THE COMPILED DATA RESOURCES IN ARABIDOPSIS SUBCELLULAR DATABASE (SUBA)
The numbers of accumulated sub-cellular location annotations in SUBA are outlined in Table 1. These represent data in 12 subcellular locations (Cell plate, Cytoskeleton, Cytosol, ER, Extracellular, Golgi, Mitochondria, Nucleus, Peroxisome, PM, Plastid, Vacuole) and a range of data in a 13th category in which location is considered speculative (Unclear). Mass spectrometry (MS) leads the number of matches contributed from the direct experimental data sets of MS, FP and AmiGO by ≥2:1 by contributing 3500 location data pieces on 2600 non-redundant proteins, compared to the MS+FP+AmiGO total of 5818 data pieces on 3781 non-redundant identifications. Swiss-Prot and Description data contribute similar number of localisations to MS; to date, 1981 and 2701, respectively. Combined, there are some 10 800 pieces of assembled sub-location data in SUBA on a set of 6743 non-redundant proteins.
Compiled data resources collected in the Arabidopsis Subcellular Database (SUBA)
| Location | FP | MS | AmiGO | Swiss-Prot | Description |
|---|---|---|---|---|---|
| Cell plate | 15 | — | 5 | 6 | 12 |
| Cytoskeleton | 34 | — | 27 | 2 | 50 |
| Cytosol | 192 | — | 124 | 248 | 117 |
| ER | 58 | 179 | 34 | 43 | 16 |
| Extracellular | 25 | 187 | 17 | 214 | 80 |
| Golgi | 41 | 88 | 28 | 41 | 32 |
| Mitochondria | 93 | 547 | 97 | 227 | 417 |
| Nucleus | 403 | 367 | 275 | 551 | 1392 |
| Peroxisome | 52 | 42 | 25 | 11 | 69 |
| PM | 119 | 597 | 76 | 117 | 117 |
| Plastid | 142 | 1110 | 237 | 323 | 560 |
| Vacuole | 49 | 383 | 35 | 42 | 32 |
| Unclear | 115 | — | — | 238 | — |
| Any Location | 1093 | 2604 | 877 | 1981 | 2701 |
Locations are 13 subcellular localisation groups; FP—data from visualisation in vivo of fluorescent protein constructs; MS—data from mass spectrometry analysis of proteins from isolated subcellular fractions, AmiGO—inferred from direct assay data in the GO database from Arabidopsis; Swiss-Prot—Swiss-Prot database localisation of Arabidopsis proteins; Description—text search of TAIR gene annotation for location. Numbers are non-redundant Arabidopsis proteins in each category.
HOW TO BUILD QUERIES FOR THE ARABIDOPSIS SUBCELLULAR DATABASE (SUBA)
After loading the interface, (Author Webpage) the query tab is active and from this view any number of characteristics or sets can be selected to define a database query. Simple to moderately complex searches may be constructed using AND, OR and NOT functions to link together any number of data components. Selected data can be easily downloaded using the ‘Download as Excel’ button at the bottom of the results window. Below are some examples that show how this database can help with particular questions.
Building protein sets of known subcellular location from published datasets
In analysis of bioinformatic data, such as transcript data from microarray or yeast two-hybrid interactions, it is often helpful to have lists of gene loci with known location properties. GO annotation provides some tools for this use in many data analysis packages, however, SUBA provides more up to date lists of proteins based on location sets and these can be tailored by the user to include only experimental data or a combination of experimental and prediction data. For example a set of all proteins in the chloroplast, ‘the chloroplast proteome’, can be developed by combining MS, GFP and AmiGO data to give a set of 1309 proteins, this could be expanded by adding other proteins predicted to be in chloroplasts by the prediction programme Predotar to give 2437, or it could be minimised by only taking the experimental set (MS, GFP and AmiGO) that is also firmly predicted by Predotar to give 555 proteins. These AGIs can then be downloaded using the Excel download button to be imported into another programme as a tailored chloroplast location set. These sets might also be browsed by chloroplast researchers interested in which proteins have been located in chloroplasts recently.
Comparison of published proteome sets to each other and to new sets
As the number of reports of proteins identified from different locations accumulates in the literature, it is increasingly difficult to know how accurate these sets are, whether they agree with previous reports or whether claimed new findings have also been reported by other groups in the same or different locations in the cell. SUBA allows a direct comparison of published datasets using the ‘found in reference/not found in reference’ option on the query page that gives access to the lists from each particular paper used to build the sets in SUBA. These can be compared against each other using OR/AND linkages in the query window. For example, Kruft et al. (24) and Millar et al. (25) began the development of the mitochondrial proteome, listing 40 and 83 IDs respectively. The common set between the two studies numbers 28 (Kruft AND Millar). More recently, Froehlich et al. (18) and Ferro et al. (17) both analysed the chloroplast envelope membrane by different methods, identifying 340 and 105 proteins, respectively, with only 59 in common (Froehlich AND Ferro). Interestingly, only 174 of either of these sets were found in the intact chloroplast analysis by Kleffman et al. (19) the following year [(Froehlich OR Ferro) AND Kleffman]. New sets that are unpublished or in review can be easily compared against the published sets by combining in reference queries with AGI lists inserted into the ‘loci in list/loci not in list’ input box.
Comparison of targeting prediction programs
Targeting prediction programs are mostly used to determine the likelihood that a specific protein sequence is targeted to a particular subcellular structure. Usually only one is used, or at best, two programs are used one at a time. However, as SUBA contains pre-analysed predictions across a set of ten prediction programmes for all nuclear-encoded protein sequences from Arabidopsis, the set of proteins predicted to a specific location by multiple targeting prediction programs can be rapidly compared. For example, 3182 proteins are predicted to be mitochondrial by TargetP, but this set is reduced to 1176 if MitoProt II and iPSORT are also queried to form an inclusive consensus set across all three predictors. An assessment of false negative sets and false positive sets for individual predictors can also be made by comparing the existing experimental data with the output of individual prediction programmes. For example, of the 3181 protein predicted by TargetP to be mitochondrial, 470 have been found experimentally somewhere in Arabidopsis [TargetP in mitochondria AND (MS any location OR GFP any location OR AmiGO any location)], but only 268 were found in mitochondria (TargetP in mitochondria AND [MS in mitochondria OR GFP in mitochondria OR Amigo in mitochondira]). This means that 202 proteins, while predicted to be mitochondrial by TargetP, were experimentally found to be located elsewhere. Thus, we can calculate a false positive rate for TargetP mitochondrial predictions of 202/470 = 42%. Proteins are also found in mitochondria (MS in mitochondria OR GFP in mitochondria OR AmiGO in mitochondria = 645) that are not predicted by TargetP [TargetP in mitochondria AND (MS any location OR GFP any location OR AmiGO any location) = 262]. Using these numbers, we can calculate the false negative rate of TargetP mitochondrial predictions as 1−(262/645) = 59%.
Locating proteins or protein families of interest
Many researchers are interested in specific genes or gene families. For an interest in malate dehydrogenases, you could select proteins with a description including the word ‘malate dehydrogenase’ which yields nine entries from the entire Arabidopsis protein set with these words in the primary descriptor. Data are presented on the results page showing the peroxisomal location of three gene products, the mitochondrial localisation of two others, the plastid location of another two and the cytosolic location of a further three based on mixture of MS, Swiss-Prot annotation and AmiGO direct assay evidence. For less analysed gene families, this type of search can be used to assess the predicted location by TargetP for the members of a gene family to identify the most likely member with a particular subcellular location, for example to drive an experimental design to identify an endoplasmic reticulum (ER) member of a particular gene family. The incorporation of a TIGR Paralogous Families list and PFAM (38) Protein Family IDs in the search tab allows the user to quickly consider a set of related proteins based on sequence similarity and functional domains rather than on an intimate knowledge of gene annotations or AGI locus numbers.
In this manner, complex queries may be built to investigate many different questions relating to the assessment of localisation data based on experimentation and prediction, and to link this to assessment of expression levels (using expressed sequence tags) to physical location on chromosomes (using AGI identifiers and chromosome selections) to physical characteristics of proteins (GRAVY, pI, MW, functional motifs).
FUTURE PROSPECTS
Incorporation of further experimental localisation datasets is planned to enhance the value of this database as a resource for plant molecular analysis. Furthermore, new prediction programs, the results of new high-throughput GFP tagging experiments and new mass spectrometry analysis of organelle fractions will be added and protein-protein interaction studies will also be incorporated. This will provide a relational search environment bringing together large datasets with a focus on questions pertaining to subcellular location and organelle function.
We would like to thank Torsten Blum (Wilhelm-Schickard-Institut für Informatik Universität Tübingen) for pre-computed Arabidopsis localisation set using MultiLoc and Rajesh Nair (Columbia University Bioinformatics Center) for the pre-computed Arabidopsis localisation set using LOCTree. This work is supported through the Australian Research Council Centre of Excellence Programme, an ARC QEII Research Fellowship to AHM, an ARC Postdoctoral Fellowship to JLH and a WA Premier's Research Fellowship to IS. Funding to pay the Open Access publication charges for this article was provided by the University of Western Australia.
Conflict of interest statement. None declared.

Comments