


ABSTRACT
The transient X-ray source MAXI J1810−222 was discovered in 2018 and has been active ever since. A long combined radio and X-ray monitoring campaign was performed with Australia Telescope Compact Array and Swift, respectively. It has been proposed that MAXI J1810−222 is a relatively distant black hole X-ray binary, albeit showing a very peculiar outburst behaviour. Here, we report on the spectral study of this source making use of a large sample of NICER observations performed between 2019 February and 2020 September. We detected a strong spectral absorption feature at ∼1 keV, which we have characterized with a physical photoionization model. Via a deep scan of the parameters space, we obtained evidence for a spectral-state dependent outflow, with mildly relativistic speeds. In particular, the soft and intermediate states point to a hot plasma outflowing at 0.05–0.15c. This speeds rule-out thermal winds and hence, they suggest that such outflows could be radiation pressure or (most likely) magnetically driven winds. Our results are crucial to test current theoretical models of wind formation in X-ray binaries.
1 INTRODUCTION
Black hole X-ray transients (BHTs) spend most of their lifetimes in quiescence, which is characterized by an X-ray luminosity of Lx < 1032 erg s−1. The active accretion phase, i.e. outburst, which can have a peak luminosity of 1036–39 erg s−1, can last from a few weeks up to several months (Tetarenko et al. 2016). However, years-long outbursts have been observed from some sources, such as GRS 1915+105 (see e.g. Motta et al. 2021). During a typical outburst, BHTs usually show different spectral states, such as the canonical disc-dominated soft state and the Comptonization dominated hard state, as well as a few intermediate states (see e.g. Belloni & Motta 2016). Equatorial outflows in the form of disc winds are usually detected in disc-dominated states of sources seen at high inclination. This might depends on the wind radial density profile (the closer our line of sight is to the disc plane, the higher the optical depth, see Parra et al. submitted; Ponti et al. 2012). X-ray winds are mainly probed through resonant transitions of highly ionized elements blueshifted by Doppler motions with velocities of the order of few hundreds km s−1. This indicates a lower limit on the escaping wind radius of the order of 104–5 Rg. Here, the thermal motion of ions, due to irradiation of X-ray photons from the inner disc, is sufficient to unbind them from the gravitational well of the compact object (thermally driven winds; Begelman, McKee & Shields 1983). However, such explanation is not universal. In a few BH systems, such as GRO J1655−40, it has been suggested that magnetically driven winds provide a better description owing to their small launching radius, which may result in a higher escape velocity (see Miller et al. 2006; Tomaru, Done & Mao 2023). The presence of a mildly relativistic outflow in a sub-Eddington (|$\dot{M} \lesssim 0.1\, \dot{M}_{\rm Edd}$|) source would be a strong evidence for a magnetic drive (see e.g. Chakravorty et al. 2016, 2023; Fukumura et al. 2021).
MAXI J1810−222 (hereafter J1810) was discovered on 2018 November 29 by MAXI (Negoro et al. 2018) and observed by NuSTAR during a soft spectral state. No evidence of X-ray pulsations or type-I bursts in the light curve (Oeda et al. 2019). Around 2019 August, Swift/BAT survey data showed an increase in its hard X-ray emission, from which a radio/X-ray monitoring campaign with the Australia Telescope Compact Array (ATCA) and Swift/XRT was triggered. The results of this 2-yr long multiwavelength campaign have been reported in Russell et al. (2022, hereafter R22). From the X-ray spectral-timing properties and the radio behaviour, these authors argued that J1810 is a relatively distant (>8 kpc) black hole candidate (BHC) with a very peculiar outburst behaviour. Indeed, unlike most BHTs, J1810 was discovered in a soft state and does not follow the canonical hardness–intensity diagram (HID) since it goes back and forth from the hard to the soft state several times (across intermediate states; R22). At the time of writing this paper, a new X-ray/radio campaign is ongoing, since surprisingly (after about 4 yr) J1810 is still active making it a BHC with years-long outburst.
In R22, we presented only three NICER observations representative of the different spectral states, in order to explore the overall variability properties of the source. Here, we exploited a large sample of NICER observations to focus on narrow spectral features and their response to the continuum variations.
2 OBSERVATIONS AND DATA ANALYSIS
We analysed all NICER public data collected from 2019 February 11 until 2020 September 25 (Target IDs 120056, 220056, 320056) for a total of 75 observations (ObsID). From this data set, we vizually inspected the light curves and excluded seven pointings (220056-0105/0106/0107/0108/0112, 2200560142, 3200560131) affected by background bright flares. We reprocessed the NICER data using heasoft version 6.29c and the NICER Data Analysis Software (nicerdas) version 8 with Calibration Database (caldb) version xti20210707. Spectra were extracted adopting standard calibration and screening criteria (the hot detectors 14 and 34 have been additionally excluded) using the tool nicerl2. The background spectrum was obtained using the nibackgen3C50 tool.
We verified that our results are fully consistent with those obtained by using the SCORPEON background and the most recent NICER calibrations (xti20221001) and pipeline (nicerl3-spect), that have been released during the submission phase of this manuscript.
2.1 Individual spectra
First, we modelled the spectrum of each ObsID with an absorbed accretion disc plus power law (tbabs(diskbb + po) in xspec). We applied a uniform 1 per cent systematic error to all spectra. We found a strong spectral feature at ∼1 keV in the residuals which can be well fitted with an absorption Gaussian line (gabs in xspec). We noticed that the energy of the absorption line as well as the depth are variable. In particular, the line energy spans (accounting for the uncertainties) from 0.84 to 1 keV, while the depth varies from 0.03 keV up to 0.21 keV.
We checked whether this feature could be instrumental however we notice that, it has been also found in the Swift/XRT spectra (both in PC and WT modes) obtained by stacking all XRT data (presented in R22) in the intermediate state (see online material). In Fig. 1, we show the long-term light curve (top) and the HID (bottom) where each point corresponds to a single NICER ObsID. The total background subtracted count rate is extracted in 0.5–10 keV, while the hardness (HR) is the ratio between the rates in the 1.5–10 and 0.5–1.5 keV bands. It is worth noticing that the HID of J1810 shows a peculiar pattern with respect to the q-track shape observed usually in BHTs, as also pointed out in R22.
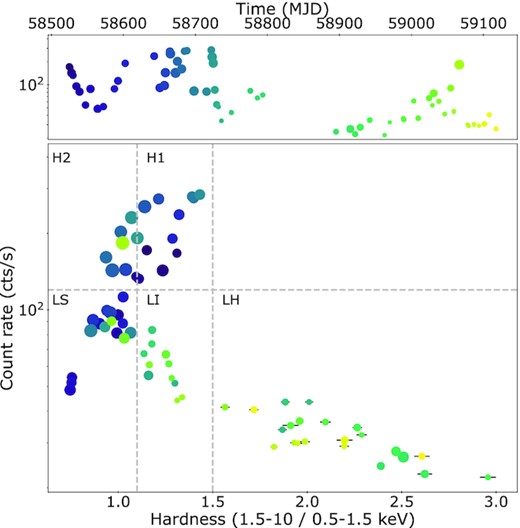
The NICER light curve (top) and the HID (bottom) of J1810 are plotted (see Section 2.1). The time evolution is colour coded from violet to yellow. The size of the points in the HID and light curve refers to the depth of the absorption line derived from the spectral fits. The grey lines refer to the extraction of the five HID-resolved average spectra (see Fig. 2).
The size of the points in the HID and light curve (Fig. 1) refers to the depth of the absorption line derived from the spectral fits. It can be noted that the depth value of the absorption line is connected to the spectral hardness: it is stronger in the soft spectra (LS) than in the hard ones (LH). This value is (almost) the same in the spectra in the high-flux branch (H1 and H2).
2.2 Stacked spectra
An accurate characterization of the line feature requires a strong detection and thereby, high signal-to-noise ratio spectra. We thus selected a total of five regions on to the HID from which we extracted the corresponding averaged spectra. The limits of the boundary regions (grey lines in Fig. 1, bottom) were chosen in order to take into account both the flux and the HR, as well as to ensure a sufficient count statistics per spectrum. We named the regions with flux lower than 120 ct s−1 as low soft (LS), low intermediate (LI), and low hard (LH) depending on their HR (see Table 1). Then, the two regions with high flux (above 120 ct s−1) have been called High 1 (H1) and High 2 (H2).
HR and flux limits to select the five regions in the HID. We report the best-fitting parameters in last three column: the inner disc blackbody temperature (kTin), energy, and depth of the absorption line. The electron temperature of the Comptonization component has been frozen at the best-fitting values reported in R22 (see text).
| State | HR | Flux | kTin | Eline | Depth |
|---|---|---|---|---|---|
| (cts−1) | (keV) | (keV) | (keV) | ||
| H1 | >1.1 | >120 | 0.49 ± 0.01 | 0.96 ± 0.01 | 0.13 ± 0.02 |
| H2 | ≤1.1 | >120 | 0.37 ± 0.01 | 0.97 ± 0.02 | 0.15 ± 0.02 |
| LS | ≤1.1 | ≤120 | 0.3 ± 0.01 | 0.95 ± 0.01 | 0.12 ± 0.02 |
| LI | >1.1; ≤1.5 | ≤120 | 0.39 ± 0.01 | 0.93 ± 0.01 | 0.06 ± 0.01 |
| LH | >1.5 | ≤120 | (0.2) | 0.90 ± 0.02 | 0.06 ± 0.02 |
We obtained five stacked spectra which have been modelled with a disc blackbody emission plus a thermal Comptonization component (nthcomp in xspec, Fig. 2, top panel). The electron temperature parameter (kTe) of the Comptonization was frozen to the values found with the Swift/BAT hard X-ray spectra (R22), i.e. 15 keV in H1 and H2, 30 keV in LS and LI, and 50 keV in LH. The seed photons temperatures were tied to the inner disc blackbody temperature parameter (see Table 1). The NICER spectra show a strong P-Cygni-like spectral feature around 1 keV which clearly decreases towards the hard spectrum (see Fig. 2, middle panel). We also observed weaker features at 1.3–1.5 keV and at 2 keV. We then included the gabs component to fit the 1 keV feature and obtain the best-fitting parameters [|$\chi ^{2}_{\rm red}$|(d.o.f.) = 1.2(591]; see Table 1 and residuals in Fig. 2, bottom panel). Uncertainties are given at the 90 per cent confidence level. In the hard spectrum, the temperature of the seed photons from the disc has been frozen to 0.2 keV. It is worth noticing that, despite the HR values, H1 is the softest spectrum due to the fact that above 1.5 keV the disc contribution is still high with respect to the Comptonization component. The value for the neutral absorption column is always found consistent with the expected Galactic value (∼0.9 × 1022 cm−2).
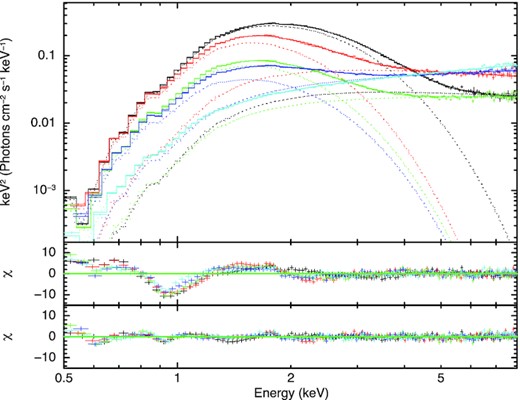
Spectral continuum modelling of the five NICER HID-based stacked spectra (see Fig. 1). From top to bottom progressively harder spectra are shown (top panel). In the middle panel, the residuals obtained from the continuum fitting are shown. The energy centroid of the 1 keV feature decreases towards the hard state. Residuals of the best-fitting continuum + gaussian model are shown in the bottom panel.
Importantly, the 1 keV feature varies in centroid and in depth (see Table 1) and it is highly correlated with the spectral state (as we also find with a more physical model, see Section 4). This most likely rules out any origin caused by a bad modelling of the interstellar medium. Moreover, the slow (daily) flux variation and the corresponding response of the feature suggest that plasma is likely in photoionization equilibrium.
3 PHOTOIONIZATION MODELLING
We performed a photoionization modelling to derive physical parameters from the absorption feature. To this aim, we used spex which provides a faster photoionization calculation (xabs component) compared to other codes (such as xstar in xspec).
Once we obtained the best-fitting continuum model for each of the five stacked spectra with similar models as in xspec, i.e. dbb + comp in spex, we extrapolated it down between the optical band (10−4 keV) and the hard X-rays (100 keV), to build a spectral energy distribution (SED) broad enough (see online material) to compute the photoionization balance with the task XABSINPUT.
This photoionization balance links the gas temperature (kT) and the ionization state of the plasma characterized by the ionization parameter ξ = L/nHR2, where L is the ionizing luminosity of the source, nH is the plasma volume density, and R is its distance from the ionizing source. We also computed the stability curves for each SED, which show the relationship between the temperature and the pressure ratio (see Fig. 3). The latter is defined as the ratio between the radiation and the thermal pressure which results in |$\Xi = 19\, 222 \, \xi /T$| (Krolik, McKee & Tarter 1981). These curves are very useful because at positive (negative) slopes the irradiated plasma is in a stable (unstable) solution (see however Petrucci et al. 2021 regarding the potential caveats when computing these stability curves).
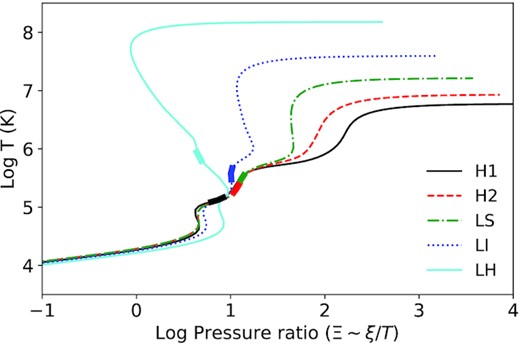
The stability curves of the five HID-resolved NICER spectra. Thicker segments show the (T−Ξ) ranges of the best-fitting solutions.
3.1 Spectral fitting
The output file produced by the XABSINPUT task is used by the xabs model to make a list of absorption lines for each element ion and fit the spectrum. This allowed us to characterize the absorption features. The main parameters of xabs are: the column density, NH, ionization parameter, ξ, line-of-sight velocity VLOS, and velocity dispersion or line width, Vσ. Given the low spectral resolution, we assumed Solar chemical abundances.
To avoid getting stuck into local minima of the χ2 distribution, we performed a multidimensional scan in the VLOS–log ξ parameter space (Pinto et al. 2021). Fig. 4 shows the results for the H2, LI, and LH NICER spectra assuming a velocity dispersion of Vσ =10 000 km s−1. These are consistent with those obtained with 100 and 1000 km s−1 because at 1 keV NICER lacks the spectral resolution necessary to resolve individual lines. The colour in Fig. 4 is coded according to the χ2 improvement on top of the spectral continuum (Δχ2). The velocities are negative, i.e. blueshifts corresponding to outflows. The Δχ2 are large indicating a very high significance, well above 5σ, even accounting for the look-elsewhere effect implying that there is no need to perform dedicated Monte Carlo simulations.
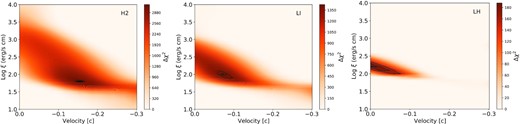
Results from the multidimensional scan with the model grids for the spectra from the H2, LI, and LH epochs (left to right, respectively). Reported are the xabs improvements to the continuum-only fits. The three black solid lines indicate 1σ, 2σ, and 3σ contours for two free parameters (ξ, vLOS).
Thereafter, to determine the plasma parameters, we refit the five averaged spectra with the xabs model starting from the best-fitting solutions obtained by the grids. The residuals around 1 keV have been significantly decreased including those at other energies implying that multiple features are described (see Fig. 5). Further minor residuals are left likely due to a more complex plasma structure or the presence of rest-frame emission lines (i.e. a P-Cygni profile). Moreover, the stacking of spectra from the same HID region may have also broadened the absorption measure distribution of the photoionized absorber. In Table 2, we show the main xabs parameters from the best fits.

Results from best-fitting photoionization model. The unabsorbed X-ray and Bolometric luminosities are computed between 0.3–10 and 0.001–1000 keV. Xabs parameters are the column density, NH, ionization parameter, ξ, line-of-sight velocity VLOS, and velocity dispersion or line width, Vσ.
| State | Lxa | Lbola | NH | Log ξ | vσ | |$v_{\, \rm LOS}$| |
|---|---|---|---|---|---|---|
| 1037 ergs−1 | 1021 cm−2 | ergs−1 cm | 0.1c | 0.1c | ||
| H1 | 1.29 | 1.56 | 4.68 ± 0.05 | 1.72 ± 0.01 | 0.90 ± 0.04 | 1.26 ± 0.01 |
| H2 | 1.06 | 1.4 | 7.75 ± 0.49 | 2.10 ± 0.10 | 1.39 ± 0.07 | 1.13 ± 0.09 |
| LS | 0.44 | 0.6 | 7.29 ± 0.23 | 2.33 ± 0.04 | 1.18 ± 0.04 | 0.40 ± 0.03 |
| LI | 0.36 | 0.6 | 4.88 ± 0.39 | 2.30 ± 0.11 | 0.93 ± 0.07 | 0.31 ± 0.17 |
| LH | 0.16 | 0.7 | 3.36 ± 0.51 | 2.22 ± 0.04 | 0.54 ± 0.16 | 0.09 ± 0.09 |
luminosities are reported without uncertainty given that the statistical error (a few per cent) is much smaller than that on the distance (adopted at 8 kpc).
4 RESULTS AND DISCUSSION
We have found a strong feature in the NICER spectra of J1810 which we interpret as a blend of blueshifted Fe l, Ne x, or O viii absorption lines. This is confirmed by the ionic column densities yielded by xabs for log ξ ∼ 2. In Fig. 6, we show the trend of the main best-fitting xabs parameters with the source spectral state, as a function of the X-ray luminosity. In agreement with the results of the empirical line analysis (see Section 2.2), the plasma state significantly varies with the source spectral state. The high-flux states are characterized by a highly significant solution which indicates a hot plasma outflowing at >0.1c, which is unlikely for classical Galactic X-ray binary (XRB) thermal winds (vXRB < 1000 km s−1, i.e. ∼0.0033c, see Tomaru et al. 2019) and must involve either strong radiation pressure as for winds in Ultra Luminous X-ray sources (ULXs; see Pinto, Middleton & Fabian 2016) or (most likely) magnetically driven winds. However, a ULX nature of J1810 is unlikely given the hard spectra observed. In addition, a ULX nature would require a distance of about 100 kpc which is outside the Galaxy.
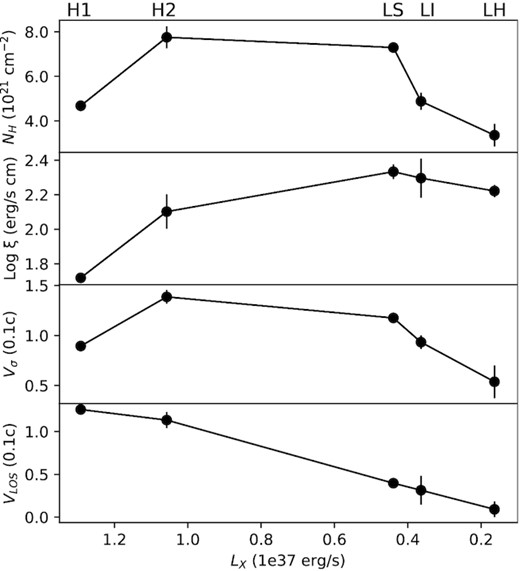
Best-fitting parameters of the outflowing plasma component (xabs) for the five NICER spectra sorted according to the X-ray 0.3–10 keV luminosity. The X-axis is inverted following the HID evolution from high-soft to low-hard states (see Fig. 1).
In the LS and LI states the derived velocities, albeit lower, are still extreme for a thermal wind. However, in the hard state the outflow is much weaker, due to a low NH, and slower, similarly to thermal winds in XRBs.
The changes of the wind properties between the different spectral states of the source might be related to the thermal instability of the plasma since the (T, ξ, Ξ) solution for the hard state is on the edge between the stable and unstable branches with 1 < log ξ < 3, corresponding to temperatures 105 < T < 107 K (see Fig. 3, right-hand panel). It is worth noticing that the LOS velocity (if associated with the terminal velocity) should be higher than the velocity dispersion, which is not always the case in our results. This is likely due to the lack of spectral resolution of NICER or the spectral stacking and therefore the absolute values should be taken with caution.
On the other hand, the variability of the wind parameters may be due to a different configuration of the magnetic field and launching radius. For instance, if we assume that the outflow speed equals the escape velocity (|$v_{\rm esc}=\sqrt{2GM/R}$|), we estimate that all, but one, spectra have launching radius between 100 and 2000 Rg (progressively increasing from the H1 to the LI state). The large value of 24 000 Rg derived in the LH state might be an overestimation due to the line weakness (see contours in Fig. 4) although it would be close to the expected range of values for a thermally driven wind (Begelman et al. 1983). From the definition of the ionization parameter, we estimate density decreasing from 8 × 10¹⁸ to 3 × 1013 cm−3, which are densities that range from XRB inner disc to typical XRB outflows (Bianchi et al. 2017). These are likely upper limits on the density as the outflow may be launched at larger radii and accelerated to the observed velocities by the magnetic fields. Upper limits on the outflow distance can be derived by considering the wind thickness, |$\Delta \, R\le R$|, and the ionization parameter definition, |$\xi = L/n_\mathrm{ H} R^2 = L/(n_\mathrm{ H} R \Delta \, R) \cdot \Delta \, R/R \ \lt \ L/(n_\mathrm{ H} R \Delta \, R) = L/(N_\mathrm{ H} R) \rightarrow R \,\lt \ L/(\xi N_\mathrm{ H})$|. Upper limits ranging from a few 106RG to 107RG are obtained.
The launching radius, as estimated from the assumption of escape velocity, increases towards LH, following the evolution of the innermost radius of the optically thick Shakura–Sunyev disc (SAD; that reaches almost 100 Rg in the hard state; see e.g. Done, Gierliński & Kubota 2007 and references therein). Alternatively, the decrease of both outflow velocity and column density in the hard state may be due to an increase in the collimation of the outflow, thus becoming a jet.
The outflow rate is defined as |$\dot{M}_w = 4 \, \pi \, R^2 \, \rho \, v_w \, \Omega \, C$|, where Ω and C are the solid angle and the volume filling factor (or clumpiness), respectively, |$\rho =n_{\rm H} \, m_p \, \mu$| is the gas density and R is the distance from the ionizing source. In the two high-flux spectra, the outflow rate appears mildly super-Eddington (2–7 |$\dot{\rm M}_{\rm Edd}$|, assuming MBH = 10 |$\rm {\rm M}_{\odot }$|, efficiency 10 per cent and C = 0.1). This may remove most of the material, perhaps explaining the transition to the low-flux states where both the accretion and outflow rates are much smaller (0.1–0.2 |$\dot{\rm M}_{\rm Edd}$|). Such a value would still require an accretion rate of |$0.1 \, \dot{\rm M}_{\rm Edd}$|, which would correspond to an intrinsic luminosity of 1038 erg s−1 for a BH, suggesting that the source is even more distant, i.e. at 20–30 kpc. Although slightly high, our estimates of |$\dot{M}_w$| are comparable with results from magnetohydrodynamic (MHD) calculation of magnetically driven winds in other BHTs by Fukumura et al. (2021).
If we assume both solid angle and covering fraction of about 0.1, which are typical for extreme outflows (e.g. Pinto et al. 2021, although the latter can be as low as 0.01, see e.g. Kobayashi et al. 2018), we estimate an outflow kinetic power (|$L_w = 1/2 \, \dot{M}_w \, v^2$|) between 1038 erg s−1 (H1) and 1034 erg s−1 (LH). This corresponds to, approximately 10 to 0.01 LBol (Table 2), which means that the outflow dominates the energetic budget in the soft state (both at high and low flux) and it decreases towards the hard state (Lw ∼ 1 per cent). Noteworthy, such an evolution is qualitatively consistent with the JED–SAD framework (Ferreira et al. 2006; Petrucci et al. 2010; Marcel et al. 2022 and references therein). While transiting from the soft to the hard state, J1810 would undergo a switch between an optically thick and geometrically thin inner disc launching winds that carry away a significant portion of the released accretion power, to an optically thin and geometrically thick disc where most of the accretion power would be actually advected into the black hole and powering jets, lowering significantly the bolometric luminosity. In MHD outflows, the flow speed at the Alfvén point is comparable to the rotation speed at the disc mid-plane (see e.g. Ferreira 1997). For a wind speed of 0.1c, this provides an anchoring radius R ∼ 100 Rg, with a required B field of at least 105 G. A jet emitting disc (JED, i.e. magnetic corona) is the accretion mode with the highest possible magnetic field value, where the dominant torque (allowing accretion) is that due to the bipolar jets. At R ∼ 100 Rg and for a BH mass of 10 M⊙, a JED would have B = 4 |$\times \ 10^{5} (\dot{m})^{1/2}$| G, where |$\dot{m} = \dot{M} c^{2}/L_{\mathrm{ Edd}}$| is the normalized disc accretion rate at that same radius (Petrucci et al. 2010). Considering that we do not have a firm estimation of the distance, this would result in a B field intensity of 104–5 Gauss for J1810.
Finally, based on the high-outflow speeds (between 0.03c and 0.05c) derived by lines detection, magnetically driven winds have been claimed in other BHTs, e.g. IGR J17091−3624 (King et al. 2012), 4U 1630−472 (King et al. 2014) and GRS 1915+105 (Miller et al. 2016). The latter and J1810 show both a years-long outburst, while the other two show recurrent and frequent outbursts, thus indicating that the secular mass accretion rate should be higher in these systems when compared to a typical BHT. However, the maximum value of the wind velocity in J1810 is about three times faster (i.e. 0.1c) indicating a more efficient launching mechanism. An in-depth theoretical work combined with an observational study of a larger sample of ultrafast outflows in XRBs would place better constraints on the outflow mechanism.
SUPPORTING INFORMATION
suppl_data
Please note: Oxford University Press is not responsible for the content or functionality of any supporting materials supplied by the authors. Any queries (other than missing material) should be directed to the corresponding author for the article.
ACKNOWLEDGEMENTS
MDS, CP, AD, SEM, FP, TDR acknowledge support from the INAF grant no. ‘ACE-BANANA’. CP acknowledges support from AHEAD2020 project (grant agreement no. 871158). AM was supported by the H2020 ERC Consolidator Grant no. ‘MAGNESIA’ (PI: Rea) and National Spanish grant no. PGC2018-095512-BI00. AD acknowledges funding from the contract ASI/INAF no. I/004/11/4. POP and JF acknowledges financial support from the French National High Energy Programme from INSU/CNRS and from CNES.
DATA AVAILABILITY
All data used in this work are publicly available on the HEASARC NICER archive. The codes for the multidimensional scan and the production of photoionization model grids are publicly available at https://github.com/ciropinto1982.
