


ABSTRACT
We report on analysis of observations of the bright transient X-ray pulsar (XRP) Swift J0243.6+6124 obtained during its 2017–2018 giant outburst with Insight-HXMT, NuSTAR, and Swift observatories. We focus on the discovery of a sharp state transition of the timing and spectral properties of the source at super-Eddington accretion rates, which we associate with the transition of the accretion disc to a radiation pressure dominated state, the first ever directly observed for magnetized neutron star. This transition occurs at slightly higher luminosity compared to already reported transition of the source from sub- to supercritical accretion regime associate with onset of an accretion column. We argue that this scenario can only be realized for comparatively weakly magnetized neutron star, not dissimilar to other ultra-luminous X-ray pulsars, which accrete at similar rates. Further evidence for this conclusion is provided by the non-detection of the transition to the propeller state in quiescence which strongly implies compact magnetosphere and thus rules out magnetar-like fields.
1 INTRODUCTION
The transient binary X-ray pulsar (XRP) Swift J0243.6+6124 was first discovered on 2017 October 3 (Kennea et al. 2017), and for a few months exhibited one of the brightest outbursts ever observed from a transient XRP with a peak flux of ∼3 × 10⁻⁷ erg s−1 cm−2. Pulsations with steadily decreasing period of about 9.8 s (Jenke & Wilson-Hodge 2017; Kennea et al. 2017) implied accretion on to the neutron star from its Be companion (Kouroubatzakis et al. 2017). Despite the identified counterpart, the distance to the source remains uncertain. For the rest of the paper we adopt a distance of 6.8 kpc as reported in Bailer-Jones et al. (2018) based on Gaia DR2 parallax measurements of the companion star. We emphasize, however, that even the lower limit of ∼5.5 kpc obtained from Gaia’s measurements and based on the observed spin-up rate of the neutron star (Doroshenko, Tsygankov & Santangelo 2018; van den Eijnden et al. 2018b), implies that the source is an ultra-luminous pulsar with X-ray luminosity larger than ∼1039 erg s−1 (Tsygankov et al. 2018).
Another interesting feature of the source was unveiled by radio observations, which confirmed emission correlated with the X-ray flux close to the peak of the outburst. This was associated by van den Eijnden et al. (2018b) with an evolving jet, one of the first ever observed from magnetized neutron stars, although radio emission was also observed at later stages of the outburst at significantly lower luminosities (van den Eijnden et al. 2018a,b).
Similarly to other ultra-luminous X-ray pulsars (ULPs) the magnetic field of Swift J0243.6+6124 is not measured directly. No evidence for a cyclotron resonant scattering feature (see Staubert et al. 2019 for a recent review), which would allow to unambiguously measure the magnetic field of the neutron star, has been reported in the 3–80 keV energy band observed by NuSTAR (Jaisawal, Naik & Chenevez 2018; Tao et al. 2019), nor in the Insight-HXMT observations in the 2–150 keV energy range (Zhang et al. 2019). Other arguments thus had to be invoked to estimate the source’s magnetic field. The observed change of the pulse-profile shape in the soft band, and of the pulsed fraction in the hard band prompted Doroshenko et al. (2018) to conclude that the source switched from the sub- to the supercritical accretion regime (Basko & Sunyaev 1976) at a luminosity of ∼1038 erg s−1, implying that the neutron star has a magnetic field of ∼1013 G, i.e. slightly higher than that usual for accreting pulsars. A similar conclusion was reached by Wilson-Hodge et al. (2018) based on the monitoring of the source with NICER and Fermi/GBM, which revealed peculiar features in the dependence of source’s X-ray colours on luminosity both in the soft and hard bands. Both features, despite the significant difference of the luminosity at which they occurred, were associated with the transition from the sub- to the supercritical accretion and with onset of an accretion column (Wilson-Hodge et al. 2018). Independently, since the source continued to accrete at a luminosity of ∼6 × 1035 erg s−1 without switching to the ‘propeller’ regime (Illarionov & Sunyaev 1975), Tsygankov et al. (2018) estimated an upper limit for the magnetic field of ∼6 × 10¹² G, a value barely consistent with other estimates.
Here, we present the timing analysis of observations of Swift J0243.6+6124 obtained during the source’s 2017–2018 outburst with the Insight-HXMT satellite (Li 2007). We also present observations taken during the following quiescence phase with the NuSTAR mission (Harrison et al. 2013). Based on this analysis, we report the detection of a striking change of the aperiodic variability properties, pulse profile morphology, and energy spectrum of the source at a luminosity of LX ∼ 4.4 × 1038 erg s−1, which we associate with the transition of the inner regions of the accretion disc from the standard gas pressure dominated (GPD) to the radiation pressure dominated (RPD) state. At this point the disc pushes close enough to the neutron star to make local luminosity of inner disc regions large enough to dynamically affect disc structure by radiative pressure (Shakura & Sunyaev 1973). This affects the observed X-ray spectrum, aperiodic variability originating within the disc, and coupling of the disc with magnetosphere of the neutron star reflected by change of the observed pulse profiles from the pulsar. In addition, also the already reported transition from sub- to supercritical accretion regime is observed.
A second important and rather surprising result of our analysis is the discovery of accretion powered X-ray emission from the source in deep quiescence, months after the main outburst, at a luminosity as low as ∼3 × 1034 erg s−1. A coherent explanation of our findings and of the phenomenology already reported in literature unambiguously shows that the accretion disc extends unusually close to the compact object both in quiescence and outburst. We therefore conclude that the source’s magnetic field is likely weaker than previously argued. The rest of the paper is organized as follows: the details of the analysis are presented in Section 2 which is followed by interpretation of individual observational findings and their implications in Section 3, and conclusions in Section 4.
2 OBSERVATIONS AND DATA ANALYSIS
2.1 NuSTAR and Swift/XRT
The source had been observed with NuSTAR on several occasions (Tao et al. 2019), however, here we focus exclusively on the most recent observation after transition to quiescence. The observation was specifically aimed to improve the upper limit of the magnetic field by Tsygankov et al. (2018), and was conducted following the rapid decline of the flux revealed by Swift/BAT monitoring of the source on MJD 58557 (80 ks exposure, observation id. 90501310002).
The data reduction was carried out using standard procedures using the nustardas_06Jul17_v1.8.0 package and most updated calibration files. Since the source has been clearly detected in images of both NuSTAR telescopes, to improve counting statistics we combined data of both units to perform timing and spectral analysis. In particular, we concatenated filtered event lists for timing, while spectra from the two units were extracted and modelled independently and co-added using the addspec tool for plotting only.
To extract source and background spectra and light curves, we used circular extraction regions with radii of 80 and 200 arcsec centred on the source and close to the edge of the field of view on the same detector chip. The source extraction radius was optimized to achieve the best signal-to-noise ratio above 40 keV using the procedure described in Vybornov et al. (2018). The light curves were also corrected to solar barycentre and for the motion of the binary system using the ephemerides provided by Fermi GBM.1
The main goal of the observation was to determine whether accretion continues and the source continues to pulsate. To search for pulsations we used Z2 statistics (de Jager, Raubenheimer & Swanepoel 1989) on event data and the procedure described in Doroshenko, Santangelo & Ducci (2015) to avoid loss of sensitivity due to binning of the light curves. A significant peak with |$Z^2_1\sim 22.4$| around the expected frequency (P ∼ 9.7946(1) s) was detected as shown in Fig. 1. Even without considering that the most significant peak appears exactly at the expected spin frequency, the corresponding chance detection probability for one harmonic and 104 trial frequencies is ∼10−11 (de Jager et al. 1989), i.e. the peak is highly significant. The folded background-subtracted 3–80 keV light curve reveals a single peaked pulse profile with pulsed fraction of ∼20 per cent which strongly suggests that the source continues to accrete (see Fig. 1).
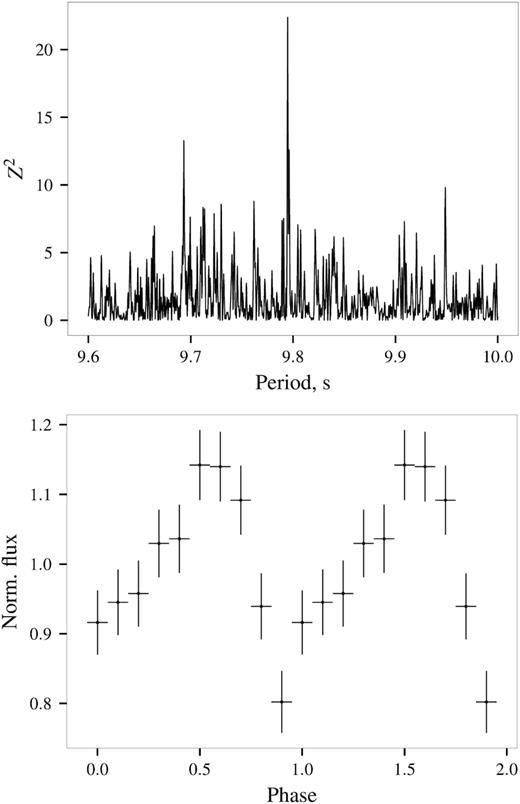
Top: A periodogram for event arrival times for NuSTAR observation 90501310002 (80 arcsec extraction radius, 3–80 keV band). Bottom: Background-subtracted light curve for NuSTAR observation 90501310002 in 3–80 keV band folded with best-fitting period. The pulse profile is plotted two times for clarity.
The energy spectrum of the source in quiescence remains hard and is well described with a cut-off power law (cutoffpl in xspec) with no additional components, which also points to continued accretion (see Fig. 2). Interstellar absorption was not required by the fit but was included in the model fixed to interstellar value of 9 × 10²¹ atoms cm−2 for consistency with Swift/XRT (Willingale et al. 2013; Tsygankov et al. 2018). The best-fitting statistics of χ2 ∼ 99 for 104 degrees of freedom indicates the good quality of the fit. Best-fitting photon index and cut-off energy are 1.0(1) and 12.5(2) keV, respectively (1σ confidence level). The bolometric model flux (calculated for 0.1–200 keV energy range based on the fit in 3–80 keV energy band) turns out to be 5.5(3) × 10−12 erg s−1 cm−2, a factor of 20 smaller compared to previously published limit (Tsygankov et al. 2018).
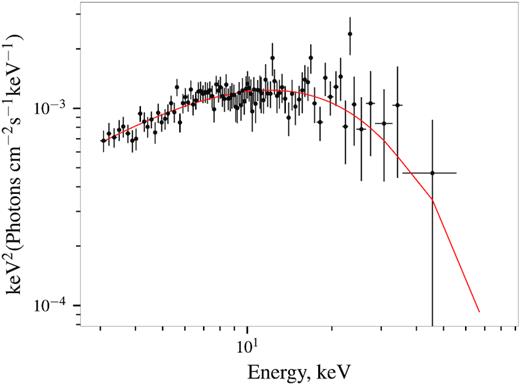
Broad-band energy spectrum of the source as observed by NuSTAR in quiescence unfolded with best-fitting model and multiplied by energy squared.
We also monitored the declining phase of the outburst with Swift/XRT, which observed the source at even lower fluxes. The Swift/XRT light curve in 0.5–10 keV band was obtained using the service provided by the Swift data centre (Evans et al. 2009)2 by fitting spectra of individual observations (see e.g. Tsygankov et al. 2016). In total 44 observations from MJD 58207 to 58748 with total exposure of ∼70 ks were considered in this analysis. The absorption column was not well constrained in all observations, so we fixed it to the interstellar value of 9 × 10²¹ atoms cm−2 (Willingale et al. 2013). This approximation does not significantly affect the flux estimates since the final bolometric flux estimate was obtained by comparing the measured source fluxes in the 0.5–10 keV range with the simultaneous NuSTAR observations. This comparison revealed good agreement and that the soft band flux accounts for ∼43 per cent of the total flux. For observations after MJD 58557.5 (i.e. the last NuSTAR observation) we assumed the continuum to be the same as revealed by NuSTAR and only considered flux as a free parameter. The resulting light curve is presented in Fig. 3. As evident from the light curve, the source brightness continued to decrease after NuSTAR observation, reaching as low as ∼6 × 1033 erg s−1, however, the counting statistics in short XRT pointings (1–2 ks) is not sufficient to detect pulsations or even robustly detect potential spectral softening. We cannot therefore definitively claim that the source continued to accrete also after NuSTAR observation. On the other hand, the observed flux variability would be hard to explain otherwise, so it is quite possible that accretion continues even at lower rates than revealed by NuSTAR.
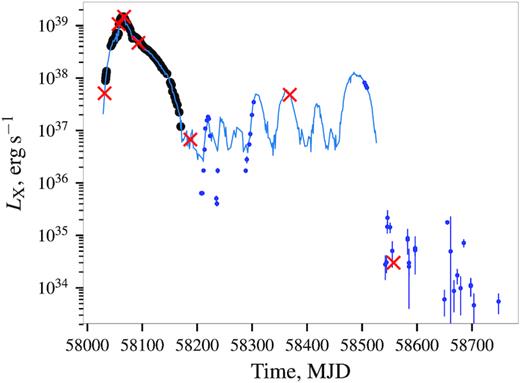
Long-term bolometric light curve of Swift J0243.6+6124 as observed by Insight-HXMT (black points), Swift/BAT (blue line), Swift/XRT (blue points), and NuSTAR (red crosses). The dimmest NuSTAR observation marks a hard upper limit on luminosity of ‘propeller’ state, however, accretion likely continues even at lower rates as follows from the observed flux variability revealed by Swift/XRT at later stages.
Finally, we also obtained the power spectrum of the source to characterize variability in quiescence. As shown in Fig. 5, the power spectrum at low luminosities is consistent with a broken power law with a break at 0.19(2) Hz. The observed aperiodic variability thus also unambiguously shows that the source continues to accrete. Since the observed break frequency is higher than the spin frequency by a factor of 2, we deduce that the time-scale of the variability relative to the break is not directly related to the Keplerian time-scale at the inner edge of the disc, expected to be about the spin period at such low luminosity. Unfortunately, the available statistics does not allow a more detailed timing analysis, e.g. searching for possible QPOs or investigating the energy dependence of the pulse profiles.
Based on the detection of the pulsations, observed hard energy spectrum, and aperiodic variability properties, we conclude thus that the source continues to accrete at very low luminosity.
2.2 Insight-HXMT
The Hard X-ray Modulation Telescope (HXMT) named ‘Insight’ after launch on 2017 June 15 from Jiuquan launch centre is China’s first X-ray astronomy satellite (Li 2007; Zhang et al. 2014). The three main instruments on-board are the high-energy X-ray telescope (HE) boasting effective area of ∼5100 cm2 between 20 and 250 keV, the medium energy X-ray telescope (ME) operating in 5–30 keV (effective area 952 cm2), and the low-energy X-ray telescope (LE) operating in 1–15 keV with effective area of 384 cm2 (Zhang et al. 2014).
Insight-HXMT provides an unprecedented view of the phenomenology of the source at high luminosity. With a total exposure of ∼835 ks accumulated in 98 pointings over the period from MJD 58033 to MJD 58112, observations of Swift J0243.6+6124 constitute the first major observational campaign of the mission. A thorough analysis of all observations is ongoing and will be presented elsewhere. Here, we focus exclusively on the timing analysis of the HE instrument. With a total effective area of 5100 cm2 between 20 and 250 keV, it is the main instrument of Insight-HXMT offering high time resolution (0.012 ms) and low dead-time even for very bright sources (Zhang et al. 2014). The instrument also provides high counting statistics with source count-rate peaking at ∼2900 counts s−1 for Swift J0243.6+6124 (and down to ∼150 counts s−1 in dimmest observations). This makes the HE an ideal tool for timing studies, so we used it for timing analysis. We have verified, however, that similar results can be obtained with ME detector, although quality of resulting power spectra is lower due to the lower effective area and shorted good time intervals associated with higher in-orbit background. For more details on HXMT and performance of individual instruments please refer to Zhang et al. (2014). The data analysis was performed with hxmtdas v2.01 following the recommended procedures in the user’s guide.3 More detail on data analysis for Swift J0243.6+6124 can be found in Zhang et al. (2019).
The long-term light curve of the source as observed by Insight-HXMT, Swift/BAT, and NuSTAR is presented in Fig. 3. The fluxes for Insight-HXMT are estimated based on the broad-band spectral analysis 2–150 keV energy range of individual observations by Zhang et al. (2019) and adopted here from that publication. The values appear to be in line with the Swift/BAT count rate, which can be robustly converted to luminosity using the multiplicative factor of ∼8.2 × 1038 (for a distance of 6.8 kpc). Note that we omit errorbars for BAT points in Fig. 3 for clarity, but those are rather large, i.e. the light curve is in excellent agreement (within uncertainties) with other instruments throughout the outburst. The NuSTAR and Swift/XRT fluxes deduced from the spectral analysis in 3–80 and 0.5–10 keV energy range are also consistent with those of Insight-HXMT once the bolometric correction estimated based on the best-fitting model is taken into the account. For instance, for the nearly simultaneous observation close to the peak of the outburst (i.e. on MJD 58067), the flux measured by NuSTAR and HXMT agree to within ∼5 per cent which is comparable with flux variations observed within individual observations.
The timing analysis is based on the background-subtracted light curves in the 20–80 keV energy band, with the time resolution of 5 ms, extracted by combining detected counts from all non-masked HE instrument modules. Data of the masked detector are used to estimate the background. For all observation, the cosmic background component is negligible compared to the source flux and therefore has been ignored. The light curves were corrected for dead-time (not exceeding 10 per cent), the effects of the orbital motion of the satellite and for the binary motion assuming the ephemerides obtained by the Fermi GBM pulsar team.4 For each observation, we searched for pulsations, and determined the period value using the phase-connection technique (Deeter, Boynton & Pravdo 1981). The spin evolution observed by Insight-HXMT was found to be consistent with that revealed by the Fermi GBM (Zhang et al. 2019).
To investigate the evolution of the pulse profile shape with luminosity, the obtained profiles were arranged as a function of the flux (Zhang et al. 2019) and aligned with each other using the FFTFIT routine (Taylor 1992). Note that the significant evolution of the pulse profiles with flux implied that we had to use an iterative procedure, going from low to high fluxes and vice versa, until the alignment presented in Fig. 4 was obtained. We emphasize the two major changes of the observed pulse profile shape observed at luminosities of ∼(1.5–4.5) × 1038 erg s−1, in line with findings by Wilson-Hodge et al. (2018).
![Light curve of the source as observed by Insight-HXMT (black points) with colour-shading showing the different states of the source. The relevant transition luminosities marked with horizontal lines in all panels. Transition from the sub- to supercritical luminosity is marked by a dramatic change of the pulse profile shape (second panel, slices at fixed luminosity are pulse profiles scaled to fixed [0,1] range to emphasize shape evolution). Transition of the accretion disc from GDP to RDP state besides a change in pulse profile shape is also accompanied by a change in power spectrum where amplitude of the aperiodic variability increases in 1–10 Hz frequency range (third panel, slices at given luminosity are power spectra multiplied by frequency and scaled as square root to emphasize changes in shape).](https://oup.silverchair-cdn.com/oup/backfile/Content_public/Journal/mnras/491/2/10.1093_mnras_stz2879/1/m_stz2879fig4.jpeg?Expires=1750239641&Signature=pQIb6gTN8gJXM33v1us90-~8L4ZQ9cFiGUVTJbpA1jdSYPoeUQWmqGend3qhVF5FRy9miCurDNQSBL9k-H7Kji5A-Rfl1xuxLwa30-kJCURTjeCEMDlizwBnfNK4tBgeHDh10vwWAXTZFncxJ4kNXWRjWit6h2kvEgIZhZR-XHxJ365aF7RFOes-QdyJHbdNjkJ9DruKFKISL1eyw5T2eBEKzz98Nw~pGYnoeSupMsihT4UF2ykWswk0aUqXyQREetRCD3OgxU6FNYULiUT41QyfGGi83q4Xsl7OwGOrQ0e9LZxaPRxDwueklZw8ca1MriZ~APMPd7OGSP64KmUJJQ__&Key-Pair-Id=APKAIE5G5CRDK6RD3PGA)
Light curve of the source as observed by Insight-HXMT (black points) with colour-shading showing the different states of the source. The relevant transition luminosities marked with horizontal lines in all panels. Transition from the sub- to supercritical luminosity is marked by a dramatic change of the pulse profile shape (second panel, slices at fixed luminosity are pulse profiles scaled to fixed [0,1] range to emphasize shape evolution). Transition of the accretion disc from GDP to RDP state besides a change in pulse profile shape is also accompanied by a change in power spectrum where amplitude of the aperiodic variability increases in 1–10 Hz frequency range (third panel, slices at given luminosity are power spectra multiplied by frequency and scaled as square root to emphasize changes in shape).
High counting statistics also allowed to investigate aperiodic variability in the source. Here, we followed the same approach as Revnivtsev et al. (2009) to suppress the pulsations and enable analysis of the aperiodic noise. In particular, taking into consideration the average length of good time intervals and the source spin period, we split light curves from each observation in segments of ∼300 s corresponding to 30 spin cycles. Each segment was then folded with the spin-period determined for a given observation to obtain an average pulsed light curve, which was then subtracted from the observed light curve. The power spectra of the resulting light curves was then obtained using the powspec program by averaging the power spectra of individual segments. Examples of representative power spectra at different luminosities are shown in Fig. 5. The luminosity dependence of the power spectrum and pulse profiles are better illustrated in Fig. 4 where two distinct regions can be identified.
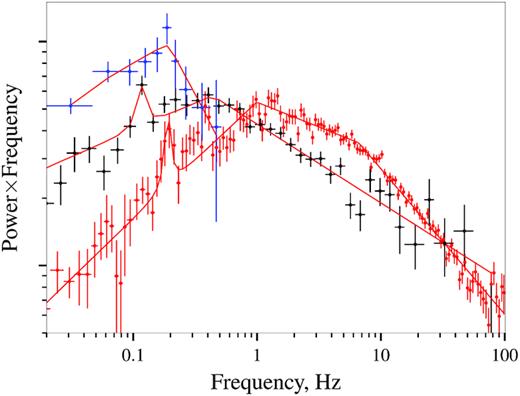
Representative power spectra above (red) and below (black) the transition from GPD to RPD state as observed by Insight-HXMT (arbitrary scaled and multiplied by the frequency to highlight the changes in shape). The low-luminosity power spectrum is obtained by combining observations in LX = (2–4) × 1038 erg s−1 to improve statistics. The second power spectrum is from a single observation slightly above the transition. Estimated white noise and pulsed flux had been subtracted in both cases as described in the text. Note the QPOs feature around 0.1–0.2 Hz. Finally, the power spectrum of the source in quiescence as observed by NuSTAR is also shown (blue points). In the latter case pulsations are not subtracted but do not contribute significantly to the power spectrum.
At low luminosities the power spectrum is well described by a broken power law as typical for magnetic accretors (Revnivtsev et al. 2009; Doroshenko et al. 2014). Besides that, some observations reveal low-frequency quasi-periodic oscillations with frequency of 0.1–0.2 Hz, as already reported by Wilson-Hodge et al. (2018). The dependence of the QPO frequency on the flux has not previously reported, likely due to the shorter duration of NICER observations and more complex pulse profile shape which complicate subtraction of the pulsations and detection of QPOs. On the contrary, the power spectra obtained with Insight-HXMT reveal weak QPOs with luminosity-dependent frequency from ∼50 to ∼200 mHz. We notice, however, that in several of the observations it is difficult to distinguish the feature from the remaining variability associated with the imperfect subtraction of pulsations which makes assessment of the QPO significance rather complicated. On the other hand, without subtraction of the pulsations QPOs are not detected at all as the power spectrum is completely dominated by pulsed flux. We cannot exclude therefore that apparent presence of QPOs is associated with imperfect subtraction of the pulsations. The dynamical power spectrum (see Fig. 4) reveals, however, that the QPO frequency changes with luminosity, which points to the physical nature of the feature. Extrapolation of QPO frequency observed by HXMT to lower luminosities LX ∼ 1037 erg s−1 where similar feature at 50–70 mHz was reported by Wilson-Hodge et al. (2018) also gives consistent values as can be seen in Fig. 6 although no significant QPOs could be detected at this flux level with HXMT. We note that similar features have been reported for other XRPs (Finger, Wilson & Harmon 1996).
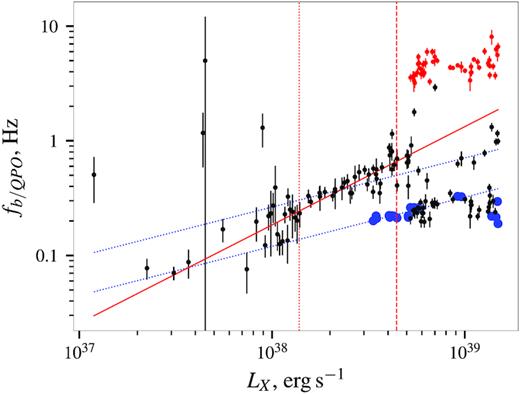
Frequency of the break in the power spectra of the aperiodic variability as function of flux, based on the 20–40 keV Insight-HXMT HE light curves. The black points indicate either the single break (at lower luminosities), or the lower frequency break when the double broken power-law model is required to fit the data. The red points indicate the location of the high-frequency break where present. The blue points indicate the QPO frequency if detected. To guide the eye we included the red and blue lines to indicate power laws with index 6/7 and 3/7, respectively. The vertical lines indicate the fluxes corresponding to dramatic changes of the pulse profile shape (i.e. same fluxes as in Fig. 4).
At higher luminosities, i.e. at high accretion rates, the observed power spectra are different from those at lower luminosities. In particular, a double, rather than single, broken power-law shape is necessary to model the power spectra as shown in Figs 4 and 5. We emphasize that this striking change occurs at a luminosity coinciding with the transition of the observed pulse profile shape, i.e. at ∼4 × 1038 erg s−1.
To quantify the evolution of the observed power spectrum, and particularly of the break frequencies with luminosity, all power spectra were converted to a format readable by xspec (see Ingram & Done 2012 for details). The spectra were then approximated using the double broken power-law model implemented as the bkn2 model in xspec. Subtraction of the pulsations altered the expected white noise level, which was thus determined by including an additional power-law component with flat power index in the model. For each observation, we started the modelling by fixing the first break of the bkn2 model to the spin frequency, and the second break to 10 kHz (i.e. far above the Nyquist frequency) to mimic the single broken power law typically observed from other pulsars. We also included a lorentzian line with width fixed to 0.1 of its central frequency and arbitrary normalization to account for possible QPOs in all observations. The relative width of the feature was fixed to a value chosen based on the analysis of several observations where the width of the QPO feature could be well constrained. The central frequency of the QPO was then searched between 50 and 200 mHz, and the feature was finally included in the fit if the fit statistics improved significantly (i.e. by more than 2σ as calculated using the f-test) for any of the trial frequencies. The same procedure was repeated for the high-frequency break, which was searched in range between 0.1 Hz and 1 kHz. The results are presented in Fig. 6.
We note that the QPO frequency is below the lowest break frequency, by a factor of ∼2–3 similar to what reported for other sources (Finger et al. 1996; Revnivtsev et al. 2009). The dependence on luminosity |$f_{\mathrm{ QPO}}\propto L_X^{3/7}$| is also similar, and in fact, consistent with what predicted from theory if one assumes that the QPO is associated with the Keplerian time-scale, or with the beat frequency between the Keplerian frequency at the inner disc edge and the neutron star’s spin frequency (Finger et al. 1996).
We note that in some of the observations it is difficult to constrain the frequency of the low-frequency break due to the presence of the QPOs, and QPO harmonics at similar frequencies. This is particularly true for brighter observations where QPOs are more prominent. The scatter of the lower frequency break fit values at high luminosities shown in Fig. 6 might thus be simply related to the stability of the fit rather than to some physical variability. The frequency of the break is also poorly constrained by Insight-HXMT at low fluxes since the relatively low statistics makes it hard to distinguish the break from the variable QPO reported by Wilson-Hodge et al. (2018) at 50–70 mHz. Finally, it is clear that in the transition region we misidentify the two breaks for some observations.
Given these limitations, it is hard to draw any robust conclusions regarding the luminosity dependence of the low-frequency break, whether it stays the same throughout the outburst, or drops to lower frequencies above the transition. What is clear, however, is that a sharp change in the observed aperiodic variability properties, coincident with the change of the observed pulse profile shape, occurs at LX ∼ (4–5) × 1038 erg s−1 (see Fig. 4), so we have to conclude that the two transitions are physically related.
3 INTERPRETATION AND DISCUSSION
In this section we summarize and interpret the observational results presented above and in the literature. In particular, we argue that non-detection of the propeller transition in quiescence implies a relatively low magnetic dipole field for the pulsar. In this case the accretion disc, at higher accretion rates, can extend deep into the magnetosphere and has a small inner radius. The energy release within the disc must in this case be substantial, and in fact, sufficient for the transition of the inner disc regions to the RPD state. The transition takes place around MJD 58045 and 58098 in rising and declining parts of the outburst, respectively, and thus is likely responsible for the observed power and energy spectra, and the pulse profile changes. On the other hand, changes in source hardness and pulse profile shape reported by Tsygankov et al. (2018) and Wilson-Hodge et al. (2018) at slightly lower luminosity (i.e. around MJD 58035 and 58139, respectively) can in this case be readily associated with the onset of accretion column. We show that both transitions, the limit on ‘propeller’ transitional luminosity, and observed spin-up rate can only be reconciled if the magnetic field of the neutron star is comparatively weak. Below we discuss our interpretation in more details.
3.1 Non-transition to the propeller regime
3.2 Accretion disc at high luminosities
3.3 Observational evidence for changes in disc structure
From an observational point of view, the transition to RPD state and thickening (or eventual spherization) of the accretion disc can be expected to affect the velocity of matter within the disc and its inner radius (Chashkina et al. 2017). These factors can be expected to affect the geometry of the accretion flow, and, as a consequence, the observed X-ray spectrum, pulse profiles, and aperiodic variability properties of the pulsar. Moreover, at this stage the X-ray emission from the disc itself may become observable. Below we illustrate that this indeed appears to be the case, and thus argue that observations confirm presence of a thick RPD disc in Swift J0243.6+6124.
3.3.1 Spectral transitions, thermal emission from the disc, and onset of the accretion column
Spectral transitions during the outburst have been discussed by Wilson-Hodge et al. (2018), who used NICER and GBM hardness ratios to argue for spectral changes. In particular, the transition to the supercritical accretion regime has been suggested to occur at LX ∼ 1038 erg s−1 based on the observed turn-over in the hardness–intensity diagram and pulse profiles in the soft band (see e.g. discussion and fig. A1, Wilson-Hodge et al. 2018). Same authors also noted slightly higher transitional luminosity when Fermi/GBM colours are considered, which was attributed this to complex dependence of the source spectrum and considered both events as single transition from sub- to supercritical accretion associated with onset of an accretion column.
We note, however, that both transitions turn out to be coincident in luminosity with the pulse profile changes detected by Insight-HXMT in the hard band at luminosities of ∼(1–2) × 1038 and ∼(4–5) × 1038 erg s−1. The Insight-HXMT observes both transitions in a single energy band, which rules out suggestion by Wilson-Hodge et al. (2018) and implies that both events actually took place. This conclusion is confirmed by the observed spectral evolution of the source strongly and difference in the observed variability properties described below.
Let us first discuss the spectral evolution. A prominent soft component was reported by Tao et al. (2019) based on the analysis of NuSTAR spectra close to the peak of the outburst. Tao et al. (2019) attributed this component to the emission from the accretion column and an outflow, presumably powered by accretion from super-Eddington accretion disc. Tao et al. (2019) did not estimate the luminosity corresponding to the appearance of this component, however, it can be estimated by direct comparison of the soft and hard light curves as observed by Swift/BAT and MAXI monitors in 15–50 and 2–20 keV energy bands. As illustrated in Fig. 7, the count rate in the soft band substantially increases above certain luminosity. Given the evolution of the spectrum with luminosity reported by Tao et al. (2019), observed spectral softening is clearly related to the enhancement of the soft component identified in broad-band spectral analysis.

Comparison of count rates in the soft (2–20 keV) and hard (15–50 keV) energy bands based on daily light curves by the Swift/BAT and MAXI missions. At lower fluxes the two bands are well correlated (blue dotted line), however, this is not the case at higher luminosities, where the brightness in the soft band substantially increases. The vertical lines correspond to the transitional luminosities as observed by Insight-HXMT.
We note that the observed temperature and luminosity (i.e. emission region size) of the soft component reported by Tao et al. (2019) are consistent with blackbody-like emission of a thick super-Eddington disc truncated at ∼107 cm from the neutron star, in agreement with the estimates of the inner disc radius discussed above. The appearance of the soft component coincides with the higher luminosity transition in pulse profile shape and aperiodic variability properties revealed by Insight-HXMT, and therefore has to be related to changes of the accretion disc structure. Given that the only change expected at this luminosity is the transition of the disc to the RPD state, we conclude that the observed evolution of spectral and timing properties ∼(4–5) × 1038 erg s−1 is indeed associated with such transition.
The lower luminosity transition can then be readily associated with onset of an accretion column as suggested by Wilson-Hodge et al. (2018) and Tsygankov et al. (2018), and can be used to estimate magnetic field of the neutron star. We note that no changes of the power spectrum associated with this transition are observed, i.e. it is likely related to the emission region itself rather than the disc. The corresponding transition luminosity can be estimated ∼1.5 × 1038 erg s−1 based on evolution of the pulse profiles of the source in hard band revealed by Insight-HXMT. That is slightly higher, but consistent with (0.2–1.1) × 1038 erg s−1 reported by based on the hardness evolution in the soft band.
3.3.2 Features and origin of the observed power spectrum
The observed flux variability is induced by local accretion rate fluctuations occurring throughout the accretion disc at time-scales related to local Keplerian time-scale (Lyubarskii 1997) and results in the observed power-law type spectra for flux variability when integrated over the disc. The disruption of the disc by rotating magnetosphere imposes a break with frequency correlated with accretion rate and proportional to the Keplerian frequency at the magnetosphere, which can be used to estimate the inner disc radius (Revnivtsev et al. 2009). At lower luminosities the power spectrum of Swift J0243.6+6124 appears quite similar to that of other XRPs and magnetic accretors in general (Revnivtsev et al. 2009; Suleimanov, Doroshenko & Werner 2019). Indeed, a broken power-law power spectrum with the break correlated with flux, and a QPO with a factor of ∼2.5–3 lower frequency are observed in Swift J0243.6+6124 similarly to other ‘normal’ XRPs (Finger et al. 1996).
However, above LX ∼ (4–5) × 1038 erg s−1, the power spectrum changes qualitatively, and a second break at higher frequencies appears. As already mentioned, the transition is also accompanied by a dramatic change of the observed pulse profile shape around the same luminosity. Given that the aperiodic variability originates in the accretion disc, it is clear that simultaneous change of the pulse profile shape and of the power spectrum must be triggered by a major change in the accretion disc structure rather than that of emission region, i.e. by the disc transition to the RPD state. Detailed modelling of the observed evolution of the power spectrum is beyond the scope of this work. Below we only discuss it qualitatively in context of the aperiodic variability properties of RPD discs already discussed in the literature.
The main open problem to interpret aperiodic variability lies in the not yet understood origin of the time-scales on which accretion rate fluctuations occur within the disc. Revnivtsev et al. (2009) suggested these occur at local Keplerian time-scale. On the other hand, Mushtukov et al. (2019a) suggested that the dynamo time-scale, expected to be proportional to the local Keplerian time-scale, appears to be a better justified assumption from a physics point of view. In either case, however, the break frequency in the power spectrum originating in a truncated disc is expected to correlate with the Keplerian frequency at the magnetosphere. The exact relation between the two frequencies is still unclear and subject of theoretical investigations, which hampers quantitative predictions.
Qualitatively, however, it is reasonable to assume that deviations from the Keplerian motion within the disc are expected to affect the time-scale of fluctuations, and thus the observed power spectra. Interaction of an RPD disc with magnetosphere has been considered by Chashkina et al. (2017), who found that indeed the rotation law in RPD zone differs from the Keplerian by several per cent. More importantly, however, transition to RPD zone alters also the effective magnetosphere radius, and overall disc structure. That is particularly relevant if we consider that fluctuations are likely to occur on dynamo time-scale, which also depends on other disc properties such as viscosity and vertical scale (Mushtukov et al. 2019a). Both are expected to change upon the RPD transition, and so it can be expected to alter the emerging power spectrum.
Mönkkönen et al. (2019) used this argument to interpret the observed peculiar power spectrum of ‘bursting pulsar’ GRO J1744–28 where a prominent high-frequency noise appears at super-Eddington luminosities. This noise component was associated with the additional variability induced by the RPD part of the disc, which was also suggested to suppress the low-frequency variability from outer disc parts. Similar considerations might be qualitatively used also for Swift J0243.6+6124, where lower noise frequency could be due to the larger magnetosphere (GRO J1744–28 has an order of magnitude lower field). However, a detailed modelling of the power spectrum that takes into account differences in magnetic field and spin frequency is required to assess whether this scenario is viable.
Alternatively, the appearance of the second break could be related to the propagation of the emission from the pulsar through the optically thick envelope expected to enclose a large part of the magnetosphere at high luminosities (Mushtukov et al. 2019b). Finally interaction of the disc with the quadrupole field component enabled by change of the disc structure could also explain the emergence of the second break (Mönkkönen et al. 2019). The multipole nature of the magnetic field in the vicinity of the neutron star’s surface could also explain the non-detection of the cyclotron line, which in principle shall fall within the energy range of NuSTAR and Insight-HXMT. Indeed, higher field at the surface might imply a higher line energy, outside the energy range observed by the HE, or simply could smear a lower energy feature due significant gradients of the fields across the emission region expected for quadrupole field configuration. A similar scenario has been suggested for some ULPs (Israel et al. 2017; Tsygankov et al. 2017; Middleton et al. 2019).
3.4 Combining all results: the overall scenario
We outline therefore the following scenario for the evolution of the accretion geometry of the source with luminosity. As illustrated in Fig. 8, the source first makes a transition (from III to II) from the sub- to the supercritical accretion, an accretion column is formed and the geometry of the emission changes. This change is reflected in the observed pulse profile shape and luminosity dependence of soft X-ray colours reported by Wilson-Hodge et al. (2018). In the second, higher luminosity transition the disc moves from the GPD to the RPD state (from II to I). The disc thickness and, as a consequence, the geometry of the accretion flow and the emission region geometry change. This transition is reflected in the change of the power spectrum, appearance of the strong soft excess in the X-ray spectrum associated with inner disc regions (Tao et al. 2019), and in the detection of radio emission correlated with X-ray flux attributed by van den Eijnden et al. (2018b) to jet formation. The transition might also be accompanied by a change of the dominant mode of interaction of the accretion disc with the magnetosphere, i.e. from dipole to quadrupole.
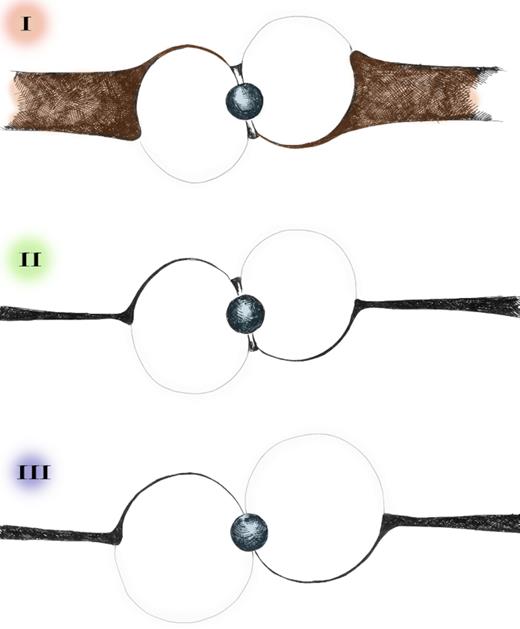
The suggested geometry of the accretion disc and the emission region for respective states is also sketched for illustration.
The main observational arguments in favour of this scenario are the non-detection of the propeller transition by NuSTAR (which implies that the magnetosphere must be compact both in quiescence and outburst), and the detection of the transitions in pulse profile and power spectra shape by HXMT-Insight (which can be explained with RPD transition). So far we tried to keep the discussion independent of the assumed magnetic field of the source, and have not cross-checked the self-consistency of the model beyond order of magnitude comparisons. With the improved upper limit on the propeller luminosity it becomes, however, possible to put stronger constrains on the magnetosphere size both in quiescence and outburst, and thus the magnetic field of the source.
This conclusion can be verified, to some extent, by comparing the observed luminosity of the second transition, i.e. from sub- to supercritical accretion regime with theoretical predictions. As already mentioned, the observed transitional luminosity is Lcrit ∼ 1.5 × 1038 erg s−1, which can be compared with the same relation by Becker et al. (2012) as Wilson-Hodge et al. (2018). Assuming kRm ∼ 3 × 107 cm we arrive thereby to the same value of |$B_{12}\sim 1.4\times 10^{-35}L_{\rm crit}^{-15/16}\sim 8.7$| as Wilson-Hodge et al. (2018). In this case k ∼ 0.1 is required to explain the estimated effective magnetosphere size. On the other hand, theoretical predictions of critical luminosity are rather uncertain on their own, since the critical luminosity is affected by assumed emission region geometry, particularly area of the hotspots on the surface of neutron star. This area is defined by the geometry of the accretion flow, which is believed to be defined by the effective magnetosphere size (Mushtukov et al. 2019a). This dependence is ignored by Becker et al. (2012), and here estimate by Mushtukov et al. (2015a) is more appropriate. Numerical evaluation using this model gives slightly lower field of B12 ∼ 3–5 and k ∼ 0.1–0.2 depending on whether the accretion column is assumed to be filled or hollow. We emphasize that despite this uncertainty, both models predict rather moderate magnetic field, and allow to explain self-consistently both transitions observed by Insight-HXMT, non-detection of the propeller transition, and the observed spin-up rate. However, small values of coupling constant k are clearly preferred.
The RPD transitional luminosity predicted for the estimated values of k and B12 appears by factor of 2 lower than observed, and in fact, more consistent with the observed luminosity of first transition LAB ∼ 2 × 1038 erg s−1, i.e. the transition to RDP regime occurs simultaneously with onset of an accretion column, which is a surprising coincidence. In principle, the effects of RPD transition could be expected to become apparent at higher luminosities when substantial part of the disc transitions to RPD state. Furthermore, we only considered a fixed assumed distance, which is also rather uncertain and decreasing the distance to lower limit of ∼5 kpc would improve the agreement. Considering also that all estimates above are actually rather rough, the factor of 2 agreement can, nevertheless, be considered excellent. The important point also is that the scenario remains self-consistent also considering other constrains on the magnetic field (i.e. spin-up rate and transition luminosity from sub- to supercritical accretion), and the RDP transition is still expected to take place at around the observed luminosity.
4 SUMMARY AND CONCLUSIONS
The surprise outburst of Swift J0243.6+6124 allowed us for the first time to study accretion physics at ULX-like accretion rates, and in particular to discover the transition of inner disc regions to the RPD state. As discussed above, uncertainty in distance and magnetic field of the neutron star complicates interpretation of observational findings, nevertheless, we are able to conclude that in this scenario the magnetic field must be comparatively weak to coherently explain all of the observed phenomenology. In particular, the observed continued accretion at lowest luminosity LX ∼ (0.6–3) × 1034 erg s−1, transition from the sub- to the supercritical regime and onset of the accretion column at LX ∼ (1–2) × 1038 erg s−1, transition to the RPD state at the highest luminosity LX ∼ 4.4 × 1038 erg s−1 accompanied by the appearance of the strong soft excess in X-ray spectrum, and the observed spin-up rate of the neutron star throughout the outburst. Considering all observables, we conclude that the dipole component of the magnetic field in Swift J0243.6+6124 must in this case be B ∼ (3–9) × 1012 G, and likely at the lower limit of this range, i.e. in range typical for accreting pulsars. Even so, the source has been able to reach ULP luminosity levels while still pulsating. This conclusion is in line with recent field estimates (Tong 2015; Chen 2017; Xu & Li 2017; Tong & Wang 2019) for extragalactic ULPs, where magnetar-like fields were initially suggested (Mushtukov et al. 2015b).
We note that our conclusions are confirmed by findings of Jaisawal et al. (2019), who investigated shape of the iron line and thermal emission from the source based on NICER observations. The iron line was found to broaden with luminosity suggesting high velocities in inner disc regions and inner disc radius as small as ∼5 × 107 cm, i.e. consistent with our findings. Thermal emission from the disc similar to that reported by Tao et al. (2019) was also detected, although interpretation of the broad-band continuum, as discussed by Jaisawal et al. (2019), is slightly different in the two cases.
It can be possible due to strong multiple components of the magnetic field (see e.g. Israel et al. 2017). Another possibility is related to the geometrical thickness of accretion column: geometrically thin accretion columns can support larger accretion luminosity (see approximate equation 10 in Mushtukov et al. 2015b). It is assumed that the geometrical thickness of a column is determined by the penetration depth of accretion disc into the magnetosphere. In the paper by Mushtukov et al. (2015b), the penetration depth was taken to be about a geometrical thickness of a disc at the magnetospheric radius. Because the accretion disc tends to be RPD and geometrically thick at large mass accretion rates, the geometrical thickness of accretion column was taken to be large. However, if the penetration depth of the accretion disc into the magnetosphere is significantly smaller than its geometrical thickness (it might be due to a strong radiation force at the inner disc edge), the geometrical thickness of accretion columns in the paper by Mushtukov et al. (2015b) was overestimated, and therefore the maximal luminosity of the columns was underestimated. In this case the enormous accretion luminosity of ULX pulsars can be explained without the hypothesis of magnetar-like magnetic fields.
We note also that high magnetic fields inferred for ULPs, and in particular M82 X-2 (Bachetti et al. 2014; Tsygankov et al. 2016) largely stem from the assumption that the disc is truncated at approximately half of the Alfvén radius (Tsygankov et al. 2016) and may be overestimated if it is not the case. As discussed above, the effective magnetosphere size in Swift J0243.6+6124 must definitively be small (with k ∼ 0.1–0.2), and the same possibility has, in fact, been already theoretically discussed for ULPs (Chashkina et al. 2017; Mushtukov et al. 2019b). This might be associated with the transition to RPD state, although potential presence of multipole field components in another luminous XRP, SMC X−3, has been also suggested as a possibility to resolve discrepancy between various estimates of the magnetic field in ULPs (Tsygankov et al. 2017). Observations of Swift J0243.6+6124 thus might provide the first, and possibly the only direct confirmation of this hypothesis.
Given the extragalactic origin of ULPs and their low observed fluxes which complicate detailed observational investigation of these objects, we finally conclude that Swift J0243.6+6124 and similar Galactic sources provide a unique close-up view on accretion physics in ULPs and represent an ideal playground for testing the theoretical predictions for accretion physics on magnetized neutron stars. Observed properties of Swift J0243.6+6124 echo the theoretical considerations already invoked for ULPs, and the detailed analysis of the vast amount of high-quality Insight-HXMT, NuSTAR, NICER, and VLA observations of this source will likely be key for tackling the problem of ULPs.
ACKNOWLEDGEMENTS
This work made use of the data from the Insight-HXMT mission, a project funded by China National Space Administration (CNSA) and the Chinese Academy of Sciences (CAS). The Insight-HXMT team gratefully acknowledges the support from the National Program on Key Research and Development Project (Grant No. 2016YFA0400800) from the Minister of Science and Technology of China (MOST) and the Strategic Priority Research Program of the Chinese Academy of Sciences (Grant No. XDB23040400). The authors thank supports from the National Natural Science Foundation of China under Grant Nos. 11503027, 11673023, 11733009, U1838201, and U1838202. This work was supported by the Russian Science Foundation grant 19-12-00423 (VD, ST, AM). This research has made use of MAXI data provided by RIKEN, JAXA, and the MAXI team. We acknowledge the use of public data and products from the Swift data archive. We also thank the NuSTAR team for approving the DDT observation of Swift J0243.6+6124.
