


ABSTRACT
The quintessence model is one of the simplest and better known alternatives to Einstein’s theory for gravity. The properties of the solutions have been studied in great detail in the background, linear and non-linear contexts in cosmology. Here we discuss new phenomenology that is induced by adding disformal terms to the interactions. Among other results, we show analytically and using cosmological simulations ran with the code isis that the model possesses a mechanism through which it is possible to obtain repulsive fifth forces, which are opposite to gravity. Although the equations are very complex, we also find that most of the new phenomenology can be explained by studying background quantities. We used our simulation data to test approximate relations that exist between the metric and scalar field perturbations as well as between the fifth force and gravity. Excellent agreement was found between exact and approximated solutions, which opens the way for running disformal gravity cosmological simulations using simply a Newtonian solver. These results could not only help us to find new ways of testing gravity, but also provide new motivations for building alternative models.
1 INTRODUCTION
Observations of distant supernovae, quasars, and of the cosmic microwave background are consistent with a universe with late-time accelerated expansion (Riess & et al. 1998; Astier et al. 2006; Risaliti & Lusso 2015; Planck Collaboration 2016a). Although this effect can be mimicked by introducing a cosmological constant to Einstein’s equations, the true nature of the expansion is still unknown. Moreover, the apparent value of the cosmological constant does not correspond to the vacuum energy predicted by particle physics (e.g. Weinberg 1989). Among the several solutions to these inconsistencies, there is the idea of modifying Einstein’s theory for gravity. A comprehensive description of many of these theories and their cosmological implications can be found in reviews by Clifton et al. (2012), Amendola et al. (2018), Copeland, Sami & Tsujikawa (2006), Silvestri & Trodden (2009), Weinberg et al. (2013), Joyce et al. (2015), Lue, Scoccimarro & Starkman (2004), Koyama (2016), Nojiri, Odintsov & Oikonomou (2017), and Li et al. (2018).
Many of these modified gravity (MG) theories can be interpreted as having two geometries for space–time. One of these two geometries characterizes the curvature of space–time, while the other describes the impact that this curvature has on the dynamics of matter. The simplest way of relating these two metrics is through a conformal transformation (i.e. one metric is obtained from the other with a rescaling). This rescaling factor is equal in all dimensions and hence conserves shapes. The next step in complexity consists in adding a dependence with the direction to this relation. This can be done through so-called disformal transformations, which in the case of scalar–tensor theories depend on the derivatives of a scalar field (Bekenstein 1993). These kind of transformations have been studied in several contexts in cosmology such as inflation (Kaloper 2004), dark matter (Skordis et al. 2006; Arroja et al. 2015), dark energy (Koivisto 2008; Koivisto & Mota 2008; Sakstein 2015; van de Bruck, Mifsud & Morrice 2017), screening of MG (Koivisto, Mota & Zumalacárregui 2012; Ip, Sakstein & Schmidt 2015), non-linear structure formation (Hagala, Llinares & Mota 2016), and others (Barrow & Mota 2003; Bettoni & Liberati 2013; Brax et al. 2013; Deruelle & Rua 2014; Sakstein 2014; Sakstein & Verner 2015; Ben Achour, Langlois & Noui 2016; van de Bruck et al. 2016).
In this work, we will study the impact that the addition of a disformal coupling has on the solutions of field equations and the non-linear matter distribution. We give a concrete example that we obtained by perturbing with a disformal coupling the quintessence model, which is one of the best known extended models of gravity. Contrary to other works in which the emphasis is put on parameter estimation, here we are interested in finding novel phenomenology associated with this coupling, independently of the validity of the model from an observational perspective. Doing this is important because knowing what effects are associated with this particular coupling could help to construct models with similar phenomenology, but that are compatible with specific data sets. This in turn may enable us to construct novel tests of gravity based on this new phenomenology.
Among other characteristics of the solutions of the Klein–Gordon equation for the quintessence field, we will discuss a very simple relation that the disformal coupling induces between this field and the gravitational potential, which can be translated into a similar relation between the fifth force associated with the scalar field and gravity. We will first analyse this and other effects analytically. We will confirm these estimations a posteriori in a realistic set-up given by fully non-linear cosmological simulations. These simulations track the scalar field by means of a non-linear hyperbolic solver, which takes into account time derivatives in the background as well as in the perturbations and thus, provides the most accurate solution that can be obtained, without assuming specific symmetries or neglecting terms in the equations.
We present details of the model in Section 2. In Section 3, we describe analytical properties of the evolution of the background and perturbed scalar field as well as of the fifth force that arises from it. Section 4 describes the cosmological simulation suit in which we base our non-linear analysis. We present results from these simulations on the scalar field and matter distributions in Sections 5 and 6, respectively. We summarize our results and conclude in Section 7.
2 DISFORMALLY COUPLED QUINTESSENCE
We will restrict our analysis to positive values of B0, V0, and ν. The potential V(ϕ) is thus a decreasing function of ϕ, which will result in a background field rolling down the potential towards infinity. Negative values of ν would simply make the field roll towards negative values instead, and the analysis in this paper would be identical after the transformation ϕ → −ϕ and β → −β. A positive choice of B0 is needed to ensure B(ϕ) > 0. As mentioned by Bekenstein (1993), a negative coupling B(ϕ) breaks causality by allowing information in the scalar field to propagate faster than the speed of light. We will look at three different general cases for β: negative, positive, and zero. These correspond to a disformal coupling B(ϕ) that is respectively decreasing with ϕ, increasing with ϕ, or constant.
A factor (1 + γ2ρ)−1 that changes both the speed at which the scalar field evolves in the background and the speed of scalar waves.
The addition of a term |$(B_{,\phi } \gamma ^2)/(2B)\rho \dot{\phi}^{2}$| (i.e. an additional force acting on the field).
These two additional terms are not exclusive to the base model we choose (in this case the quintessence model), but are characteristic of the disformal coupling. The aim of this paper is to understand the consequences that these terms have in both the solutions of the Klein–Gordon equation and the non-linear distribution of matter in the Universe.
3 ANALYTICAL PROPERTIES OF THE MODEL
This section describes analytical solutions of the Klein–Gordon equation for the scalar field. We will study separately the time evolution of the scalar field in the background (for an Einstein–de Sitter universe) and its perturbations. Furthermore, we will discuss properties of the fifth force that arise from it.
3.1 Disformal field dynamics: background evolution in an Einstein–de Sitter universe
These definitions show that the four original free parameters V0, ν, B0, and β are degenerate and that the shape of the background solutions depends only on two free parameters D and F. The limit (D, F) → 0 corresponds to the usual quintessence model that does not depend on any free parameter (all the information provided by the two original parameters V0 and ν can be condensed in the rescaling of the time and the scalar field). The limit F → 0 is associated with a constant disformal coupling, where β = 0. We will study these two limits first separately and then the most general case with β ≠ 0.
3.1.1 Quintessence
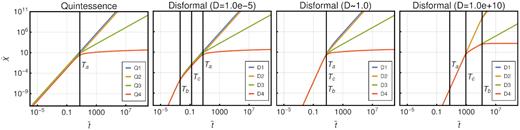
Background evolution of the field for quintessence model (left-hand panel) and disformal model with constant coupling (for three different values of the free parameter D and F = 0). Each panel contains four curves that correspond to the four models described in Tables A1 and A2 in Appendix A. The vertical lines correspond to the different time scales defined in Table 1 for the case that includes damping. The numerical values of these time-scales are very close to the values that do not include damping.
Characteristic time-scales that arise in the background solutions of the Klein–Gordon equation for Einstein–de Sitter cosmology. Note that the non-linear regimes mentioned here are associated with the moment in which the background equation for the scalar field becomes non-linear (and not to the non-linear regime usually studied in cosmology). The superscript nd makes reference to ‘non-damped’ solutions.
| Type of transition | Without damping | With damping |
|---|---|---|
| Quintessence linear → quintessence non-linear | |$T^\mathrm{nd}_a \equiv 2\sqrt{2}$| | Ta ≡ 5.7 (numerical) |
| Disformal linear → quintessence linear | |$T^\mathrm{nd}_b \equiv \sqrt{6D}$| | |$T_b \equiv \sqrt{2D}$| |
| Disformal linear → disformal non-linear | |$T^\mathrm{nd}_c \equiv 3^{7/12}\Gamma ^{1/3}(3/4)\sqrt{2}D^{1/4}$| | |$T_c \equiv T^{\mathrm{nd}}_c$| |
The complete solution of the quintessence equation of motion (equation 16; red curve in Fig. 1) has a characteristic time-scale that divides the linear regime at early times from the non-linear regime at late times. At early times, the damping term interacts with the force that induces the field to roll down the potential in such a way that only the normalization of the solution is changed with respect to the undamped solution. This regime is characterized by a logarithmic slope (|$\frac{\mathrm{ d}\log \tilde{\chi }}{\mathrm{ d}\log \tilde{t}} = \frac{\tilde{t}}{\tilde{\chi }}\partial _{\tilde{t}}\tilde{\chi }$|) equal to two. During the transition to the non-linear regime, the force that accelerates the field becomes negligible and thus, the evolution of the field is damped and approaches a solution with a logarithmic slope equal to zero.
3.1.2 Disformal gravity with constant disformal coupling
These results can be summarized as follows. The evolution of the field at early times can be described analytically by linearizing the equation with respect to time and the field itself. Since the coefficient that appears in front of the time derivative in the damping term approaches zero at early times, it is possible to neglect it in this regime (note that this cannot be done in the quintessence model, for which this coefficient diverges at |$\tilde{t}=0$|). The solution for the early universe is then a power law with a logarithmic slope equal to four, which is higher than in the quintessence case and thus, implies a slower evolution at early times. Once this early stage is finalized, three different processes dictate the further evolution:
The two explicit functions of time that exist in the two terms in the right-hand side of equation (17) approach the quintessence value (|$1/\tilde{t}$| and 1, respectively).
The damping term increases with time.
The term that forces the field to roll down the potential (second term on the right-hand side of the equation) drops (i.e. the non-linear regime is reached).
Three possible solutions exist depending on which of these processes is activated first, which in turn depends on the amplitude of D. For small values of D (red curve in the second panel from left to right of Fig. 1), the transition towards the quintessence limit occurs first (i.e. Tb < Ta and Tb < Tc). In this case the equation is transformed into the same equation that defines the quintessence model and thus the evolution continues following the solutions described in the previous section and in Table A1 in Appendix A.
For intermediate values of D (red curve in the third panel from left to right of Fig. 1), the damping term dominates before the occurrence of the transition to the quintessence regime. In this case the acceleration of the field becomes negative and the field loses kinetic energy. The solution becomes flat with a logarithmic slope equal to zero.
Finally, for very large values of D (red curve in the fourth panel from left to right of Fig. 1), the evolution of the field stays in the disformal regime until the exponential function in the potential starts decaying. The equation of motion becomes the equation of a free particle, whose solution has a logarithmic slope equal to one. Once this happened, the field continues evolving unperturbed until the damping term dominates. At this moment, the field decelerates and the slope becomes equal to zero.
These apparently complex solutions can be summarized in a simple way by plotting their logarithmic slope as a function of D and |$\tilde{t}$|, which we calculated numerically and show in Fig. 2. The transition between different regimes is given by the characteristic time-scales defined in Table 1.
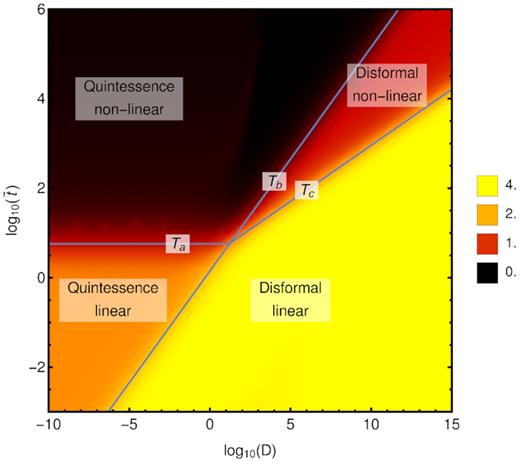
Colour coded is the logarithmic slope of the solution of the background Klein–Gordon equation for the disformal model with β = 0 and an Einstein–de Sitter universe. The three lines correspond to the three time-scales defined in Table 1 (for the case that includes damping).
3.1.3 Disformal gravity with exponential disformal coupling
Assuming β (which is equivalent to F in the parametrization studied here) is different than zero has two effects in the equation of motion (equation 9). First, it gives an additional dependence with the field |$\tilde{\chi }$| to the coefficients that control the transition between the disformal and quintessence regimes. This new dependence converts the parameter D into an effective parameter |$\tilde{D}=D \exp (F\tilde{\chi })$|. Positive or negative values of F will result in |$\tilde{D}$| increasing or decreasing with time, which in turn, will delay or accelerate the transition to the quintessence regime (defined by Tb). Secondly, assuming F ≠ 0 will add a new term to the equation of motion, which will act as an additional damping term or external force on the field depending on the sign of F.
In the case F > 0, the parameter |$\tilde{D}$| will grow exponentially with the value of the field. This will decrease the time required to reach the transition to the non-linear regime as well as decrease the importance of the damping terms. Since the new damping term decreases faster with time than the usual one, it will not have any impact on the overall shape of the solutions. Fig. 3 shows the logarithmic slope of the solution in the plane (D|$, \tilde{t})$| for different values of F. For small values of D and intermediate values of F (second panel from the left), the damping term kicks in before the transition to the non-linear regime is reached and thus, the solution gets flat, with a logarithmic slope equal to zero. However, the dependence of |$\tilde{D}$| with |$\tilde{\chi }$| will force the damping to decrease faster than the usual case, thus giving the chance to the potential term to resurge and change the logarithmic slope of the solution back to one. Afterwards, all the terms on the right-hand side will disappear, which let the field evolve as a free particle, with a slope equal to one. For large values of F, the transition to the non-linear disformal regime is faster than the transition to the linear quintessence regime, and so the slope of the solution has a direct transition from four to one.
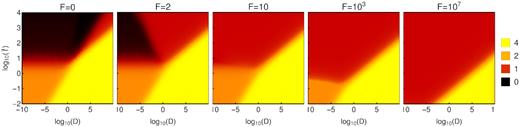
Colour coded is the logarithmic slope of the solution of the background Klein–Gordon equation for the disformal model for different values of F in an Einstein–de Sitter universe.
3.2 Disformal field dynamics: perturbations
The model we are dealing with does not include conformal or explicit couplings. However, the disformal coupling that we allowed for can generate perturbations in the field by itself. The mechanism by which these perturbations originate is based on the fact that, thanks to the term (1 + γ2ρ)−1 in the Klein–Gordon equation (equation 6), the field rolls down the potential V at different rates in regions that have different densities (slower rate in higher density regions). The shape of these perturbations can be summarized in a simple relation between the metric perturbation Ψ and the scalar field ϕ, which can be translated (after appropriate approximations) into a similar relation between the fifth force associated with the scalar field and gravity.
An important characteristic of equation (26) is that the sign of the coefficient ξ0 depends in part on the sign of the second derivative of the field. This means that at the moment in which the background field transitions towards the non-linear regime described in previous section (i.e. the moment in which its second derivative becomes negative), the scalar field perturbations will be able to flip; their usual distribution will thus be inverted and local minima of the field will correspond to local minima in the density distribution. The physical mechanism responsible for this phenomenon is related to the fact that the term (1 + γ2ρ)−1 in the Klein–Gordon equation (equation 6) increases the efficiency of the damping term in low-density regions. Thus, at the moment in which the damping term grows to the point in which it can affect the evolution of the field, the values in the haloes overshoot that of the voids and invert the sign of the perturbations. Since the fifth force has an explicit dependence on the potential V (and thus, on the scalar field itself), the flip in the perturbations will have a direct impact on the distribution of forces and the evolution of matter that is defined by it.
3.3 The fifth force
The results described in this section and the previous one can be used to define two different simulation methods that will depend on two different approximations. First, it is possible to neglect the effects induced by the term υ in equation (26). Assuming also that ξ0 is independent of the position (which we actually did to derive that equation), we can discretise the space and time derivatives that appear in the definition of the fifth force (equation 31). Thus, the fifth force can be calculated as a linear combination of values of ϕ in space and time. We will discuss in the following section the impact that making these approximations has in the estimation of the scalar field by comparing with exact results obtained from cosmological simulations. A companion paper will also contain a detailed estimation of how the error associated with these approximations translates into the predictions of observable quantities.
A different simulation approach that can be defined from these results consists in neglecting the curl term in equation (35) to find a relation between the Newtonian and fifth force fields. This second case is equivalent to assume that all the gravitational effects can be condensed in an effective gravitational constant |$G_{\mathrm{eff}} = G (1+\eta _0^2)$|, which is assumed to be independent of the position. Note that similar approximations were discussed in Sakstein (2014) in the context of Solar system tests.
3.4 Achieving a repulsive fifth force
The presence of non-canonical kinetic terms in the definition of a scalar tensor theory, can give rise to repulsive forces (Amendola 2004). Since disformal gravity fulfils this condition when written in the Jordan frame, it may be worth investigating how repulsive forces can be achieved in this model. The possibility of obtaining repulsive fifth forces is not only interesting from a theoretical perspective, but becomes relevant in the context of the discrepancy found by the Planck collaboration between the normalization of density perturbations σ8 that can be inferred from the CMB and from lensing (Planck Collaboration 2016b). Although the measured discordance could be due to unknown biases or even statistical fluctuations (Addison et al. 2016; Kitching et al. 2016; Couchot et al. 2017), these results could also be a signal of new physics. A repulsive MG force will delay clustering with respect to GR and thus could help in reducing the tension.
An additional result that comes from equation (37) is that the fifth force has an explicit dependence with the potential V, and thus with the absolute value and sign of the perturbations. This may be important since we showed in Section 3.2 that the scalar field perturbations are proportional to the metric perturbations (equation 26) and that they can flip following the sign of the coefficient ξ0. So the moment in which the field perturbations flip, will be associated with a change in the amplitude of the fifth force.
4 N-BODY SIMULATIONS
We summarize in this section technical aspects of the 3D cosmological simulations that we run to both confirm the results presented above in a realistic set-up and quantify the impact that the fifth force has in the matter distribution in the non-linear regime. This section also describes in detail our motivation for choosing the particular set of model parameters that we simulated.
4.1 Set-up of the simulations
The simulations were run with the MG N-body cosmological code isis (Llinares, Mota & Winther 2014), which is based on the particle mesh code ramses by Teyssier (2002). The code includes a solver for the non-linear MG elliptic equations that can be obtained after assuming the quasi-static approximation. However, since in disformal gravity the time derivatives play a central role in both the Klein–Gordon and geodesics equations (equations 6 and 28), the validity of this approximation is not guaranteed. Thus, we made use of the non-static solver of isis (Llinares & Mota 2014; Hagala et al. 2016), which relies on a non-linear hyperbolic solver that can take into consideration time derivatives of the background and perturbed fields.
We performed N-body simulations with 2563 particles in a cubic box with a comoving side length of 256 Mpc h−1. The background cosmology is assumed to be the same for all the runs and given by Planck 2015 best-fitting Λ cold dark matter (ΛCDM) parameters (Planck Collaboration 2016a): (H0, ΩΛ, Ωm, σ8) = (67.74 km s−1 Mpc−1, 0.6911, 0.3089, 0.8159). The assumption behind this selection for the background expansion is that the energy of the scalar field is compatible with a cosmological constant with the value required by observations. Thus, from the numerical point of view, taking into account the energy of the scalar field is equivalent to adding a cosmological constant. We note that not all the models that we simulated possess this property. However, in this paper, rather than finding the best-fitting disformal parameters, we are interested in looking for new phenomenology that may provide us with novel ways of looking at the data. This may potentially lead to a detection of deviations from GR in the data, which does not necessarily correspond exactly to the model studied here, but that share observable signatures with it. Taking into account the energy of the scalar field will complicate the analysis, but will not provide additional information on the disformal effects associated with the perturbations.
The initial conditions for the N-body particles were generated assuming that the impact of the scalar field at high redshift is negligible. Thus, all the simulations use the same initial conditions, which were generated with the Zeldovich approximation with the code grafic2 (Bertschinger 2001). These sets of initial conditions share not only the power spectrum, but also the phases. By doing this, we ensure that differences found between the various simulated models are induced by the presence of a fifth force and not the initial particle distribution.
The codes ramses and quasi-static isis include adaptive mesh refinements (AMR), which means that they can increase the resolution locally as required by the complexity of the solutions. However, the non-static version of isis does not include this technique. Thus, our analysis will only be valid up to the Nyquist frequency of the domain grid which covers the whole simulation box and has 256 nodes per dimension. The three-dimensional particle data was output at nine different snapshots, at |$z$| = 2.33, 1.00, 0.43, 0.25, 0.11, 0.081, 0.053, 0.026, and 0. In addition, the code outputs all the available fields (density, metric perturbation, scalar field, and its derivatives) in a two-dimensional slice that crosses the centre of the box at 200 different points in time, ranging from |$z$| = 16 to |$z$| = 0.
4.2 Simulated models
Table 2 lists the model parameters that we chose for the simulations. We also included the derived background parameters D and F defined in Section 3.1 and the product |$v$|0ν which will be useful to interpret results in the following sections. Note that the background parameters D and F were original defined for an Einstein-de Sitter universe, so they must be taken only as indicative. The slope of the disformal coupling β is set to zero for all the runs except the models Disformal Dark Energy (DDE) and Field Flipping (FF), for which we made two additional runs with β = ±10. A brief explanation of the motivation for each set of parameters follows.
Model parameters used for the N-body runs. See Section 4 for explanation.
| Model | |$v$|0 | ν | b0 | β | D | F | |$v$|0ν | Notes |
|---|---|---|---|---|---|---|---|---|
| GR | – | – | – | – | – | – | – | ΛCDM with Planck 2015 parameters |
| DDE | 3.055 | 0.4 | 1 | (−10, 0, 10) | 0.65 | (−25, 0, 25) | 1.22 | Correct amount of Disformal Dark Energy |
| Fiducial | 1 | 1 | 1 | 0 | 1.3 | 0 | 1 | – |
| VF | 10 | 1 | 0.1 | 0 | 1.3 | 0 | 10 | Velocity flips in less than a Hubble time |
| Steep | 10−3 | 103 | 0.01 | 0 | 1.3 × 101 | 0 | 1 | V is steep ⇒ fast transition to non-linear phase |
| FF | 0.1 | 100 | 1 | (−10, 0, 10) | 1.3 × 10³ | (−0.1, 0, 0.1) | 10 | Field flips in less than a Hubble time |
In the Fiducial run, all three free parameters of the model are set to one. These values give a background evolution that is very close to that of the ΛCDM model. To confirm this, we also run the DDE simulation with parameters that were specifically tuned to recover the ΛCDM expansion rate. The parameters of this simulation are such that the potential V(ϕ) gives the observed amount of Dark Energy at redshift zero and at the same time stays within constraints obtained in the linear regime by van de Bruck & Mifsud (2018). We find that their upper limit for the coupling, |$B_0 = \left(0.2\, \mathrm{meV} \right)^4$|, is equivalent to |$B_0 \approx 1/ \left(H_0^2 M_\mathrm{pl}^2 \right)$| in the units used in this work. Consequently, using a dimensionless coupling |$b_0 = \mathcal {O}\left(1\right)$| will give a model that is within the constraints given in that study. The initial potential, |$v$|0 = 3.055, was found with a shooting algorithm, following van de Bruck & Mifsud (2018). Combining this with a small value for ν (i.e. a flat potential) results in |$V \sim 3 H_0^2 M_\mathrm{pl}^2$| today, and hence gives rise to a dark energy component similar to a cosmological constant. Most of the results that come out of these two simulations (Fiducial and DDE) are similar. Thus, we will show only results of the Fiducial run and point out differences when needed.
The parameters of the FF and Velocity Flipping (VF) models were chosen to present a broad spectrum of phenomenology. The FF simulation enters the non-linear background phase discussed in Section 3.1.2 before redshift zero. The analysis presented in Section 3.2 shows that this will induce a flip in the scalar field perturbations. Once this happens, the distribution of the field perturbations will contradict the usual profile for a coupled scalar field and will associate high-density regions with local maxima in the field. In the VF case, a Hubble time is enough to get the flip in the time derivative of the field, but not in the field itself. The parameters of this model were chosen to study how the degeneracy that exists between background parameters D and F can be broken by looking at the perturbations in the fields. Thus, the simulation shares the values of D and F with the Fiducial simulation, however, it has a different value of b0.
The Steep model was run using parameters that correspond to a steep potential V, and thus undergoes an early transition towards the non-linear regime (i.e. corresponds to a small value Tc). The aim of this simulation is to analyse the consequences of a field that is active only at high redshift and is damped afterwards.
5 SIMULATION RESULTS: PROPERTIES OF THE FIELDS
We discuss in this section several aspects of the distribution of the simulated fields as well as a comparison with the analytic estimations presented in Section 3.
5.1 Background evolution of scalar field
Given that the simulations track the scalar field χ rather than its perturbations δχ on a background χ0, it is worth asking if the mean value of the simulated scalar field agrees with the background value that can be calculated, for instance, with a Runge–Kutta solver. We show such a comparison in Fig. 4. The lines in the left and right panels are Runge–Kutta solutions for the background scalar field and its time derivative respectively. The points are the mean values obtained from the N-body simulations in slices that pass through the centre of the box. The abrupt decline towards zero at high redshift is related to the fact that the initial conditions are not given at a = 0, but at the starting redshift of the simulations, when we assumed that the field is equal to zero. Both solutions agree very well, which is a confirmation of a reliability of the code.
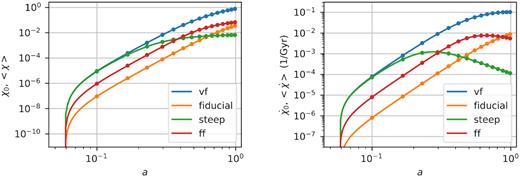
Background evolution of the scalar field (left) and its time derivative (right) for the simulated models as a function of the expansion factor a. The continuous curves are Runge–Kutta solutions of the order zero Klein–Gordon equation and the points are the mean values obtained from the non-linear simulations in slices that pass through the centre of the box. Results of the DDE run are very similar to those of the Fiducial run, so we exclude them to avoid overcrowding the plots.
5.2 Qualitative behaviour of scalar field perturbations
Fig. 5 shows the time evolution of scalar field perturbations as found in 2D slices that pass through the centre of the 3D box. Different rows correspond to different redshifts (shown to the left of the colour bar). The first column shows the density distribution, while the other four correspond to the perturbation in the scalar field. In this section we are only interested in a qualitative description of the effects associated with the disformal coupling, thus we normalized the perturbations with the maximum value reached in each model separately. When using this normalization, the perturbations lie always between minus one and one. A quantitative description will be presented in following sections. Since the Fiducial and DDE models have almost identical evolution, we show only one of these two models.
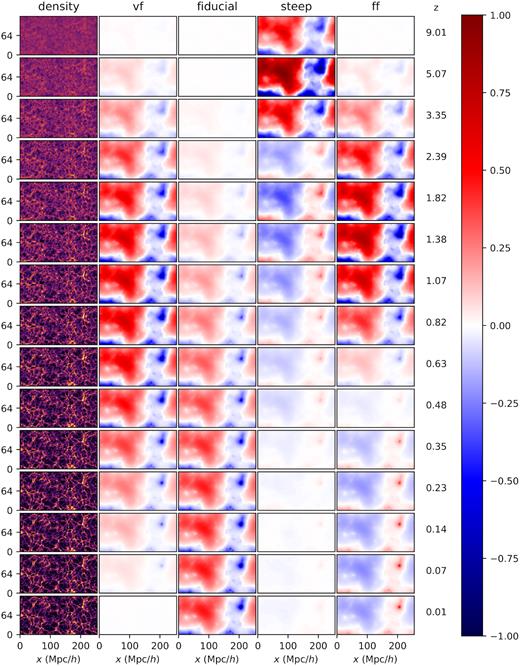
The first column shows the evolution of the density distribution. The rest of the columns show the time evolution of scalar field perturbations for different models. The colours correspond to the scalar field perturbations normalized to the maximum reached in each model, which means that the values go from −1 (dark blue) to +1 (dark red). The scaling of the colours is symmetric-log. The numbers next to the colour bar correspond to the redshift of each row. For reasons of space, we show only the bottom half of each slide.
The panels show that scalar field perturbations can do more that simply grow with time as happens in other scalar tensor theories. The only model that has a monotonic growth of perturbations is the Fiducial one. In the VF model, the perturbations grow until redshift of about |$z$| = 0.82 and then wash out until being completely absent at redshift |$z$| = 0. In the Steep model, the perturbations grow very rapidly at early times, reaching their maximum at |$z$| ∼ 5. Then the field flips, developing maxima in the position of the haloes and minima in the voids. After the flip occurs, the perturbations washed out as happened in the VF model. Finally, the FF model has a behaviour which is similar to the Steep model: a maximum of the perturbations at |$z$| ∼ 1.38, followed by a flip at |$z$| ∼ 0.48. In this particular case, the perturbations continue being almost constant until |$z$| = 0.
Time evolution of the coefficient ξ0 that relates metric perturbations Ψ with the scalar field χ (equation 26) for the simulated models. The DDE model is similar to the Fiducial one, and thus not shown to avoid overcrowding the plot. The sharp transitions between positive and negative values are produced by the symlog scaling that we used for the vertical axis. See Section 5.2 for explanation.
Comparison of Figs 5 and 6 unveils the close relation that exists between the evolution of the perturbations and ξ0. The maxima in the perturbations agree with the maxima in ξ0. Also the moment in which the flips occur in the field agree with the change in the sign of ξ0.
The fact that the scalar field perturbations shown in Fig. 5 go back and forth in the FF simulation may open the question of the possibility of obtaining sustained oscillations in the field perturbations. However, these changes in the perturbations are associated with transitions between different regimes in the background evolution of the field, which are condensed in the evolution of ξ0. The analysis presented in Section 3.1 shows that after the second oscillation occurred, the perturbations cannot do more than to approach zero.
5.3 Testing analytic predictions for field perturbations
A more quantitative comparison between the scalar field that we extracted from the self-consistent N-body simulations and the predictions that we can obtain by assuming that υ = 0 in equation (26) is shown in Fig. 7. The blue curves are the maximum relative difference between these two fields as found in 2D slices that pass through the centre of the box and as a function of redshift. Different panels correspond to different simulations. The fields that we used for this comparison are the fully non-linear scalar field ϕ and the solution of the Poisson’s equation Ψ that are used to calculate the forces while the simulations run. In other words, these are the most accurate fields (ϕ and Ψ) that we have at hand. The plots show that there is a very good agreement between the exact field provided by the simulations and our prediction: differences are below 0.1 per cent at all times after |$z$| = 1. The larger differences that occur at high redshift are related to the fact that we did not take into account perturbations of the scalar field in the initial conditions for the simulations (instead, we approximated them by zero). Thus, there is a transient in which the field evolves from zero to a field that has a power spectrum compatible with equation (26).
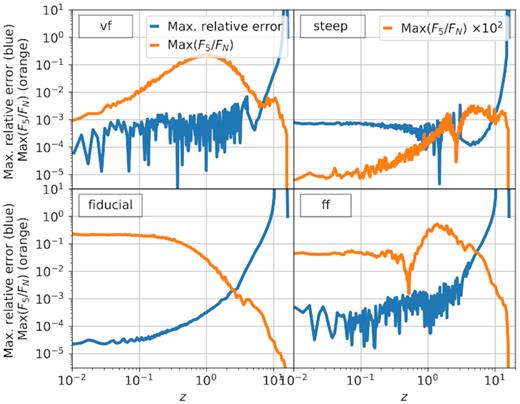
The blue curves correspond to the maximum relative difference between the scalar field values obtained from the N-body simulations and the ones we obtained from the gravitational potential by assuming υ is zero in equation (26). The gravitational potential was obtained by solving Poisson’s equation with the same solver that was used to run the simulations. The orange curves are the maximum ratio between the fifth force |${\boldsymbol {F}}_\Psi$| and gravity Fϕ. By comparing blue and orange curves, we can confirm that the times where the relative error associated with the approximation is large, the force is small and thus, no measurable effect should appear in the density distribution. We show results from 2D slices that pass through the centre of the 3D box. See Section 5.3 for explanation.
These high-redshift differences can be reduced by choosing more accurate initial conditions (for instance, generated as a realization of a linear power spectrum). However, given that they occur at a moment in the history of the Universe when the fifth force is negligible, is it likely that they will not affect the matter distribution. We confirmed this by plotting the maximum ratio between the fifth force Fϕ and gravity |${\boldsymbol {F}}_\Psi$| on the 2D slices as a function of time (orange curves in Fig. 7). As expected, the fifth force is sub-dominant at high redshift. By the moment in which the fifth force goes above 1 per cent of the Newtonian force, the error in our prediction of the scalar field is already below 0.1 per cent and continues decreasing from there.
The good agreement that we found between exact and approximate solutions shows that it does make sense to run disformal gravity cosmological simulations by using equation (26) instead of a hyperbolic solver (as described at the end of Section 3.2). This will largely reduce the overhead associated with the MG solver and will make disformal simulations competitive in terms of speed. The impact of this approximation in the predicted power spectrum of density perturbations will be presented in a companion paper.
5.4 Direction of the fifth force
In Section 3.4, we discussed a sufficient condition for the presence of repulsive fifth forces (i.e. opposite to gravity), which is condensed in equations (36) and (37). Given that our simulations track the evolution of the scalar field without making any approximations or simplifications in the equations, it is possible to use the simulated force field to confirm if repulsive forces do exist in a realistic set-up. Fig. 8 shows the cosine of the angle between the Newtonian and fifth forces in the same slices and for the same redshifts and simulations we presented in Fig. 5. Dark red and blue correspond to parallel and antiparallel forces and the numbers to the left of the colour bar make reference to the redshift of each slice.
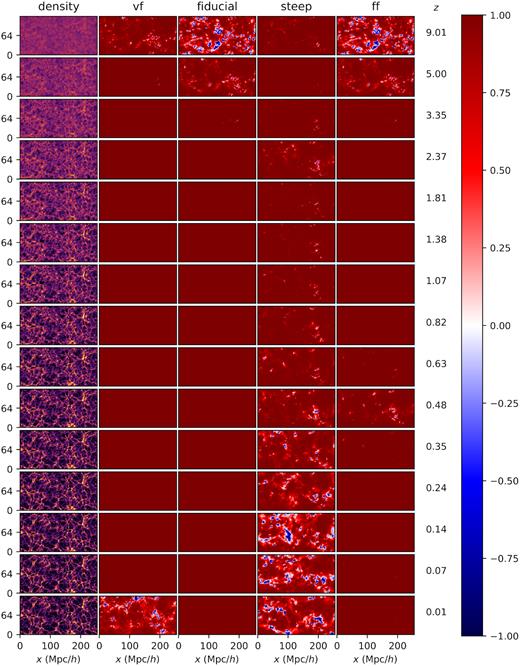
Cosine of the angle between Newtonian and fifth force as a function of time and simulated model. Dark red and blue correspond to force fields that are parallel or antiparallel, respectively. The numbers to the left of the colour bar correspond to the redshift of each row.
The panels show that all the simulations produce repulsive forces at high redshift, however these occur during the warm up phase of the simulation in which the scalar field transitions from the initial condition (ϕ = 0) to a distribution that is consistent with the density field (see discussion in the previous section). Moving forward in time, we see that repulsive forces appear only at specific redshifts. These redshift values are consistent with the discussion presented in Section 3.4, where we found that repulsive forces will occur in the zeros of the function ξ0. This is confirmed in Fig. 9, where we show the fifthpercentile of the distribution of the angle between the forces as a function of scale factor for the 2D slices. The vertical arrows are the zeros of ξ0, which are consistent with the moments in which the forces become antiparallel.
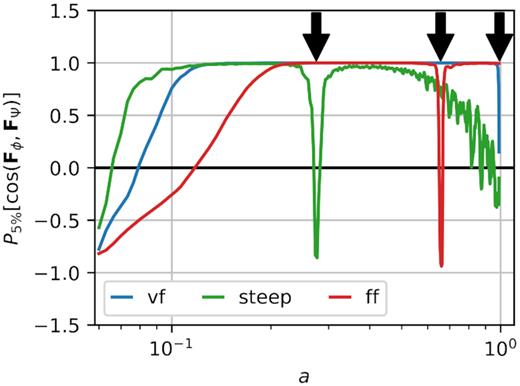
Percentile five of the distribution of the cosine of the angle between the Newtonian and fifth force as found in the 2D slides of our 3D simulations. We show only the models for which we expect repulsive forces associated with the zeros of ξ0: VF, FF, and Steep. The vertical arrows show the zeros of ξ0 for these models.
6 SIMULATION RESULTS: IMPACT OF THE FIFTH FORCE ON THE MATTER DISTRIBUTION
We describe now the effects that the presence of the fifth force has on the distribution of matter. We do this by studying differences between the power spectrum of dark matter density perturbations of the GR and MG simulations. We do firstly the analysis for the models that have β = 0 and discuss a posteriori the differences induced by adding a dependence of the coupling with the scalar field through β.
6.1 Power spectrum of models with β = 0
Fig. 10 shows the time evolution of the relative difference between the MG and GR power spectra for the models that have a constant disformal coupling (i.e. with β = 0). Different panels correspond to the different models that we simulated and different lines within each panel to different redshifts. In the Steep run, the evolution is very close to GR, and thus we multiplied these curves by 104. As the curves have positive and negative values, we show their absolute values and highlight the negative parts with dotted lines.
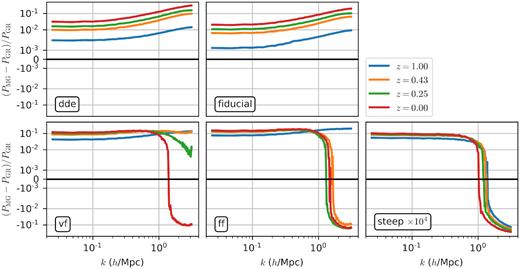
Relative difference between MG and GR dark matter power spectrum from all the simulations. The values obtained from the Steep simulation are much smaller than the scale used for the other models, and thus we multiplied them by 104 for presentation purposes only.
The models can be divided in two different categories: those in which the fifth force produces a monotonic increase of power with respect to GR (models DDE and Fiducial) and those that have a monotonic increase until some specific redshift and then continue increasing at large scales, but have a slower evolution than GR at small scales (models FF, VF, and Steep).
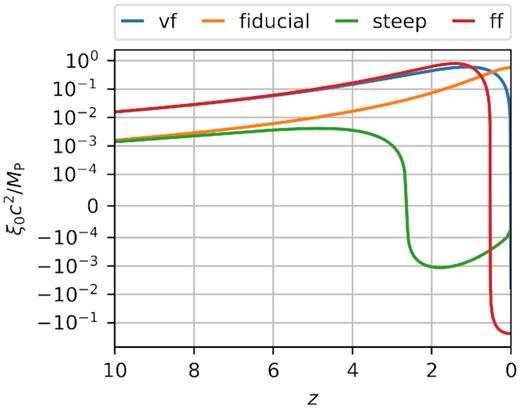
Some insight on the phenomenology associated with these curves can be gained by comparing the amplitude of the fifth force with the gravitational force. By assuming that δd is second order in equation (32), we can obtain equation (35). If we further assume |$\nabla \times \boldsymbol {k} \ll 1$|, we find that the amplitude of the fifth force for a particular set of parameters depends exclusively on the background quantity |$\eta _0^2$|, which we show in Fig. 11 for all the simulated models as a function of the expansion factor a. Since the values of the DDE run are very close to those of the Fiducial run, we excluded them from this plot. The discontinuities in the derivatives of these curves are not real, but related to the log scaling of the vertical axis. However, these discontinuities do have a physical meaning, since they occur at moments when the parameter ξ0 changes sign (see Fig. 6).
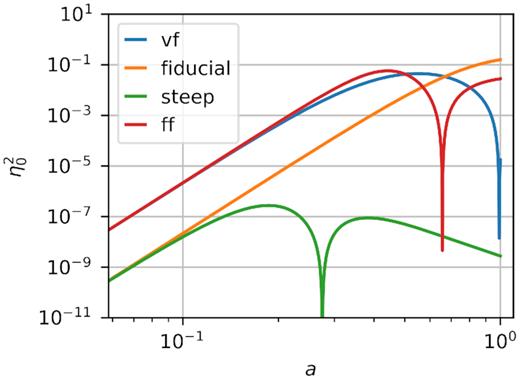
Time evolution of the dimensionless coefficient η2 that relates Newtonian and fifth force fields when calculated with background quantities for the simulated models. The DDE model is similar to the Fiducial one and thus, is not shown to avoid overcrowding the plot. The discontinuities in the derivatives are not real, but produced by the log scaling.
From these curves, we can see that the pairs of models M1 = (Fiducial, Steep) and M2 = (VF, FF) have identical forces at high redshift and so it is expected that their early-time evolution will be identical. The fact that |$\eta _0^2$| of the models M2 is more than two orders of magnitude larger than that of the modes M1 is responsible for the large differences found in Fig. 10: models M2 have a much faster evolution, reaching differences with respect to GR of more than 10 per cent at large scales. Note that the model FF has a smaller coupling constant than the Fiducial model. Naively, one will expect that a smaller coupling constant will be associated with a slower evolution, however, the particulars of the definition of |$\eta _0^2$| (in particular, the functions ξ and gϕ) give stronger forces in the FF case.
Comparison between the Steep and Fiducial values of |$\eta _0^2$| show that even if both models share the same force fields at high redshift, they depart from each other later on. In the Steep simulation, the forces stay always close to zero and thus differences in the power spectrum with respect to GR are minimal.
Fig. 11 can also help us understand why the power spectrum of the MG simulations goes below the GR values at low redshifts. In particular, it is possible to see that the moment in which (PMG − PGR)/PGR starts moving back to zero corresponds to the moment in which |$\eta _0^2$| starts decreasing and approaches zero. Also, this change in the behaviour of the power spectrum occurs at small scales, where the structure of the haloes dominates the signal. These facts are consistent with a decrease of power in MG simulations induced by an expansion of the haloes when the fifth force disappears and the kinetic energy of the dark matter particles dominates.
Finally, we would like to point out that late evolution of the models DDE and Fiducial is almost scale independent. After an initial shape is given to the difference between MG and GR, that shape is almost conserved later on. Departure from scale invariance evolution of these curves occurs close to the Nyquist frequency of the simulations, and thus higher resolution simulations should be run in order to confirm this result.
Note that our analysis based on |$\eta _0^2$| does not take into account the back-reaction that the presence of the fifth force has on the metric perturbations (through changes in the density distribution). However, this effect was taken into account in the simulations, which are fully self-consistent.
6.2 Response of the power spectrum to changes in β
In this section, we discuss the impact that the parameter β, which determines the slope of the disformal coupling, has on the power spectrum of density perturbations. Fig. 12 shows a comparison between simulations that were run with β = 0 and β = ±10. The left-hand and right-hand panels correspond to the base models DDE and FF, respectively. Continuous and dotted lines correspond to positive and negative values of β.
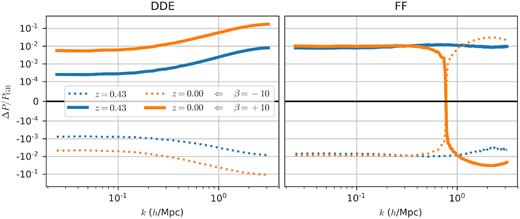
Relative difference between dark matter power spectra of simulations with β equal and different than zero. The left-hand and right-hand panels correspond to the DDE and FF models, respectively. Different colours are different redshifts and different line styles correspond to simulations run with β = −10 and β = 10. The sharp transition between positive and negative values in the right-hand panel is generated by the symlog scaling that we use to be able to plot positive and negative values.
The left-hand panel shows that allowing β to be different than zero in the DDE model has a monotonic effect with frequency. Positive values of β force the coupling to go up with the value of the field (see equation 4), which in turn increases the power with respect to the base model defined by β = 0. As in this model, the power increases with respect to GR, the net effect is a faster evolution with respect to GR. The opposite happens when β is negative: the coupling decreases as the field rolls down the potential, and thus reduces the impact of MG in the power spectrum. This decrease in power is relevant when it comes to use perturbations to further constrain the parameter space of this model. In the previous section, we showed that even if the DDE model is compatible with CMB observations (van de Bruck & Mifsud 2018) it gives an increase in the power spectrum of about 10 per cent at k ∼ 3 h Mpc−1, which might be too large for it to be compatible with galaxy surveys. This being a problem or not will naturally depend on the galaxy formation model used to connect these predictions with the actual distribution of galaxies. In case this is indeed a problem, we show here that it can be alleviated by choosing negative values for β. In fact, the relative difference between the simulation that was run with β = −10 and β = 0 at the Nyquist frequency is of the same order than the effect that the base model with β = 0 has with respect to GR and thus can reduce the MG effects by a factor of about 2.
The effects of β in the FF model are more complex. A positive coupling constant β has the same effect in the power spectrum as in the DDE model at large scales (i.e. it induces an increase in power). However, at small scales, the impact of MG in the power spectrum decreases with respect to the base model with β = 0. Note that the same happens when comparing the base model with GR, however the transition between positive and negative MG effects occurs at different frequency k. The net effect of assuming positive β is to increase even more the power with respect to GR at large scales and reduce it at small scales. The opposite occurs when β is assumed to be negative: there is a reduction of power at large scales and an increase at small scales. As in the DDE case, allowing β to move away from zero may help in reducing the problem that we found in previous section with excessive increase in power at large scales. However, in this case, the effects of β are one order of magnitude below the effect produced by the base model with β = 0 and thus, including β cannot save the model (at least not with the parameter we choose, which is equal to −10).
7 CONCLUSIONS
We studied new phenomenology that arises when adding a disformal coupling to a very simple and well-known extension to general relativity (GR) such as the quintessence model. The paper is divided in two main parts. We first discuss analytical properties of the solutions of the field equation for the background as well as the perturbations. In the second part, we present cosmological non-linear simulations that we run with the code isis (Llinares et al. 2014), which is based on the particle mesh code ramses (Teyssier 2002). We use the simulated data to show how our analytic predictions perform in realistic situations associated with the non-linear regime of cosmological evolution.
We start by describing background solutions of the Klein–Gordon equation for an Einstein–de Sitter cosmology. We found that the shape of the solution depends on only two parameters D and F (see equations 12 and 13), which are combinations of the original four free parameters (V0, ν, B0, and β). In the case F = 0, we identified three different characteristic time scales (shown in Table 1 and Fig. 2), which determine the structure of the solution. These scales consist in a transition between a disformal regime and a quintessence regime and a transition between these two regimes and a non-linear regime that occurs when the fields grow to the point that it is not possible to linearize the potential V. Assuming F ≠ 0 changes the definition of these time scales for F > 0 and induces an instability in the case F < 0, for which we provide a condition on its associated time-scale.
The first part of the paper also deals with analytic properties of the perturbed Klein–Gordon equation. In particular, we show that there is an approximate proportionality relation between the perturbed scalar field and the scalar perturbations of the metric. The relation can be simplified by substituting the fields that constitute the proportionality factor with background quantities. By analysing the modified geodesics equation, we also show that a similar relation exists between the Newtonian force and the fifth force that arises from the scalar field. We close the analytic section by discussing the conditions under which the fifth force can be repulsive. This is relevant in the context of the tension that is known to exist between measurements of the normalization of density perturbations in the universe using high and low-redshift data sets (Addison et al. 2016; Kitching et al. 2016; Planck Collaboration 2016b; Couchot et al. 2017).
In the second part of the paper, we first used our N-body simulations to study properties of the field distribution. Very good agreement was found between the exact solution obtained by the non-linear hyperbolic solver of the cosmological code (which can solve the equation without relying on any assumptions or approximations) and the prediction obtained following the proportionality relation with the metric perturbations. This shows that, although the model is very complex, it can be simulated with a very simple algorithm based on the solution of the Poisson’s equation, which exists in any standard gravity cosmological code. We will present in a companion paper a detailed analysis of the accuracy with which the method can predict the evolution of matter.
An additional result associated with the simulated fields is that the perturbations do not grow monotonically with time, but can undergo oscillations. Combining these results with our analytic results, we show that these oscillations cannot be sustained, but that field perturbations can have at most one maximum and one minimum and that ultimately will decrease towards zero. The time-scale for these oscillations naturally depends on the model parameters.
Our simulations also show that the repulsive forces that we predicted analytically do emerge in realistic situations. We found that depending on the model parameters, repulsive forces can appear as transients that occur only at specific redshifts or be sustained in time. In both cases, the existence of forces is related with the zeros of the function ξ0, which connects metric and scalar field perturbations.
It is worth mentioning that repulsive forces may arise in laboratory experiments aimed to the detection of fifth forces (e.g. Burrage, Copeland & Hinds 2015; Brax & Davis 2016; Burrage & Copeland 2016; Burrage, Copeland & Stevenson 2016a; Burrage et al. 2016b; Jaffe et al. 2017; Llinares & Brax 2019). Since these effects are encoded in the term ∇ × k defined in equation (35) and this term is exactly zero in spherical symmetry, a spherically symmetric experiment will not give rise to repulsive forces. More complex matter distributions are needed to give the desired effect. In other words, the presence of repulsive forces (which are opposite to gravity independently of the force that is associated with the walls of the experiment) can be tested by comparing results obtained with different distributions of matter (e.g. spherical versus cubic). Note that this reasoning can be done only after evaluating the coefficient (1 − δd)η2 in the background (see derivation of equation 32). Relaxing this assumption may give additional mechanisms for the realization of repulsive forces.
We complete the analysis of our simulations by studying how the fifth force that arises from the scalar field affects the matter distribution. In particular, we focus on the power spectrum of density perturbations. For the models that have β = 0 (i.e. a constant disformal coupling), we show that models with weak coupling produce an increase of power at small scales, which is almost scale invariant at late times. Models with larger coupling have an early increase in power, which is followed by a decrease. In these cases, the fifth force is such that it reduces the clustering with respect to GR. We also studied the impact of β in the density perturbations. We found that positive or negative β, increase or decrease the effects of the fifth force at all scales.
Only one of all the simulated models (the DDE model) provides a background cosmology that is consistent with CMB data. However, the aim of this work is not to provide best parameters, but to highlight new phenomenology. The effects that we describe here may also appear in similar models which may be consistent with background data for different sets of parameters. In other words, it may be possible to build models with effects similar to those discussed here and that at the same time provide a background that is consistent with data.
ACKNOWLEDGEMENTS
Many thanks to Jack Morrice for helpful discussions and David Bacon and Kazuya Koyama for carefully reading the manuscript. We also thank the Research Council of Norway for their support. CL acknowledges support from Science and Technology Facilities Council. (STFC) consolidated grant ST/L00075X/1 and ST/P000541/1, and European Research Council (ERC) grant ERC-StG-716532-PUNCA. The simulations used in this paper were performed on the NOTUR cluster FRAM. This paper is based upon work from COST action CA15117 (CANTATA), supported by COST (European Cooperation in Science and Technology).
Footnotes
We derived this special case by taking into account the early redshift solution (equation A5) together with the definitions provided in Section 3.1 and the definition of ξ0.
REFERENCES
APPENDIX A: ASYMPTOTIC SOLUTIONS FOR BACKGROUND FIELDS FOR AN EINSTEIN–DE SITTER UNIVERSE
Tables A1 and A2 summarize solutions of the Klein–Gordon equation described in Sections 3.1.1 and 3.1.2. These are solutions for the limits (D, F) → 0 (Table A1) and F → 0 (Table A2) for small and large values of the field and with and without including the damping term in the equation.
General properties of background solutions of the quintessence model. See Section 3.1.1 for explanation.
 |
|
General properties of background solutions of the quintessence model. See Section 3.1.1 for explanation.
|
|
General properties of background solutions of models with conformal coupling.
 |
|
General properties of background solutions of models with conformal coupling.
|
|
APPENDIX B: NON-EDS BACKGROUND SOLUTIONS
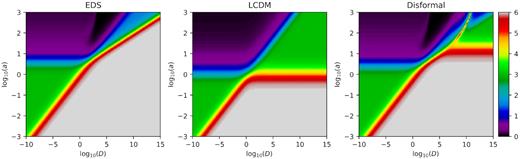
Colour coded is the logarithmic slope of the solution of the background Klein–Gordon equation for the disformal model with β = 0 and three different models for the background expansion: Einstein–de Sitter, ΛCDM (with a cosmological constant) and disformal model with ν = 100. The EDS model is the same as shown in Fig. 2, with the difference that here we used expansion factor as independent variable and thus, the exact values of the slopes are different.
The model presented in the left-hand panel assumes the background metric is EDS. The solutions are the same that we presented in Fig. 2; although here we show derivatives with respect to log (a) instead of time and thus, the exact numbers of the slope in different regimes are different. The central panel shows the result of assuming a ΛCDM background. The presence of a dark energy component changes the behaviour of the model for large values of D: instead of a transition to the disformal non-linear regime (see Fig. 2 for nomenclature), we have a transition to the quintessence linear regime, which occurs at values of a that are independent of D. The right-hand panel shows an example of the complete solution, in which the energy of the scalar field is included in the Friedmann equations (which results in additional terms in the equation for the density parameter Ωm). Here, the new transition that occurred at large values of D in the previous case is not only delayed, but also has a complex dependence with D. Different solutions occur for different values of ν.
