


Abstract
High-mass galaxies, with halo masses |$M_{200}\ge 10^{10}\, {\rm M}_{\odot }$|, reveal a remarkable near-linear relation between their globular cluster (GC) system mass and their host galaxy halo mass. Extending this relation to the mass range of dwarf galaxies has been problematic due to the difficulty in measuring independent halo masses. Here we derive new halo masses based on stellar and H i gas kinematics for a sample of nearby dwarf galaxies with GC systems. We find that the GC system mass–halo mass relation for galaxies populated by GCs holds from halo masses of M200 ∼ 1014 M|$\odot$| down to below M200 ∼109 M|$\odot$|, although there is a substantial increase in scatter towards low masses. In particular, three well-studied ultradiffuse galaxies, with dwarf-like stellar masses, reveal a wide range in their GC-to-halo mass ratios. We compare our GC system–halo mass relation to the recent model of El Badry et al., finding that their fiducial model does not reproduce our data in the low-mass regime. This may suggest that GC formation needs to be more efficient than assumed in their model, or it may be due to the onset of stochastic GC occupation in low-mass haloes. Finally, we briefly discuss the stellar mass–halo mass relation for our low-mass galaxies with GCs, and we suggest some nearby dwarf galaxies for which searches for GCs may be fruitful.
1 INTRODUCTION
The total mass of a globular cluster (GC) system reveals a remarkable, near-linear correlation with the total mass of its host galaxy halo over four decades in galaxy mass and which is largely insensitive to galaxy type or environment (Spitler & Forbes 2009; Georgiev et al. 2010; Hudson, Harris & Harris 2014; Harris, Harris & Hudson 2015). This correlation indicates a close scaling between GC systems and galaxy dark matter haloes and suggests that it was established during the initial phases of galaxy formation (e.g. Boley et al. 2009), with subsequent evolution changing both GC and halo mass in roughly equal proportions (e.g. Kravtsov & Gnedin 2005).
Based on weak lensing results, Spitler & Forbes (2009) matched GC system masses (MGC) statistically to galaxy halo masses (M200) using their known host galaxy stellar masses (M*). The resulting trend between GC system and halo mass was consistent with a linear relation for halo masses 1010 < M200/M|$\odot$| < 1014, with MGC/M200 ≃ 5 × 10⁻⁵. At higher masses an uncertain correction for intracluster GCs was needed. At lower masses, the M*–M200 relation became very unreliable due to the difficulty of measuring halo masses with weak lensing. Spitler & Forbes (2009) concluded that ‘... the correlation [of GC system mass and halo mass] for low galaxy masses must be confirmed with better halo mass estimates’.
In subsequent work, Georgiev et al. (2010) assumed M* ∝ |$M_{200}^{1.2}$| (based on the models of Dekel & Birnboim 2006 for low-mass dwarf galaxies), extending the GC system relation to lower masses. Assuming this relation holds, they found early- and late-type galaxies to have a similar relation, albeit with increased scatter at low masses. They suggested that the lowest mass galaxy that can, on average, host a single GC will have a luminosity of MV ∼ –9. This lower limit has since been surpassed with the discovery of the single old GC in the galaxy Eridanus II (which itself has a luminosity, MV = −7.1, less than that of the typical Milky Way GC; Crnojević et al. 2016). Its GC is roughly two orders of magnitude less massive than a typical Milky Way GC (i.e. |${\sim }2\times 10^5\, {\rm M}_{\odot }$|).
Hudson et al. (2014), using weak lensing results from the Canada–France–Hawaii Telescope Lensing Survey (CFHTLenS; Hudson et al. 2015) and the data base of GC systems from Harris, Harris & Alessi (2013), were able to extend the relation down to stellar masses of M* ∼ 108 M|$\odot$|. They measured a GC system mass to halo mass ratio of 4 (× 10−5) compared to 5.5 by Georgiev et al. (2010) and 7 by Spitler & Forbes (2009). The recent study of Harris, Blakeslee & Harris (2017) extended the relation in halo mass but only added one galaxy [the Fornax Dwarf Spheroidal (dSph)] with a halo mass below 1010 M|$\odot$|.
We also note the work of Zaritsky, Crnojević & Sand (2016) who focused on Eridanus II and its sole GC. On the assumption that the Behroozi, Conroy & Wechsler (2010) stellar mass–halo mass relation (i.e. M* ∝ |$M_{200}^{1.4}$|) extends down to the Eridanus II galaxy mass regime (|$M_{\ast } = 6 \times 10^4\, {\rm M}_{\odot }$|), they concluded that its GC obeys the GC system mass–halo mass relation.
Recently, El-Badry et al. (2018) have followed the hierarchical assembly of GC systems using a semi-analytical model. Their model has no causal connection between GCs and dark matter. Instead, they suggest that a long history of galaxy mergers results in a linear GC system mass–halo mass relation for high-mass systems At low halo masses they predict a non-linear relation with such systems ‘...retain[ing] the most information about the physical conditions under which GCs formed’. Below |$M_{200} \sim 3 \times 10^{10}\, {\rm M}_{\odot }$|, they predict most haloes to have no GCs as the result of low gas accretion rates and relatively high outflow rates.
Here we collect data on dwarf galaxies with known bona fide GCs (i.e. compact star clusters, older than several Gyr) in the Local Group. This is supplemented by old GCs in dwarf galaxies in nearby low-density environments. We use either the stellar velocity dispersion or the H i gas rotation to derive a total halo mass for individual galaxies. We also add up the masses of the individual GCs in each galaxy rather than simply using a mean mass multiplied by the number of GCs. Although this latter approach is reasonable for estimating the total GC system mass of massive galaxies (Spitler & Forbes 2009; Hudson et al. 2014), it would lead to significant errors for low-mass galaxies. We then revisit the GC system mass–halo mass relation. In Appendix A, we list some nearby dwarf galaxies with GCs but no kinematic information; in Appendix B nearby dwarfs with no reported GCs, but for which a detailed search for GCs may prove successful; and in Appendix C, we show the GC number versus halo mass relation as an illustration of why GC masses need to be determined individually for low-mass galaxies.
2 LOCAL GROUP DWARF GALAXIES WITH GC SYSTEMS
The Local Group and its immediate surroundings contain over 100 galaxies (e.g. McConnachie 2012). The vast majority are dwarf galaxies fainter than MV ∼ –18, with only a dozen or so reported to host a GC system. In Table 1, we list the seven Local Group dSph and dwarf elliptical (dE) galaxies (the most massive being NGC 205) that lie within the ‘zero velocity surface’ (i.e. within a distance of 1060 kpc) of the barycentre, and for which we were able to find mention in the literature of at least one associated GC and a stellar velocity dispersion for the host galaxy. Given the ongoing discovery of faint satellites and their GCs (e.g. Crnojević et al. 2016; Cole et al. 2017), the list is probably far from complete but summarizes the current situation. The number of reported GCs associated with each galaxy may go up or down over time. For example, some GCs may be missed as the search area does not reach out to a significant fraction of the virial radius (which is around a hundred times the galaxy effective radius), or they may lie below the detection limit of the imaging survey (although such faint, low-mass GCs may only have a small effect on the total GC system mass). Alternatively, the number of GCs may be overestimated if they are incorrectly identified foreground stars, nuclear clusters, background galaxies, or young massive clusters within the host galaxy. Overall, the census of Local Group GCs is probably close to complete, with a slight bias towards being an underestimate of the true number. However, a final complication is that many of the Local Group galaxies are satellites that have suffered tidal stripping (e.g. Ibata et al. 1997; Read et al. 2006b). This can physically lower the GC content, the current dynamical halo mass, and the stellar mass, moving galaxies off of the GC–halo mass relation of isolated galaxies (for a discussion of this with regards the stellar mass–halo mass relation of satellites; see e.g. Read & Erkal 2018).
Pressure-supported Local Group dwarfs with globular clusters and velocity dispersion measurements.
| Name | Type | MV | M* | |$M_{\rm H\, {\small I}}$| | Re | σ | log M200 | NGC | MGC | GC Ref |
|---|---|---|---|---|---|---|---|---|---|---|
| (mag) | (107 M|$\odot$|) | (107 M|$\odot$|) | (pc) | (km s−1) | (M|$\odot$|) | (104 M|$\odot$|) | ||||
| Sagittarius | dSph | −15.5 | 13.2 | – | 2587 (219) | 11.4 (0.7) | 10.78 | 8 | 278 | L10 |
| Fornax | dSph | −13.4 | 2.0 | 0.017 | 710 (70) | 11.8 (0.2) | 9.06 | 5 | 73 | M03 |
| Eridanus II | dSph | −7.1 | 0.0059 | – | 280 (28) | 6.9 (1.1) | 9.05 | 1 | 0.4 | Cr16 |
| NGC 205 | dE | −16.5 | 34.0 | 0.040 | 590 (31) | 35.0 (5.0) | 9.83 | 11 | 140 | D88 |
| NGC 185 | dE | −14.8 | 7.1 | 0.011 | 458 (45) | 24.0 (1.0) | 10.64 | 8 | 68 | V13 |
| NGC 147 | dE | −14.6 | 5.9 | – | 623 (62) | 16.0 (1.0) | 9.27 | 10 | 130 | V13 |
| And I | dSph | −11.7 | 0.40 | – | 672 (69) | 10.6 (1.1) | 9.28 | 1 | 0.37 | C17 |
| And XXV | dSph | −9.7 | 0.065 | – | 642 (75) | 3.0 (1.0) | 7.12 | 1 | 1.5 | Cu16 |
Note. The top half of the table lists dwarfs associated with the Milky Way and the lower half with the Andromeda galaxy. Absolute magnitude (MV), stellar mass (M*), H i gas mass (|$M_{\rm H\, {\small I}}$|), half-light radius (Re), and central velocity dispersion (σ) are taken from the compilation of McConnachie (2012) and online updates. M/LV = 1 is used to calculate stellar mass. For Sagittarius see text for details. For Eridanus II data come from the discovery paper. The number of GCs (NGC) is taken from the GC reference: L10 – Law & Majewski (2010); M03 – Mackey & Gilmore (2003); Cr16 – Crnojević et al. (2016); D88 – Da Costa & Mould (1988); V13 – Veljanoski et al. (2013); C17 – Caldwell et al. (2017); and Cu16 – Cusano et al. (2016). See text for details of how the GC system mass (MGC) and halo mass (M200) are calculated. The online version of this table includes errors on the halo mass.
In Tables 1 and 2 we list only objects for which we have some confidence that they are bona fide old-aged GCs. The mass of each GC system is calculated from the individual GC luminosities and assuming M/LV = 1.88 (McLaughlin & van der Marel 2005), as also used by (Georgiev et al. 2010). Table 1 includes the host galaxy type, luminosity (MV), stellar mass (M*), H i gas mass (|$M_{\rm H\, {\small I}}$|), projected half-light radius (Re), and stellar velocity dispersion (σ) from the compilation of McConnachie (2012) or its online update (dated 2015 September). To calculate the stellar mass we adopt M/LV = 1 as used by McConnachie. This is appropriate for a very metal-poor stellar population of mean age 5 Gyr. An older mean age of 10 Gyr would imply higher galaxy stellar masses by a factor of 2 (i.e. M/LV ∼ 2; Maraston 2005). Although the low-mass galaxies we study here are mostly very metal-poor, they do reveal a diversity of star formation histories with some revealing star formation to recent times. In a detailed study of 40 Local Group dwarfs, Weisz et al. (2014) found those with |$M_{\ast } \gt 10^5\, {\rm M}_{\odot }$| (as studied in this work) to have, on average, formed ∼70 per cent of their stellar mass within the last 10 Gyr. Thus, the use of M/LV = 1 for our Local Group sample is a reasonable approximation, on average, but may systematically differ by factor of 2 for individual galaxies. The velocity dispersion is based on a number of observed stars in the central regions of each galaxy and so can be regarded as a central velocity dispersion (McConnachie 2012).
Rotationally supported dwarf galaxies with globular clusters and H i rotation measurements.
| Name | Type | MV | M* | |$M_{\rm H\, {\small I}}$| | log M200 | NGC | MGC | |$v$|max |
|---|---|---|---|---|---|---|---|---|
| (mag) | (10|$^7\, {\rm M}_{\odot }$|) | (107 M|$\odot$|) | (M|$\odot$|) | (104 M|$\odot$|) | (km s−1) | |||
| LMC | Irr | −18.36 | 162.7 | 44.1 | 11.16 | 16 | 330 | 91.7 (18.8) |
| SMC | Irr | −16.82 | 36.9 | 51.2 | 10.56 | 1 | 32 | 60.0 (5.0) |
| NGC 6822 | dIrr | −15.2 | 10.3 | 13 | 10.47 | 8 | 126 | 56 (2.2) |
| WLM | dIrr | −14.2 | 4.1 | 0.61 | 9.95 | 1 | 50.4 | 39 (3.3) |
| Pegasus | dIrr | −12.2 | 0.65 | 0.59 | 8.50 | 1 | 11.5 | 13.8 (5.0) |
| Aquarius | dIrr | −10.6 | 0.15 | 0.41 | 8.82 | 1 | 1.46 | 17.8 (9.5) |
| DDO 52 | Im | −14.98 | 6.38 | 19.9 | 10.32 | 2 | 17.6 | 50.7 (13.4) |
| ESO 059 − 01 | IBsm | −14.60 | 5.08 | 8.26 | 10.45 | 1 | 143.9 | 55.2 (1.9) |
| ESO 121 − 20 | Im | −13.64 | 0.98 | 11.4 | 9.49 | 1 | 4.04 | 28.1 (1.0) |
| ESO 137 − 18 | Ssc | −17.21 | 68.0 | 34.1 | 10.67 | 7 | 111.2 | 64.5 (2.0) |
| ESO 154-023 | SBm | −16.38 | 19.9 | 81.7 | 10.43 | 3 | 3.52 | 54.4 (1.9) |
| ESO 223 − 09 | IB | −16.47 | 22.6 | 63.8 | 10.50 | 8 | 307.8 | 57.7 (2.7) |
| ESO 269 − 58 | I0 | −15.78 | 30.1 | 2.31 | 9.60 | 8 | 76.9 | 29.8 (2.0) |
| ESO 274 − 01 | Scd | −17.47 | 151.1 | 20.1 | 10.86 | 10 | 130.6 | 74 (2.5) |
| ESO 381 − 20 | IBsm | −14.80 | 5.40 | 15.7 | 9.91 | 1 | 2.28 | 37.8 (1.5) |
| ESO 384 − 016 | dS0 | −13.72 | 1.80 | 0.50 | 7.77 | 2 | 5.83 | 8.4 (0.9) |
| IC 1959 | SBsm | −15.99 | 14.1 | 18.7 | 10.51 | 7 | 172.3 | 57.4 (0.9) |
| KK 16 | Irr | −12.38 | 0.52 | 0.69 | 7.99 | 1 | 2.08 | 9.8 (0.3) |
| KK 17 | Irr | −10.57 | 0.10 | 0.55 | 8.16 | 1 | 1.09 | 11.0 (0.5) |
| KK 246 | Irr | −13.77 | 0.97 | 11.9 | 10.07 | 2 | 41.0 | 42.0 (2.0) |
| KK H77 | Irr | −14.58 | 3.98 | 4.67 | 9.48 | 2 | 27.11 | 27.8 (1.1) |
| NGC 1311 | SBm | −15.76 | 11.7 | 8.74 | 9.89 | 5 | 68.3 | 37.2 (0.4) |
| NGC 247 | SBd | −18.76 | 232.5 | 137.1 | 11.39 | 25 | 398.2 | 108 (2.0) |
| NGC 4163 | Irr | −14.21 | 1.92 | 1.42 | 8.87 | 2 | 111.5 | 18.1 (0.8) |
| NGC 4605 | SBd | −18.41 | 172.9 | 25.8 | 10.58 | 22 | 350.4 | 60.8 (2.0) |
| NGC 5237 | Irr? | −15.45 | 15.5 | 3.10 | 9.87 | 3 | 53.2 | 36.7 (1.5) |
| NGC 784 | SBdm | −16.87 | 84.6 | 28.9 | 10.66 | 6 | 40.7 | 47.5 (1.0) |
| UGC 1281 | Sdm | −15.30 | 12.6 | 16.4 | 10.47 | 2 | 31.9 | 56.4 (1.4) |
| UGC 3755 | Im | −15.50 | 9.28 | 13.9 | 8.79 | 9 | 239.3 | 17.1 (0.6) |
| UGC 4115 | Im | −15.12 | 8.52 | 20.9 | 10.00 | 5 | 29.9 | 40.2 (1.1) |
| UGC 685 | Im | −14.35 | 3.22 | 5.88 | 10.03 | 5 | 136.9 | 41.0 (1.2) |
| UGC 8760 | IBm | −13.16 | 1.08 | 1.86 | 8.45 | 1 | 1.33 | 13.4 (0.3) |
| UGC A86 | Im | −16.13 | 16.5 | 48.2 | 10.59 | 11 | 1148.9 | 60.9 (2.3) |
| UGC A92 | Im | −14.71 | 4.48 | 7.62 | 9.68 | 2 | 46.1 | 32.1 (1.3) |
| NGC 1427A | IBsm | −18.50 | 199.4 | 176.6 | 10.16 | 38 | 605.3 | 44.9 (1.6) |
Note: The upper half of the table are irregular galaxies in the Local Group and the lower half are isolated late-type dwarf galaxies. Galaxy type, absolute magnitude (MV), stellar mass (M*), and H i mass (|$M_{\rm H\, {\small I}}$|) come from McConnachie (2012) for Local Group dwarfs and from Georgiev et al. (2010) for isolated dwarfs (and the LMC/SMC). The halo masses (M200) are derived from |$v$|max (see text for details). The number of GCs (NGC) and GC system mass (MGC) for isolated dwarfs come from Georgiev et al. (2010). The online version of this table includes errors on the halo mass.
2.1 Obtaining halo masses for pressure-supported galaxies
2.2 Obtaining halo masses for rotationally supported galaxies
Where available, we obtain |$v$|max from rotation curves, using the peak value at the point where the rotation curve becomes flat. For NGC 6822, WLM, DDO 52, and DDO 210 (Aquarius) we take these values from the recent re-analysis of the Little Things data in Read et al. (2017) and Iorio et al. (2017). For NGC 784 and UGC 1281, we use data from Moiseev (2014). For IC 1959 and NGC 1311, we use data from Mathewson & Ford (1996). For NGC 247, we use data from Carignan & Puche (1990). For KK 246, we use data from Kreckel et al. (2011). For the Large Magellanic Cloud (LMC) we use the rotation curve traced by young stars from van der Marel & Sahlmann (2016), and for the Small Magellanic Cloud (SMC) we use the H i rotation curve of Stanimirović, Staveley-Smith & Jones (2004). For the remainder of the dwarfs, the |$v$|max are derived from a line width profile, not a rotation curve (Makarov et al. 2014). This can cause significant scatter in the derived M200 (e.g. Brook & Shankar 2016; Brooks et al. 2017; Schneider et al. 2017). We discuss this further in Section 3. Note that several dwarfs in our sample show irregular rotation curves, indicative of them being out of equilibrium (e.g. Read et al. 2016b). This includes Pegasus (Read et al. 2016b) that we discuss further in Section 3.
We interpolate an array of |$v$|max(M200) that we then use to solve numerically for M200(|$v$|max). To account for errors in |$v$|max, we perform 5000 Monte Carlo draws of |$v$|max from its error distribution, assuming Gaussian uncertainties. For each draw, we solve for M200 while marginalizing over c200, as above.1 The halo masses derived in this way are listed in Table 2 (a machine-readable version with errors on log M200 is available as supplemental material).
In Table 3, we compare our halo masses for the Local Group dwarf irregular (dIrr) galaxies with those from the literature, i.e. Read et al. (2017) and Oh et al. (2015). Both of these studies fit dark matter profiles to the full H i data from the Little Things survey (a coreNFW profile for Read et al. and a NFW profile for Oh et al.). Our values show good agreement with both studies within our quoted uncertainties.
Comparison of log halo mass estimates.
| Name | This work | R17 | O15 | P16 |
|---|---|---|---|---|
| NGC 6822 | 10.47 ± 0.10 | 10.30|$^{+0.04}_{-0.07}$| | – | – |
| WLM | 9.95 ± 0.14 | 9.92|$^{+0.09}_{-0.12}$| | 10.09 | – |
| Pegasus | 8.50 ± 0.55 | 8.83|$^{+0.23}_{-0.21}$| | 9.02 | – |
| Aquarius | 8.82 ± 0.80 | 8.83|$^{+0.46}_{-0.38}$| | 8.80 | – |
| NGC 247 | 11.39 ± 0.12 | – | – | 11.10 |
Nearby dwarf galaxies with globular clusters but lacking kinematic data.
| Name | Type | MV | M* | NGC | MGC | Ref |
|---|---|---|---|---|---|---|
| (mag) | (106 M|$\odot$|) | (104 M|$\odot$|) | ||||
| Phoenix | dIrr | −9.9 | 0.77 | 4 | 3.1 | M99 |
| KKs 3 | dE | −10.8 | 4.5 | 1 | 35 | K15 |
| IKN | dSph | −11.5 | 3.4 | 5 | 80 | L14 |
| ScI-dE1 | dE | −11.5 | 3.4 | 1 | 7.5 | D09 |
2.3 Systematic errors in the derived halo masses
Although we estimate errors in the halo mass, as described above, there are a number of additional systematic uncertainties that are difficult to quantify. For example, the halo masses based on dynamical mass (Section 2.1) assume that the stellar system is in pressure-supported dynamical equilibrium with very little rotational contribution and the orbits are nearly isotropic (Walker, Mateo & Olszewski 2009a). For nearby early-type dwarfs moving in the tidal field of the Milky Way or Andromeda (e.g. Eridanus II and And XXV), the assumption of dynamical equilibrium may not be valid. An additional uncertainty comes from the application of a single mass-to-light ratio for the stars, i.e. M/LV = 1. As discussed earlier, this ratio could be up to twice that assumed but its effect on the halo mass is only significant for NGC 147, NGC 185, and NGC 205. In such cases the halo mass would be systematically overestimated.
For our late-type galaxies, the halo masses for most galaxies (see Section 2.2) come from integrated H i measurements over the entire galaxy rather than a resolved rotation curve. Their |$v$|max values can be affected by asymmetries, non-circular motions, H i bubbles, incorrect inclination measurements, and insufficient radial coverage so that the flat part of the rotation curve is not reached (e.g. Brook & Shankar 2016; Read et al. 2016b; Brooks et al. 2017; Oman et al. 2017). We also assume the contribution from random motions to be small. As the H i velocities are measured at much larger radii than stellar velocity dispersions, the contribution from the baryonic mass is small and so the halo masses are not subject to a significant stellar mass correction. Inclination errors cause the fitted inclination to be systematically biased low, leading to an artificially low M200 – a problem that is exacerbated by H i bubbles that form due to stellar feedback (Read et al. 2016b). Neglecting pressure support also underestimates the mass. The sign of all of the above effects is to cause us to systematically underestimate the halo masses for late-type galaxies.
2.4 Tidal stripping
Tidal stripping in the potential of a larger galaxy is a physical effect that will tend to lower the derived M200 (e.g. Read et al. 2006b). In a simulation of tides affecting Local Group dwarfs in a Milky Way-like potential, Peñarrubia, Navarro & McConnachie (2008) found that the central velocity dispersion decreased monotonically with the amount of stripped material. The simulated galaxies initially expanded but then became more compact as the stripping removed more mass. Overall tidally stripped dwarfs have a systematically lower velocity dispersion for their size (Sanders, Evans & Dehnen 2018). Thus after significant halo mass loss, the inferred dynamical mass is also reduced.
Tidal stripping tends to remove the least bound material first. This implies that after removing the extended dark matter halo, stripping will remove the GCs and finally the galaxy’s stars (e.g. Read et al. 2006a,b). Thus the relative depletion of the halo, GC system and stellar component will depend on the extent of the tidal stripping – in mild events, the mass in stars and GCs may be relatively unaffected (and see also Read & Erkal 2018 for a discussion of this).
3 NOTES ON INDIVIDUAL LOCAL GROUP DWARF GALAXIES WITH GC SYSTEMS
Next, we briefly discuss the GC systems for each Local Group dwarf galaxy listed in Tables 1 and 2.
3.1 Sagittarius
The Sagittarius (Sgr) dwarf galaxy and its GC system have been disrupted and merged with the Milky Way galaxy. Its original pre-merger properties are highly uncertain. Here we use studies that have attempted to reassemble the original Sgr galaxy and its GC system. Rather than use the basic stellar properties from McConnachie (2012) we take the total luminosity for Sgr from Niederste-Ostholt et al. (2010), who included the stellar streams. We take their upper limit to the total luminosity of |$L_V = 1.32 \times 10^8\, {\rm L}_{\odot }$| and assume M/LV = 1 (as for other Local Group galaxies) to obtain a total stellar mass of 13.2 |$\times 10^7\, {\rm M}_{\odot }$|. Gibbons, Belokurov & Evans (2017) have modelled Sgr plus its stream and derived a total halo mass of at least |$M_{200} = 6 \times 10^{10}\, {\rm M}_{\odot }$|. Here we use this halo mass rather than one based on scaling from the dynamical mass, since Sgr has definitely lost significant mass due to tidal stripping (e.g. Helmi & White 2001; Read & Erkal 2018). If the possible nucleus of the Sgr galaxy (M54) is included as a bona fide GC, then the current number of GCs likely associated with the original Sgr dwarf is eight according to Law & Majewski (2010). They are Terzan 7 (MV = −5.01), Terzan 8 (MV = −5.07), Arp 2 (MV = −5.29), Pal 12 (MV = −4.47), NGC 6715 (M54; MV = −9.98), Whiting 1 (MV = −2.46), NGC 5634 (MV = −7.69), and NGC 5053 (MV = −6.76). These eight give a total GC system mass of |$1.92 \times 10^6\, {\rm M}_{\odot }$|. We note that the recent proper motion study of Sohn et al. (2018) indicates that NGC 5053 is unlikely to belong to Sgr but the GC NGC 2419 (MV = −9.42) does belong. In this case the GC system mass is |$2.78 \times 10^6\, {\rm M}_{\odot }$|, which we adopt in Table 1. The resulting GC system mass to halo mass ratio for the ‘reassembled’ Sgr dwarf is 4.6 × 10⁻⁵, and hence quite consistent with the value found for higher mass galaxies.
3.2 Fornax
We combine the luminosities of Fornax’s five GCs (i.e. MV = −5.23, −7.30, −8.19, −7.23, and −7.38) and a mass-to-light ratio of M/LV = 1.88 to derive a total GC system mass of |$7.3\times 10^5\, {\rm M}_{\odot }$|. We note that Mackey & Gilmore (2003) estimate the total mass of the Fornax dSph GCs to be 9 × 10⁵ M|$\odot$|, while Larsen, Brodie & Strader (2012) derive dynamical masses of GCs Fornax 3, 4, and 5 to be |$9.8\times 10^5\, {\rm M}_{\odot }$|. These are comparable to our estimate here. Recently, Errani, Peñarrubia & Walker (2018) derive a halo mass of log M200 = 9.42 assuming a cored dark matter profile that is similar to our value in Table 1. However, we note that the pre-infall halo mass of Fornax was likely larger than estimated here (i.e. log M200 = 9.4–10; Amorisco, Zavala & de Boer 2014; Read & Erkal 2018), indicative of tidal stripping and/or shocking (as is the case for the Sgr dwarf). However, we note that this scenario is challenged by Fornax’s apparently benign orbit (e.g. Battaglia, Sollima & Nipoti 2015).
3.3 Eridanus II
Crnojević et al. (2016) measured the properties of a faint GC (MV = –3.5) near the centre of the very low luminosity (MV = –7.1) galaxy Eridanus II. This single GC has a corresponding mass of 4.0 × 10³ M|$\odot$|. The GC has a colour–magnitude diagram (CMD) that is similar to its host galaxy, i.e. dominated by an old (∼10 Gyr) and metal-poor ([Fe/H] ∼ –2.5) stellar population. Li et al. (2017) confirmed the low metallicity finding [Fe/H] = –2.38 and measured a velocity dispersion of 6.9 km s−1. Crnojević et al. (2016) also managed to measure the half-light radius of the galaxy (Re ∼ 280 pc) and place a tight upper limit on the H i gas content of 2.8 × 10³ M|$\odot$|. This suggests that either Eridanus II may interact with the Milky Way in the past or it is a true ‘fossil’ of reionization (e.g. Bovill & Ricotti 2011). Any dynamical interaction, however, must have occurred long ago given its current distance from the Milky Way of 366 ± 17 kpc (Crnojević et al. 2016). Thus, we consider it unlikely that Eridanus II is significantly tidally distorted today.
3.4 NGC 205
NGC 205 is thought to have around a dozen GCs (Barmby et al. 2000) with Forbes et al. (2000) suggesting a total GC system of 11 ± 6. Magnitudes are given for nine GCs in Da Costa & Mould (1988). Following da Costa & Mould, we exclude Hubble III (its radial velocity suggests an association with M31) and Hubble V (its age is less than 2 Gyr) but do include the GC M31C−55. Here we combine the masses of those seven GCs and assume that the other four have a similar mean mass. This process gives us a total mass for the GC system associated with NGC 205 to be 1.41 × 10⁶ M|$\odot$|. NGC 205 appears to be currently interacting with M31 (e.g. Howley et al. 2008) that may lead to a large systematic error in our estimate of M200 for this galaxy (e.g. Read et al. 2006b). The uncertainty on our derived M200 for NGC 205 is further compounded by its dense stellar mass. This leads to large uncertainties on the extrapolation of M200 from the measured mass interior to the half-light radius (see Section 2).
3.5 NGC 147 and NGC 185
Several new GCs have been discovered by the Pan-Andromeda Archaeological Survey (PAndAS) bringing the total number of GCs to 10 associated with NGC 147 and eight associated with NGC 185. The details of these GCs including their luminosities are given by Veljanoski et al. (2013). The two galaxies are likely tidally interacting with one another, with NGC 147 exhibiting pronounced isophotal twists (Crnojević et al. 2014). As with NGC 205, this tidal distortion, and the significant central concentration of stars in NGC 147 and NGC 185, leads to large uncertainties on our derived M200 for these dwarfs (see Section 2).
3.6 And I and And XXV
Caldwell et al. (2017) find a single GC with MV = −3.4 (or equivalently a mass of 3.68 × 10³ M|$\odot$|) associated with And I. And I itself is dominated by stars older than 8 Gyr (Weisz et al. 2014). For And XXV, Cusano et al. (2016) note a possible GC associated with MV = −4.9 (or a mass of 1.46 × 10⁴ M|$\odot$|). We note that And XXV has a particularly large size for its small velocity dispersion so it may be undergoing a tidal interaction with M31 (Collins et al. 2014) and, therefore, not be in dynamical equilibrium. Indeed based on the measured dynamical mass, we derive a halo mass of less than 108 M|$\odot$|, which is the limit for atomic cooling in the early Universe (e.g. Read, Pontzen & Viel 2006c). Thus our halo mass for And XXV should be considered highly uncertain and certainly a lower bound on its pre-infall halo mass.
3.7 The SMC and LMC
Following Georgiev et al. (2010), we include the single old GC (NGC 121) in the SMC, and the 16 old GCs in the LMC, to give the total mass of the GC system in each galaxy. We note that a number of Milky Way GCs have been suggested to once belong to the Magellanic Clouds (e.g. Rup 106 to the SMC; Fusi Pecci et al. 1995). As such, our estimates of the GC system mass in the clouds are likely to be lower bounds.
3.8 NGC 6822 (DDO 209)
Veljanoski et al. (2015) present new imaging and spectroscopy of the original GC Hubble VII and seven more recently discovered (compact and extended) GCs, finding them to be older than 9 Gyr. Using the luminosities given in their table 4, and M/LV = 1.88, we derive a total GC system mass of 1.26 × 10⁶ M|$\odot$|. Based on the motions of the GCs, Veljanoski et al. (2015) find the galaxy to be dark matter dominated.
3.9 WLM (DDO 221)
The Wolf–Lundmark–Melotte (WLM) galaxy has been known for some time to host a single GC with a luminosity of MV = –8.74 (Stephens, Catelan & Contreras 2006). This corresponds to a mass of 5.04 × 10⁵ M|$\odot$|. Virial masses in the literature for WLM include Read et al. (2017) log M200 = 9.92, Allaert, Gentile & Baes (2017) log M200 = 10.07 assuming a Di Cintio et al. (2014) DM profile and 10.39 for a coreNFW profile (Read et al. 2016a), and Oh et al. (2015) log M200 = 10.09. Our value of the halo mass is within the range of these values and their quoted uncertainties.
3.10 Pegasus (DDO 216)
Recently, Cole et al. (2017) reported a single luminous GC with MV = −7.14 or mass of |$1.15\times 10^5\, {\rm M}_{\odot }$| associated with the Pegasus galaxy. As noted in Read et al. (2017), Pegasus has a radially limited and highly irregular rotation curve, and so is unlikely to be dynamical equilibrium, at least in its central parts where the H i data are available. For this reason, Read et al. (2017) classify the galaxy as a ‘rogue’ and exclude it from further analysis. We include Pegasus in Table 2 but note that its M200 should be treated with caution; it is almost certainly a lower bound on its true M200.
3.11 Aquarius (DDO 210)
Greggio et al. (1993) note the existence of a possible GC associated with the Aquarius galaxy. Here we include it in Table 2, and its GC with a luminosity of MV = –4.9 or mass of 1.46 × 10⁴ M|$\odot$|. In calculating the halo mass for the late-type galaxies we have ignored any contribution from pressure support. Aquarius has perhaps the highest contribution from pressure support in our sample of late-type galaxies, with a stellar velocity dispersion of 7.9 km s−1. Nevertheless with |$v$|max/σ = 2.25, this indicates that it is still rotation dominated. Indeed, our halo mass of log M200 = 8.87, that ignores the contribution from pressure support, is consistent with both Read et al. (2017) (log M200 = 8.83) and Oh et al. (2015) (log M200 = 8.80) within their quoted uncertainties.
4 ISOLATED DWARF GALAXIES WITH GC SYSTEMS
Dwarf galaxies in the Local Group are influenced by, and in some cases radically transformed by, the Milky Way and Andromeda galaxies. In addition to tidal stripping (which may remove dark matter, GCs, and stars), other effects are present. Ram pressure stripping can remove a dwarfs’ interstellar medium (ISM), causing its star formation to cease (e.g. Gatto et al. 2013); dwarfs can also be morphologically transformed by the tidal field of their host galaxy (e.g. Mayer et al. 2001). Read et al. (2017) concluded that, for these reasons, it is much easier to test the expectations of ΛCDM at low masses in isolated dwarfs than using nearby satellites.
Georgiev et al. (2010) compiled a list of nearby dwarf galaxies located in low-density environments with known GC systems from Hubble Space Telescope (HST)/Advanced Camera for Surveys (ACS) imaging. They tend to be late-type, gas-rich dwarf galaxies. The HST images provided accurate distances (from the tip of the red giant branch) and were of sufficiently large field-of-view to cover the entire expected GC system. Of the 55 dwarf galaxies studied, 38 revealed the presence of old GCs; 17 contained no identifiable old GCs. In order to avoid galaxies with large inclination corrections to their rotation velocity, we further restrict the sample to those with i > 20° (e.g. Read et al. 2016b).
In the lower part of Table 2, we include the nearby isolated dwarf galaxies of Georgiev et al. (2010) that meet the above criteria. We note that although NGC 247 is located in the Sculptor group, this group is actually a loose filament of length ∼5 Mpc along the line-of-sight and so it is still located in a relatively low-density environment. The columns are similar to those of Table 1. The stellar masses for the isolated dwarfs are taken directly from Georgiev et al. (2010) who used colour-based M/LV ratios with a typical value of ∼0.75 to convert V-band luminosities into stellar masses (with uncertainty of around ±0.1 dex). We also list H i masses from Georgiev et al. (2010). We note that the H i gas mass is similar to, and sometimes exceeds, the stellar mass of the galaxy; in these cases the total baryonic mass is much greater than the stellar mass alone. As throughout this work, GC system masses in Table 2 are calculated from their individual luminosities assuming M/LV = 1.88. Table 2 also lists the maximum rotation velocity of the H i gas (|$v$|max). Halo masses for the isolated dwarfs are derived using the method outlined in Section 2.2 for rotationally supported galaxies. We find no strong difference in the halo masses of galaxies with resolved rotation curves compared to those with integrated H i line widths, but see Brook & Shankar (2016), Schneider et al. (2017), Brooks et al. (2017), and the discussion on this in Section 2.2.
5 THE STELLAR MASS–GC SYSTEM MASS RELATION
Before examining the GC system mass–halo mass relation, we present relations with stellar mass. The relationship between the number of GCs per galaxy luminosity or stellar mass (often referred to as SN and TN, respectively) is well known to have a U-shaped relation with galaxy luminosity (Forbes 2005; Peng et al. 2008; Georgiev et al. 2010), with dwarf galaxies having an increasing fraction of their stellar mass in GCs with decreasing luminosity. This implies that either dwarf galaxies with GCs are more efficient at forming and retaining those GCs and/or they are less efficient at forming field stars.
In Fig. 1, we show the GC system mass–stellar mass relation for our sample of dwarf galaxies from Tables 1 and 2 (with different symbols used). We estimate errors on the stellar masses to be ±0.1 dex for late-type dwarfs and up to ±0.3 dex for early-type dwarfs. For the GC system masses we assume the errors on their total luminosity to be small and the use of a single mass-to-light ratio to be reasonable (see Strader et al. 2009). However, when dealing with small number statistics (e.g. sometimes a single GC) Poisson-like uncertainties may dominate. To estimate the uncertainty associated with small number statistics, we assume that GC systems with a total log MGC = 4 has one GC, log MGC = 5 has one GC, log MGC = 6 has 10 GCs, log MGC = 7 has 50 GCs on average. So, for example, a galaxy with 10 observed GCs may have an uncertainty of |$\pm \sqrt{10}$|. Assuming a similar mean GC mass, this corresponds to error bars of ±0.30, 0.30, 0.12, and 0.06 dex in GC system mass.

Stellar mass–GC system mass relation. Brown symbols are dE and dSph galaxies from Table 1 and cyan symbols are late-type dwarfs from Table 2. Local Group galaxies are shown by squares and isolated galaxies by circles. The red squares represent ultradiffuse galaxies (UDGs). Error bars on the left-hand side show representative Poisson errors in GC system mass. Dashed lines represent GC system to galaxy stellar mass ratios of 10 and 0.01 per cent.
The data in Fig. 1 show a large range of GC system mass to galaxy stellar mass ratios of 0.01–10 per cent, with a typical ratio of a few tenths of a per cent. An example of the range in host galaxy stellar mass for a given GC system mass is nicely illustrated by comparing Eridanus II with And I. Both galaxies are dominated by old metal-poor stars, and have a similar mass in GCs of ∼4 × 10³ M|$\odot$| but are almost 70× different in stellar mass, resulting in GC-to-stellar mass ratios of ∼7 and 0.1 per cent. For both galaxies there is no detected H i gas, so their total baryonic mass (i.e. stellar plus gas mass) is identical to their stellar mass.
For comparison, the Milky Way’s GC system contains 2–3 per cent of the halo stellar mass, but only ∼0.1 per cent of the total stellar mass. If only metal-poor stars are considered, then the GCs in some dwarf galaxies, e.g. WLM (MV = −14.2) and IKN (MV = −11.5), contain up to 30 per cent of the metal-poor (old) stellar content of their host galaxy (Larsen et al. 2014b). Recently, Lamers et al. (2017) showed that, within an individual (giant) galaxy, the number of GCs is higher at lower metallicities. They argued that this was the outcome of a higher survival rate. Alternatively, dwarfs with high GC-to-stellar mass ratios may have formed most of their stars and GCs at early times, while others continued to form stars until recent times, resulting in low GC-to-stellar mass ratios. However, the large variation in the GC-to-stellar mass ratio for Eridanus II and And I (which are both dominated by old stars) suggests that star formation histories may not be the primary or sole driver of these variations. We also remind the reader that an increasing fraction of low-mass galaxies, in the mass regime shown in Fig. 1, do not possess any GCs. Further work is needed to fully understand the physical processes that give rise to the large variation in the GC system to galaxy stellar mass ratios in dwarf galaxies.
We also include in Fig. 1 the location of three ultradiffuse galaxies (UDGs) with measured GC systems and estimated halo masses. All three have stellar masses indicative of dwarf galaxies. The first is VCC 1287 in the Virgo cluster. It has 22 ± 8 GCs and total GC system mass of around 2.2 ± 0.8 × 10⁶ M|$\odot$| (Beasley et al. 2016). The galaxy stellar mass is |$2.8 \times 10^7\, {\rm M}_{\odot }$|. The second UDG is DF2 (van Dokkum et al. 2018a) has recently been the subject of debate over its distance. Here we adopt the larger distance of ∼19 Mpc (van Dokkum et al. 2018b) rather than the smaller distance of 13 Mpc advocated by Trujillo et al. (2018). Its GC system is a little odd in that it includes 11 objects with MV < −8.6, i.e. more luminous than most GCs and approaching the luminosity regime of ultracompact dwarfs (UCDs). If we accept the 11 luminous compact objects, which have measured radial velocities, as bona fide GCs, then their total mass is |${\sim } 8 \times 10^6 \, {\rm M}_{\odot }$| (including lower mass GCs, the total system would rise to around 15 GCs). The galaxy stellar mass is |$2 \times 10^8\, {\rm M}_{\odot }$|. The third UDG is DF44 in the Coma cluster (van Dokkum et al. 2016). It has a stellar mass of |$3 \times 10^8\, {\rm M}_{\odot }$| and 74 ± 18 GCs (van Dokkum et al. 2017), which corresponds to a GC system mass of approximately |$7.4 \times 10^6\, {\rm M}_{\odot }$|.
These three UDGs all have very high GC system mass to galaxy stellar mass ratios approaching 10 per cent. So although they have stellar masses similar to the dwarf galaxies considered in this work, whatever processes have shaped these three UDGs, it has resulted in them having a large fraction of their baryonic mass in the form of GCs. This may be a result of stellar and dark matter ‘heating’ combined with early star formation quenching (Di Cintio et al. 2017; Chan et al. 2018; Read & Erkal 2018). We note that many other UDGs have little or no GCs (Amorisco et al. 2018).
6 THE STELLAR MASS–HALO MASS RELATION (SMHR)
There have been a number of recent studies of the stellar mass to halo mass relation (SMHR) at low mass in the literature. These fall into three main categories: (1) using abundance matching to determine the SMHR (e.g. Behroozi et al. 2010; Moster et al. 2010; Brook et al. 2014; Garrison-Kimmel et al. 2017); (2) measuring the SMHR for a sample of galaxies for which M200 can be estimated (e.g. Hudson et al. 2015; Katz et al. 2017; Read et al. 2017); (3) modelling the SMHR using numerical simulations (e.g. Chan et al. 2015; Sawala et al. 2015; Munshi et al. 2017); and (4) semi-analytical modelling (Rodríguez-Puebla et al. 2017).
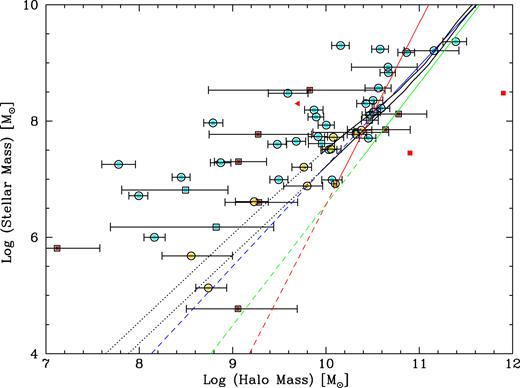
In Fig. 2, we show a selection of these studies, with relations extrapolated to lower masses. Over the stellar mass range 107 < M*/M|$\odot$| < 108, Read et al. (2017) find an excellent agreement between M200 derived from abundance matching of Behroozi et al. (2010) and M200 derived from the H i rotation curves of a sample of nearby isolated dwarfs with excellent quality data (compare the gold data points in Fig. 2 with the dotted lines). This is consistent with the extrapolation to low mass of the similar relation (blue line) derived from weak lensing measurements by Hudson et al. (2015). This good agreement continues down to M* ∼ 105 M|$\odot$|, however at these low stellar masses, the abundance matching relation becomes an extrapolation, while there are only a handful of galaxies with H i data that populate the plot. Thus, the relationship between stellar mass and halo mass below M* ∼ 107 M|$\odot$| remains uncertain.

A compilation of stellar mass–halo mass relations taken from the literature. The filled circles show simulated dwarf galaxies (purple – Munshi et al. 2017; red – Fitts et al. 2017; green – Shen et al. 2014; and blue – Wheeler et al. 2015) and observed dwarf galaxies (gold – Read et al. 2017). Solid lines show predicted relations (green – Rodríguez-Puebla et al. 2017; red – Brook et al. 2014; and blue – Hudson et al. 2015), with extrapolations marked as dashed lines. The dotted lines show the upper and lower bounds of the extrapolated Behroozi et al. (2010) relation.
Apparently at odds with the recent Read et al. (2017) study, however, are two other abundance matching relations in the literature. Brook et al. (2014) find a much steeper relation (red line), as do Rodríguez-Puebla et al. (2017) (green line). The former study uses Milky Way satellites to reach a much lower stellar mass than is possible using the Sloan Digital Sky Survey (SDSS) stellar mass function. However, this means that Brook et al. (2014) abundance matching primarily uses group satellite galaxies. Using a stellar mass function measured from nearby groups (Read & Trentham 2005), Read et al. (2017) show that using groups does indeed lead to a much steeper SMHR than using SDSS field galaxies, explaining the difference in the SMHR of Brook et al. (2014) and that of Behroozi et al. (2010) that is much shallower. The Rodríguez-Puebla et al. (2017) SMHR is complete down to M* ∼ 108 M|$\odot$| and so is an extrapolation over much of the stellar mass and halo mass range probed by our study here.
Finally, we compare the SMHR relations in Fig. 2 with the latest numerical simulation results. The FIRE dwarf galaxy simulations (Fitts et al. 2017) cover the range 105–107 M|$\odot$| in stellar mass, while the simulations of Shen et al. (2014) and Wheeler et al. (2015) provide a small number of additional dwarf galaxy models that probe to higher and lower stellar masses, respectively, than the Fitts et al. (2017) simulations. While these simulations are consistent with one another, the Munshi et al. (2017) simulations,2 which probe a similar range in stellar mass, produce significantly more stellar mass for a given halo mass in much better agreement with the isolated dwarf sample of Read et al. (2017) and the abundance matching of Behroozi et al. (2010).
As pointed out recently by Contenta et al. (2018), most of these simulations scatter below the observed SMHR for isolated gas-rich dwarfs (Read et al. 2017), and the SMHR from abundance matching with field galaxies (Behroozi et al. 2010). Understanding the origin of this discrepancy remains a key outstanding challenge for galaxy formation models.
7 GLOBULAR CLUSTER SYSTEM MASS–HALO MASS RELATION
To recap, in Table 1 we list the Local Group dE and dSph galaxies with known GC systems. The census of GCs in the Local Group is largely complete. However, the galaxies are satellites and may be subject to tidal effects. The halo mass of the host galaxy is calculated from the measured dynamical mass within the half-light radius (see Section 2.1). Table 2 lists the Local Group dIrr galaxies and isolated late-type galaxies from Georgiev et al. (2010) with both GCs and H i rotation kinematics. The isolated galaxies, which dominate our sample, are largely free of tidal effects but they are not statistically complete in terms of their GC census. Halo masses are calculated from their observed inclination-corrected maximum rotation velocity (see Section 2.2). For all galaxies, we calculate the total mass of their GC system from the individual reported GCs.
The key result from this paper is shown in Fig. 3. Here we show the GC system mass–halo mass relation for the dwarf galaxies listed in Tables 1 and 2, along with the median value of GC system mass in three halo mass bins of width 1 dex. We show the linear relations of Spitler & Forbes (2009) and Harris et al. (2017) extrapolated to lower masses. These relations (which use different mean GC masses in their derivation) are based on photometry of and on the assumption of selecting predominately old GCs. We also show the recent prediction from the semi-analytical model of El-Badry et al. (2018). We include the estimated uncertainty in halo mass for each galaxy and show representative errors for the GC system mass assuming a Poisson-like uncertainty in GC counting statistics (as described in Section 5).
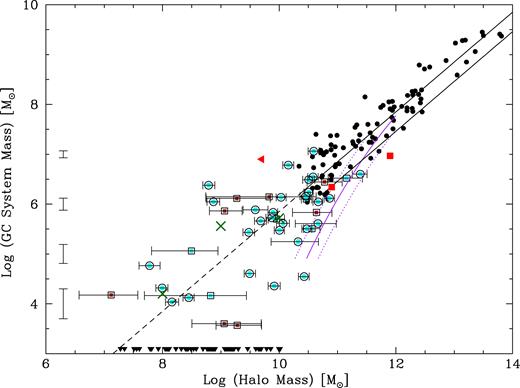
GC system mass–halo mass. Brown symbols are dE and dSph galaxies from Table 1, and cyan symbols are late-type dwarfs from Table 2 (with 1σ error bars). Local Group galaxies are shown by squares and isolated galaxies by circles. The green crosses represent the median value in three halo mass bins centred at 8, 9, and 10 in log halo mass. Small black symbols are galaxies from Spitler & Forbes (2009). Error bars on the left-hand side show representative Poisson errors in GC system mass. The red squares indicate the UDG galaxies DF 44 and VCC 1287 and the red triangle the UDG DF 2 with an upper limit to its halo mass (see text for details). Solid triangles on the lower edge of the plot represent Local Group galaxies without known GC systems (see text for details). The dashed and dotted lines are the relations of Spitler & Forbes (2009) and Harris et al. (2017) extrapolated to lower masses. The purple lines show the approximate predicted relation, and scatter, of the semi-analytic model of El-Badry et al. (2018) at low masses.
The GC systems of very low mass galaxies are consistent with a linear extrapolation of the Spitler & Forbes relation from higher mass, albeit with significant scatter. This scatter is larger than our estimated 1σ error bars. Thus, it could be driven by real cosmic variation in the GC-to-halo mass ratio. However, we caution that the systematic errors on M200 are substantial and likely bias our halo estimates low (see Section 2). We see no clear difference between Local Group and isolated galaxies.
Our low-mass galaxies do not follow the prediction of the fiducial model of El-Badry et al. (2018). They used a semi-analytical model based on dark matter merger trees to predict the GC system mass–halo mass relation. Their fiducial model matches the observed one at high masses but starts to deviate for log M200 ≤ 12.0 and is significantly different to our trend at their lowest halo mass of log M200 ∼ 10.5. They suggest that the linear relation seen at high mass is the simple result of a self-similar merger history of haloes with old GCs. By contrast, lower mass galaxies have fewer mergers and the predicted relation curves downwards with less mass in GCs for a given halo mass. They assumed a minimum GC mass of 105 M|$\odot$| and did not include any mass-dependent disruption or tidal stripping of GCs in their model. A smaller minimum mass and/or the inclusion of disruption would tend to further lower the predicted mass of their GC systems. They also suggest that haloes with log M200 < 11 will not contain metal-rich GCs.
Interestingly, El-Badry et al. (2018) also present a ‘random’ model (their fig. 3) in which there is no initial correlation of GC system and halo mass at early times, but in which they do allow growth via mergers. A large number of mergers act to preserve the linear relation down to very low masses. This can be thought of as a consequence of the central limit theorem, which also produces a tight relation at high masses and increasing scatter towards low mass as we observe in Fig. 3. The random model also predicts that the majority of GCs are metal-poor, again as observed in low-mass galaxies (Georgiev et al. 2010).
So, although the fiducial model of El-Badry et al. (2018) does not correctly reproduce the properties of the GC systems in our low-mass galaxies, their random model does a much better job. This suggests that GC formation in at least some low-mass haloes in the early Universe must be more efficient than assumed in their fiducial model. Indeed, Boley et al. (2009) argue for just such an efficient GC formation at early times in low-mass haloes in order to reproduce the observed concentrated distribution of old GCs around massive galaxies like the Milky Way today (and see also Moore et al. 2006; Kruijssen et al. 2018). Such an increased efficiency in early star formation may also be required to bring the simulations of low-mass dwarfs into agreement with the data for nearby gas-rich isolated dwarfs (see Fig. 2; Read et al. 2017; Contenta et al. 2018).
Our results suggest that at least some haloes with |$M_{200}\lt 10^{10}\, {\rm M}_{\odot }$| form GCs. However, below |$M_{200}\simeq 10^{10}\, {\rm M}_{\odot }$|, many galaxies – perhaps even the majority – appear to be devoid of GCs (see Fig. 3, black triangles). Thus, when averaging over all galaxies, the mean GC system mass per unit of halo mass appears to fall more steeply than the GC system mass–halo mass relation of dwarfs selected to contain GCs. Such stochasticity in the GC occupancy of dwarfs may allow for a better agreement between our data and the fiducial El-Badry et al. (2018) model (if the fiducial El-Badry et al. model were adapted to allow for stochastic GC occupation). We discuss this issue in more detail in Section 8.
We also include in Fig. 3 the location of the three UDGs presented in Section 5. VCC 1287 has a galaxy total mass, based on the motions of its GCs, of |$M_{200} = 8 \pm 4 \times 10^{10}\, {\rm M}_{\odot }$| (Beasley et al. 2016). This implies a GC system to total mass ratio of 5.5 × 10⁻⁵, which is consistent with the other galaxies in this plot. Based on its stellar velocity dispersion, DF 44 has an estimated halo mass of |$8 \times 10^{11}\, {\rm M}_{\odot }$| (van Dokkum et al. 2016) and is an outlier in the plot. van Dokkum et al. (2018a) infer a 90 per cent confidence upper limit on the halo mass of DF 2, from both the stellar velocity dispersion and the motions of its GCs, of |$\lt 1.5\times 10^8\, {\rm M}_{\odot }$|. We note that both Martin et al. (2018) and Laporte, Agnello & Navarro (2018) have questioned the dynamical mass calculation of van Dokkum et al. (2018a), with Laporte et al. (2018) suggesting its halo mass could be up to |$5 \times 10^9\, {\rm M}_{\odot }$|. In Fig. 3, we show the upper limit to the halo mass from Laporte et al. Although the three UDGs discussed here have stellar masses similar to those of the low-mass galaxies studied in this work, their GC system masses, and halo masses are more indicative of massive galaxies. The diversity in their GC system and halo mass properties clearly warrants further study.
Finally, we plot in Fig. 4 the SMHR for our dwarf galaxies with GC systems. We remind the reader that there is an uncertainty in the stellar mass of ±0.3 dex for the dE/dSph galaxies and ±0.1 dex for the late-type dwarfs. Our galaxies with GC systems have systematically lower halo masses than even the shallowest SMHR relation shown, with a slope of around unity, noting that systematic effects tend to bias our halo masses towards lower limits. Our data show a similar trend to the ‘clean sample’ of relatively isolated dwarfs studied by Read et al. (2017). As our galaxies (with GC systems) and the galaxies shown from Read et al. (without GCs) are dominated by isolated galaxies, it is unlikely that tidal stripping is the main cause of the reduced halo masses.
A compilation of stellar mass–halo mass relations taken from the literature. The filled circles show observed dwarf galaxies with GC systems; brown – Table 1 dE and dSph galaxies; cyan – Table 2 dIrr galaxies). Local Group galaxies are shown by squares, while isolated galaxies are shown by circles. Gold filled circles show isolated galaxies without GCs from Read et al. (2017). Solid lines show predicted relations (green – Rodríguez-Puebla et al. 2017; red – Brook et al. 2014; blue – Hudson et al. 2015), with extrapolations marked as dashed lines. The dotted lines show the upper and lower bounds of the Behroozi et al. (2010) relation. The red squares indicate the UDGs DF 44 and VCC 1287, and the red triangle UDG DF 2.
8 GALAXIES WITHOUT GLOBULAR CLUSTERS
In this paper we have mainly considered galaxies with GC systems, however galaxies without GC systems appear to become increasingly common at the lowest masses (see Fig. 3, black triangles). The lack of a GC system in some dwarf galaxies could be due to their removal by tidal stripping (i.e. an environmental effect), their destruction over cosmic time (which may include sinking to the galaxy centre via dynamical friction), or that they never formed in the first place. We note that since Georgiev et al. (2010) found several isolated galaxies lacking GC systems, the absence of GCs cannot be purely due to tidal stripping.
In Fig. 3, we qualitatively represent the Local Group galaxies (taken from McConnachie 2012) that lack reported GCs, showing their halo mass distribution. The Local Group sample should be close to a complete census of GCs, however as it is not a low-density environment their GC systems may have been previously depleted due to tidal stripping. Taking a simple approach of using the stellar mass directly from McConnachie (2012) and their halo mass assuming an extrapolation of the SMHR relation in fig. 2 of Hudson et al. (2015), Fig. 3 shows that an increasing fraction of low-mass Local Group dwarf galaxies (with halo masses log M200 < 10) lack GC systems. Any study interested in the mean mass of GC systems as a function of halo mass needs to take account of galaxies with zero GC system mass. Indeed, using this qualitative approach we estimate that the fraction of mass contained in GC systems is at least 10 times lower in these lower mass haloes.
In this work, we have investigated the populated GC system mass–halo mass relation, i.e. only galaxies with reported GC systems. The fiducial and random models presented by El-Badry et al. (2018) are also populated relations (i.e. only for galaxies with GCs) and not mean relations for all galaxies with, and without, GC systems. Their semi-analytic model does not include stochastic effects, such as halo-to-halo variation of the baryon fraction, ISM properties, and environmental effects that become increasingly important in the low-mass regime. Based on the qualitative halo mass distribution shown in Fig. 3, we would expect the mean GC system mass to become non-linear and decrease with decreasing halo mass in the low-mass regime. In other words, low-mass galaxies will have a smaller mean GC system mass to halo mass ratio than universally found for high-mass galaxies.
The question of the lowest mass galaxy that can host a single GC was raised in the Introduction. El-Badry et al. (2018) noted that most haloes with log M200 < 10.5 (or log M* ≤ 5) in their simulation did not form a GC. Our data show that many local dwarfs with M200 < 10.5 do form GCs, and they do so with a scatter about the same linear relation as those of higher mass galaxies. Only for halo masses log M200 < 10 do Local Group galaxies without GCs become a common feature. El-Badry et al. (2018) note that their relation would continue to be linear to lower masses if GC formation was more efficient in low-mass haloes at early times than in their fiducial model.
Boylan-Kolchin (2017) introduced a model to explain the GC system mass versus halo mass relation. His model assumes that all haloes with total mass above 109 M|$\odot$| at high redshift (i.e. |$z$| ∼ 6) can form a GC system whose total mass is directly proportional to the halo mass. As the total GC system mass at redshift zero is directly related to the sum of the progenitor halo masses during galaxy assembly, a linear relation between GC system mass and host galaxy halo mass is produced. This model predicts that the minimum galaxy halo mass (at |$z$| = 0) to host a single GC will be ∼1010 M|$\odot$|, if metal-poor GC formation ends at |$z$| = 6. In particular, the probability of hosting at least 1 GC is 10 per cent for a halo mass of 1010 M|$\odot$| but <1 per cent for a halo of mass 7 × 10⁹ M|$\odot$|. Here we find several Local Group galaxies with a halo mass less than 7 × 10⁹ M|$\odot$| that host a GC system. If metal-poor GC formation ended at a lower redshift (which is more compatible with the ages of GCs), then the minimum halo mass would be a few times larger and in better agreement with the number of Local Group dwarfs with GCs. Georgiev et al. (2010) suggested that the lower stellar mass limit for the host galaxy would be around 3.5 × 10⁵ M|$\odot$|. Since then, Eridanus II with a stellar mass of 5.9 × 10⁴ M|$\odot$| has been found to host a single (albeit low mass) GC.
Future observational studies interested in the mean GC system–halo mass relation need to consider galaxies without GCs. Ideally, one requires a volume-complete census of isolated galaxies (to reduce the effects of tidal stripping on the their haloes and GC systems) that is deep (to include faint GCs) and that searches a wide area around each galaxy (to include GCs at large galactocentric radii). Such a detailed observational study does not yet exist. A study of the mean relation should also calculate the halo mass based on their observed kinematics. In addition to GC-free galaxies, such studies may also need to consider star-free galaxies (i.e. dark haloes) that could dominate the population of galaxies with halo masses below M200 ∼ 109 M|$\odot$| (Fitts et al. 2017).
9 CONCLUSIONS
In this work, we have collected a sample of early- and late-type Local Group dwarf galaxies and supplemented this with a larger sample of nearby late-type dwarf galaxies in low-density environments. All of the galaxies in our sample are known to host at least one bona fide old GC. We estimate the total mass of each GC system based on the combined luminosity of its individual GCs and a fixed mass-to-light ratio. We estimate host galaxy halo mass from measured stellar kinematics in the case of the early-type dwarfs and from H i gas kinematics in the case of the late-type dwarfs. For galaxies where literature estimates of the halo mass are available, we find reasonable agreement with our halo masses, within our respective uncertainties.
We find that for the lowest mass galaxies, there is a wide range in the mass of GC systems relative to their host galaxy stellar mass, i.e. from about 0.01 to over 10 per cent of the total stellar mass is contained in GCs. Some UDGs also have relative fractions close to 10 per cent.
In this work, we have used halo masses estimated from observed kinematics to show that the mass of a GC system relative to its host galaxy halo mass is consistent, albeit with large scatter, with a simple extrapolation of the linear GC system mass–halo mass relation from higher masses. Thus, the near-linear relation that ranges from halo masses of 1014 to 1010 M|$\odot$| extends down to halo masses of ≤109 M|$\odot$| without a substantial change in slope. The scatter has however increased considerably to around ±1 dex, and appears to exceed that of our estimated 1σ error bars (however we caution that this could be due to systematic uncertainties in our M200 estimates). In particular, UDGs appear to have a wide range in their GC system mass to halo mass properties.
Our observations are similar to the ‘random’ merger model of El-Badry et al. (2018) but not their fiducial semi-analytic model that includes their preferred GC formation physics. The ratio of GC system mass to halo mass is relatively constant at ∼0.005 per cent for the halo mass range 108 < M200/M|$\odot$| < 1014. (However, we note that if galaxies without GCs are included, there is a decrease of the mean GC system mass per unit halo mass below |$M_{200}\simeq 10^{10}\, {\rm M}_{\odot }$|.) The extension of this relation to the lowest masses confirms the close scaling between GCs and galaxy dark matter haloes. This may be the simple consequence of many halo mergers since their formation at early times. We find that galaxy haloes with mass M200 ≤109 M|$\odot$| do appear to be able to host a globular cluster.
Finally, we identify several nearby dwarf galaxies with no reported GCs for which a careful search is likely to be fruitful.
SUPPORTING INFORMATION
Table 1. Pressure-supported Local Group dwarfs with globular clusters and velocity dispersion measurements.
Table 2. Rotationally supported dwarf galaxies with globular clusters and H i rotation measurements.
Please note: Oxford University Press is not responsible for the content or functionality of any supporting materials supplied by the authors. Any queries (other than missing material) should be directed to the corresponding author for the article.
ACKNOWLEDGEMENTS
We thank A. Alabi, S. Larsen, A. Romanowsky, and M. Hudson for useful discussions. We also thank the referee for several useful suggestions. DAF thanks the Santander Fellowship and the ARC via DP160101608 for their financial support. JIR would like to acknowledge support from SNF grant PP00P2_128540/1, STFC consolidated grant ST/M000990/1, and the MERAC foundation. MG acknowledges financial support from the Royal Society (University Research Fellowship) and the European Research Council (ERC StG-335936, CLUSTERS).
Footnotes
Note that when calculating M200 from |$v$|max, we do not need to worry about the possible presence of a central dark matter core since we assume that the core size is smaller than the radius at which the rotation curve becomes flat (Read et al. 2017). Nor do we need to worry about any correction due to the stellar mass or gas mass because these become negligible at radii where the rotation curve is flat.
REFERENCES
APPENDIX A: GALAXIES WITH GLOBULAR CLUSTER SYSTEMS BUT LACKING KINEMATIC INFORMATION
Below we list a handful of interesting nearby dwarf galaxies that possess at least one GC but lack a stellar velocity dispersion or an H i rotation measure in order to estimate their total halo mass. The basic properties of the host galaxy along with the total mass in the GC system are listed in Table 4.
A1 Phoenix
Martínez-Delgado, Gallart & Aparicio (1999) identified four possible low-luminosity GCs in the Local Group Phoenix galaxy. They have luminosities of MV = –4.39, –4.14, –4.02, –4.24, and a total GC system mass of 3.1 × 10⁴ M|$\odot$|. We note that the H i listed by McConnachie (2012) for Phoenix is in the form of spatially offset H i clouds and so their association with the galaxy is uncertain.
A2 KKs 3 (PGC 009140)
This isolated dwarf has one GC (MV = −8.33, |$M_{\ast } = 3.45 \times 10^5\, {\rm M}_{\odot }$|) discovered in HST/ACS imaging by Karachentsev, Kniazev & Sharina (2015). The galaxy is located 2 Mpc just outside of the Local Group, with MB = –10.8 (M* ∼ |$4.5\times 10^6\, {\rm M}_{\odot }$|). Its sole GC represents almost 8 per cent of the galaxy stellar mass. It has some H i gas but no H i rotation curve reported.
A3 IKN
The IKN dSph is similar to the Fornax dwarf with five GCs (their total mass is 8.0 × 10⁵ M|$\odot$|). At a distance of 3.8 Mpc, the galaxy has a luminosity of MV = −11.5, giving it a higher GC specific frequency than Fornax or equivalently the GCs represent about 10 per cent of the galaxy stellar mass. Larsen et al. (2014a) present spectra of the GCs. The galaxy does not appear to possess any H i gas (Georgiev et al. 2010). There also appears to be no central velocity dispersion or half-light radius in the literature. This is probably due to the presence of a nearby, very bright star.
APPENDIX B: GALAXIES LACKING A GLOBULAR CLUSTER SYSTEM
Below we list some interesting nearby dwarf galaxies that lack a reported GC system. Some of the galaxies listed below either have a significant halo mass that suggests some GCs could have been formed. Others contain H i gas – the presence of which suggests that the host galaxy has not undergone ram pressure stripping or a tidal interaction. The lack of tidal interaction suggests any GCs formed have not been subsequently removed. Placing good limits on the absence of a GC system in a galaxy with a substantial halo mass and the presence of H i gas would provide key information on the stochastic nature of GC formation in low-mass galaxies.
B1 Carina
The Carina dSph has no known GCs. It lies 107 kpc from the Milky Way, with MV = −9.2 (|$4\times 10^5\, {\rm M}_{\odot }$|). No H i has been detected according to McConnachie (2012). The halo mass of Carina has been modelled by Ural et al. (2015) to be log M200 = 8.56 and, based on its observed H i rotation curve, to be 8.55 by Read et al. (2017). Based on this halo mass we expect ≤1 GC.
B2 LeoT
The LeoT galaxy lies just beyond the virial radius of the Milky Way at 410 kpc. It has a luminosity of MV = −8 and H i gas mass of 2.8 × 10⁵ M|$\odot$| (Ryan-Weber et al. 2008). It has Re = 178 pc and σ = 7.5 km s−1 and a halo mass quoted by Read et al. (2017) of log M200 = 8.54–8.88. For this halo mass we expect ≤1 GC, thus the apparent lack of a GC is not surprising.
B3 IC 10 and IC 1613
IC 10 (MV = −15.0) and IC 1613 (MV = −15.2) appear to be the highest luminosity Local Group galaxies (excluding special case of M32) without a single GC. We note that a number (66) of star clusters have been catalogued in IC 10 by Lim & Lee (2015) but it is not clear if they are old GC like. Both galaxies reveal the presence of H i gas (McConnachie 2012) and have halo masses estimated from H i rotation curves of log M200 = 10.2 for IC 10 and 8.8 for IC 1613 (Oh et al. 2015). Read et al. (2017) find a wide range of halo mass, i.e. log M200 = 8.85–10.07. Based on these halo mass estimates we would expect IC 10 and IC 1613 to host several GCs.
B4 Sextens A and Sextens B
Sextens A has a number of star clusters in its main body but it seems that none of them are GCs (Bellazzini et al. 2014). However, one star cluster outside the main body appears to be a bona fide GC (Beasley, private communication). Moiseev (2014) reports the discovery of a young (∼2 Gyr) compact star cluster in Sextens B using Wide Field and Planetary Camera 2 (WFPC2) imaging. The star cluster is quite luminous with MV = −7.77. Given its young age, we do not classify it as a GC. Only Sextens B has a listed velocity dispersion, i.e. σ = 8.0 km s−1 and half-light radius of 440 pc. Both galaxies reveal H i gas (McConnachie 2012), so further study of the existing star clusters is warranted. Both galaxies lie just beyond the ‘zero velocity surface’ of the Local Group.
B5 LGS3, Leo A, SAG dIrr, UGC 4879, and Antlia
These Local Group dwarfs are located at large distances from the Milky Way and M31 and are listed by McConnachie (2012) as containing H i gas. This suggests that they have not undergone a strong tidal interaction with either of the giant galaxies and so any GCs that they formed should remain. We note that LGS3 and SAG dIrr are part of the Little Things survey but were not included in the high-resolution H i observations of Oh et al. (2015).
B6 Crater 2
In 2014, the discovery of the distant (145 kpc) GC Crater was announced by Belokurov et al. (2014) and Laevens et al. (2014). Follow-up HST/ACS imaging by Weisz et al. (2016) derived an age of 7.5 Gyr, [M/H] = −1.65 and MV = −5.3 (and hence a stellar mass of |$2.1 \times 10^4\, {\rm M}_{\odot }$|, assuming M/LV = 1.88). Two years after the discovery of the Crater GC, it was suggested that it is associated with the newly discovered Crater 2 galaxy by Torrealba et al. (2016). They argued that the galaxy Crater 2, and the GC Crater, share the same great circle (and hence a physical association) that includes the Leo dwarf galaxies. The Crater 2 galaxy has a luminosity of MV = −8.2 ± 0.1 (or stellar mass of ∼1.6 × 10⁵ M|$\odot$|, assuming M/LV = 1). It has a half-light radius of 1066 pc and σ = 2.7 km s−1. Currently, the association of the Crater GC with the Crater 2 galaxy is highly uncertain and the galaxy appears to have undergone severe (∼90) per cent mass loss due to tidal disruption (Sanders et al. 2018). We have decided not to include Crater 2 in the main part of this paper.
B7 And XVII
Irwin et al. (2008) suggested that And XVII may have associated GCs. Based on their velocities, Veljanoski et al. (2014) argued against this and associated the GCs with M31. We do not include And XVII in Table 1.
APPENDIX C: GC SYSTEM NUMBER–HALO MASS RELATION
In Fig. C1, we show the number of GCs in a galaxy versus the galaxy halo mass. For the high-mass galaxies from Spitler & Forbes (2009) we simply divide the reported GC system mass by the mean mass of a GC assumed in that work, i.e. 4 × 10⁵ M|$\odot$|. For the low-mass galaxies we use the number of GCs quoted in Tables 1 and 2.
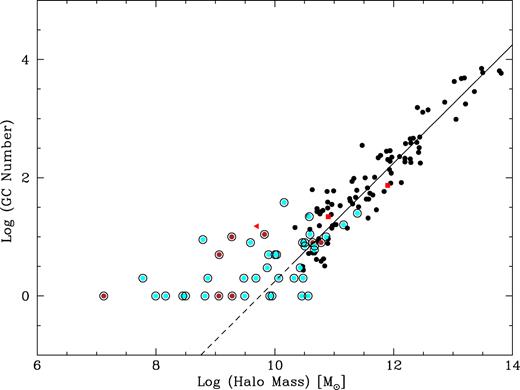
Globular cluster system number–halo mass relation. Same symbols used as in Fig. 3. Although many low-mass galaxies follow the relation from higher masses, many others have GCs of lower than average mean mass and hence deviate from the extrapolated relation.
The plot shows a tight relation when the GC system exceeds 10 GCs, however below that number the relation shows a strong deviation from the linear relation. This deviation is, at least in part, due to the breakdown of the assumption of a common mean GC mass. Low-mass galaxies have, on average, lower mass GCs. Hence the importance in this work to co-add individual GC masses to calculate a total GC system mass and thus test whether that quantity continues to have a linear relationship with halo mass.
Fig. C1 also shows that some galaxies with very small GC systems, even some with a single GC, still follow the GC number versus halo mass relation. This illustrates that even a single GC in a low-mass galaxy can, in some cases, have a ‘typical’ GC mass. Whether this is a survival or a formation feature is unknown. The UDGs DF 44 and VCC 1287 lie within the scatter of the main relation.
