


Abstract
We report on a detailed study of the spectral and temporal properties of the neutron star low-mass X-ray binary SLX 1737–282, which is located only ∼1° away from Sgr A*. The system is expected to have a short orbital period, even within the ultracompact regime, given its persistent nature at low X-ray luminosities and the long duration thermonuclear burst that it has displayed. We have analysed a Suzaku (18 ks) observation and an XMM–Newton (39 ks) observation taken 7 yr apart. We infer (0.5–10 keV) X-ray luminosities in the range of 3–6 × 1035ergs−1, in agreement with previous findings. The spectra are well described by a relatively cool (kTbb = 0.5 keV) blackbody component plus a Comptonized emission component with Γ ∼ 1.5–1.7. These values are consistent with the source being in a faint hard state, as confirmed by the ∼20 per cent fractional root-mean-square amplitude of the fast variability (0.1–7 Hz) inferred from the XMM–Newton data. The electron temperature of the corona is ≳7 keV for the Suzaku observation, but it is measured to be as low as ∼2 keV in the XMM–Newton data at higher flux. The latter is significantly lower than expected for systems in the hard state. We searched for X-ray pulsations and imposed an upper limit to their semi-amplitude of 2 per cent (0.001–7 Hz). Finally, we investigated the origin of the low-frequency variability emission present in the XMM–Newton data and ruled out an absorption dip origin. This constraint the orbital inclination of the system to ≲65° unless the orbital period is longer than 11 h (i.e. the length of the XMM–Newton observation).
1 INTRODUCTION
Low-mass X-ray binaries (LMXBs) are formed by a neutron star (NS) or a black hole (BH) accreting material from a low-mass star via Roche lobe overflow. Transient systems spend long periods of time (years to decades) in a dim (LX < 1033erg s−1) quiescent state, during which none or very little accretion takes place. However, these dormant states are sporadically interrupted by short (weeks to months) accretion outburst events during which the X-ray luminosity increases by several orders of magnitude. Persistent sources, on the other hand, always show high X-ray luminosities and never go to quiescence (see e.g. van der Klis 2006; Belloni, Motta & Muñoz-Darias 2011; Corral-Santana et al. 2016; Tetarenko et al. 2016).
To understand the accretion flow properties at different accretion regimes has been a continuous challenge in the study of LMXBs. In particular, the luminosity regime below 1 per cent of the Eddington luminosity (LEdd) has not been intensively explored until a few years ago, due to the sensitivity limitation of the past X-ray missions. In addition, transient LMXBs typically spend very brief periods of times within the range of LX ∼ 1034–1036erg s−1, which reduces the window of opportunity for obtaining high-quality data. On the other hand, systems persistently accreting at such low luminosities are very rare, but they provide a unique opportunity to investigate these accretion regimes (In’t Zand et al. 2002; Del Santo et al. 2007; Degenaar & Wijnands 2010; Armas Padilla, Degenaar & Wijnands 2013). Just their mere persistent behaviour at such low accretion rates challenges the standard and well-tested transient/persistent paradigm explained by the disc instability model (Lasota 2001; Coriat, Fender & Dubus 2012); a possible solution requiring they having very short orbital periods, even within the ultracompact regime (Nelemans & Jonker 2010).
SLX 1737–282 is a NS low-mass X-ray binary located in the Galactic Centre region (α = 17h40m42|${^{\rm s}_{.}}$|83 δ = –28°18΄08|${^{\prime\prime}_{.}}$|4; Tomsick et al. 2007) that was discovered with the Spacelab-2 observatory in 1985 (Skinner et al. 1987). The source has been subsequently detected by several monitoring programs with a flux of a few times 10−11 erg cm−2 s−1 depending on the epoch and the X-ray band. To date, four intermediate-long type I X-ray burst have been reported from this source. The first one, which revealed the NS nature of the accretor, lasted ∼15 min (In’t Zand et al. 2002), whilst the remaining three were 20–30 min long and suggest a burst recurrence time of ∼86 d (Falanga et al. 2008). At least one of these events shows photospheric radius expansion, from which, using the Eddington luminosity for a pure helium atmosphere, a distance of 7.3 kpc was derived (Falanga et al. 2008). This translates into a persistent luminosity of LX (0.5–10 keV) ∼6–9 × 1035 erg s−1(i.e. ∼1.6–2.4 × 10⁻³LEdd; In’t Zand et al. 2002). The fact that SLX 1737–282 has exhibited only intermediate long bursts, the 90 d recurrence time and the persistent nature of the source at such low luminosities makes it an ultracompact X-ray binary (UCXB) candidate (In’t Zand, Jonker & Markwardt 2007; Falanga et al. 2008).
In this work, we present X-ray spectroscopy from Suzaku and XMM–Newton together with timing analysis from the latter facility, resulting in the most detailed soft X-ray analysis of the source up to date.
2 OBSERVATIONS AND DATA REDUCTION
2.1 Suzaku data
The Suzaku observatory (Mitsuda et al. 2007) observed SLX 1737–282 for 18 ks on 2009 March 11. The X-ray Imaging Spectrometer (XIS; Koyama et al. 2007) was operated in the normal mode using the full window option (time resolution of 8 s). We used the heasoft v.6.20 software and Suzaku Calibration Database (CALDB) to analyse our data. Following Armas Padilla et al. (2017), to which we refer the reader for further details on the data reduction, we created light curves and spectra with the ftoolxselect using circular regions of 100 arcsec radius centred on the source and on a source-free part of the CDD for extracting source and background events, respectively. We used the xisrmfgen and xisarfgen commands to produce the response matrix and ancillary response files (ARFs). We applied the aepileupcheckup.py script (Yamada et al. 2012) to verify that the pile-up fraction is less than 1 per cent at any radius of the point spread functions. We combined spectra and response files of the two Front-Illuminated (FI) detectors (XIS0 and XIS3) with the addascaspec task in order to maximize the signal-to-noise ratio. Because of the discrepancy with the FI-XISs detectors, probably by cross calibration uncertainties, we excluded the backside-illuminated camera XIS-1 spectrum from our analysis. In the Hard X-ray Detector (HXD; Takahashi et al. 2007), the source was only significantly detected by the PIN silicon diodes. We made use of the script hxdpinxbpi to generate the source and the non-X-ray background spectra using the cosmic X-ray background correction option. We used the response files provided in the Suzaku CALDB.
2.2 XMM–Newton data
SLX 1737–282 was observed on 2016 March 6 with the XMM–Newton observatory (Jansen et al. 2001) as part of the Galactic Centre lobe observations, which extend the Galactic Centre X-ray scan (Ponti et al. 2015). During the 39 ks observation with SLX 1737–282 in the field of view, both MOS (Turner et al. 2001) and PN (Strüder et al. 2001) detectors of the European Photon Imaging Camera (EPIC) were operated in imaging (full-frame window) mode. In the MOS1 detector, the source is placed between the CCD–1 and the dead CCD–6, therefore we did not include these data in our study. We used the Science Analysis Software (sas, v.16.0.0) to obtain calibrated events and scientific products.
We filtered episodes of flaring background by excluding data with count rates >0.22 counts s−1 at energies >10 keV and >0.5 counts s−1 at energies 10–20 keV for the MOS and PN cameras, respectively. Both detectors were affected by pile-up (net count rate of ∼3 counts s−1 and ∼7 counts s−1 when pile-up starts to be an issue when exceeding 0.5 and 2 counts s−1, respectively). In order to mitigate the effect of pile-up in our data, we used an annular extraction region centred at the source position with 60 arcsec outer radius and 10 arcsec inner radius. To extract MOS2 background events, we used an annulus centred at the source with 100 and 300 arcsec of inner and outer radius, respectively. In the case of PN background events, we used a circular region of 130 arcsec radius placed in the central part of the detector in order to avoid the EPIC internal ‘quiescence’ background issues (see the XMM–Newton users’ handbook1). Light curves and spectra, as well as associated response matrix files (RMFs) and ARFs were generated following the standard analysis threads2. We rebinned the spectrum in order to include a minimum of 25 counts in every spectral channel and avoiding to oversample the full width at half-maximum of the energy resolution by a factor larger than 3.
3 ANALYSIS AND RESULTS
3.1 Temporal analysis
We took advantage of the length and good enough time resolution of the XMM–Newton data to carry out a detailed timing analysis. The Suzaku XIS data were not included in this analysis as their time resolution is too low.
In a first step, we investigated the 1–10 keV EPIC-pn light curve using a 100 s bin size, which reveals the presence of significant variability (Fig. 1). The origin of this variability can be (broadly speaking) either accretion or absorption related. The latter is a very intriguing possibility as absorption dips allow measuring the orbital period of relatively high-inclination systems (with i ≳65°, White & Mason 1985; see also Cantrell et al. 2010 for an accurate inclination measurement in a non-dipping source). Indeed, dips are produced by the obscuration of the central X-ray source by orbital phase locked disc material, most likely in the disc bulge, which is the result of the gas stream from the companion impacting on the outer accretion disc rim. As the effect of obscuration by lowly ionized material is more conspicuous in the soft energy band, spectral hardening should be observed in correspondence with dip events (e.g. White & Mason 1985; Frank, King & Lasota 1987; Kuulkers et al. 2013; De Marco et al. 2015; Ponti et al. 2016). To test this possibility, we plot in Fig. 2 the corresponding hardness ratios, computed as the count rate ratio of the (hard) 2.5–10 keV band to the (soft) 1.0–2.5 keV band, versus intensity. We observe that the hardness ratio is correlated with the X-ray flux, which rules out obscuration dips as the origin of the observed low-frequency variability. Given the length of the XMM–Newton observations (39 ks), we conclude that SLX 1737–282 has an orbital inclination ≲ 65° unless the orbital period of the source is longer than ∼11 h, which is most likely infeasible given the X-ray behaviour of the source.
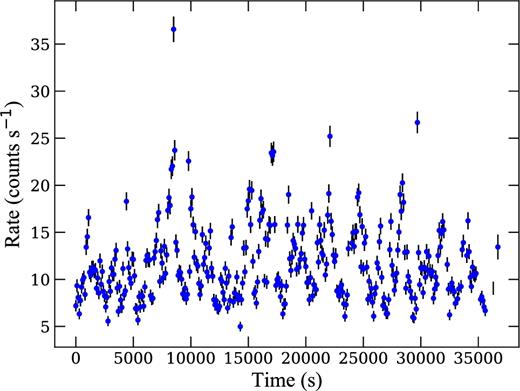
EPIC-pn 1–10 keV light curve at 100 s resolution.
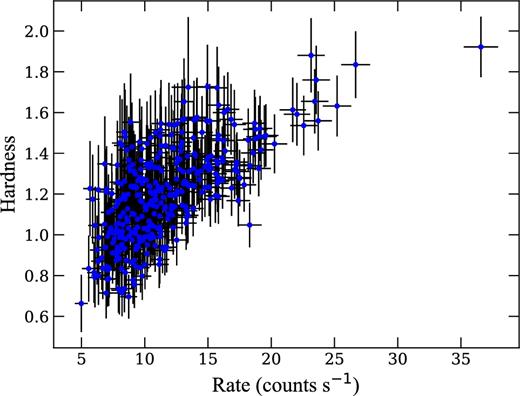
Hardness ratio (2.5–10 keV/1–2.5 keV) versus intensity diagram.
In a second step, we searched for periodic modulations by creating Lomb–Scargle periodograms (Scargle 1982) using the 0.3–8.0 keV EPIC-pn light curve. We investigated periods, linearly spaced in frequency, in the range 3 × 0.073 s (i.e. the CCD readout frame time) to 1000 s, using frequency resolution of Δf = 1/T = 2.7 × 10⁻⁵ Hz with T the duration of the observation. We did not detect any significant signal and derived upper limits for sinusoidal modulations at several of the highest peaks in the Lomb–Scargle power. Given the high count rate and the long observation, we are able to derive a stringent upper limit of 2 per cent for the semi-amplitude of possible sinusoidal modulations such as pulses from the NS.
Finally, and following Muñoz-Darias, Motta & Belloni (2011a) and Muñoz-Darias et al. (2014), we estimated the fractional root-mean-square (rms) of the fast variability amplitude (e.g. Vaughan et al. 2003; Ponti et al. 2012) to infer the accretion state of the source. To this end, we extracted the EPIC-pn light curve in the energy band 2–10 keV using 74 ms time bins. We divided the light curve into 74 s segments and computed the power spectral density (PSD) function for each of them. The contribution of Poisson noise to the total variability was estimated by fitting a constant to the high frequency (ν ≥ 2 Hz) part of each PSD. The derived Poisson noise contribution was subsequently subtracted for every frequency. Each PSD was normalized adopting the squared fractional rms normalization (Miyamoto et al. 1991). The intrinsic fractional rms was estimated by integrating the Poisson noise-subtracted, normalized PSDs in the frequency range of 0.1–7 Hz, and averaging the resulting values. The average PSD is shown in Fig. 3. We infer a fractional rms of 22 ± 3 per cent (where the error corresponds to the 1σ uncertainty). Comparing this value with those typically displayed by BHs (e.g. Muñoz-Darias et al. 2011a,b; Heil, Vaughan & Uttley 2012) and NSs (Muñoz-Darias et al. 2014) LMXBs during active phases, the inferred value is strongly indicative of SLX 1737–282 being in the hard state during the XMM–Newton observation.
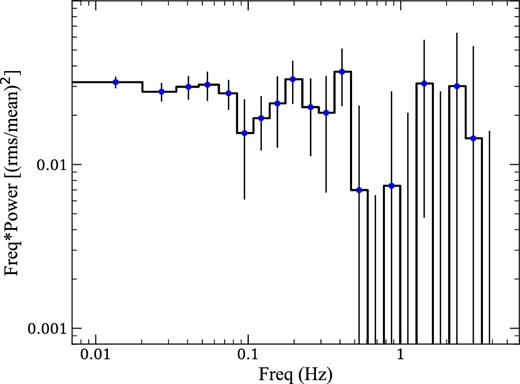
The PSD of SLX 1737–282 in the 2–10 keV energy band. The PSD is Poisson noise-subtracted and displayed using the fractional rms normalization (Miyamoto et al. 1991).
3.2 Spectral analysis
We used xspec (v.12.9.1; Arnaud 1996) to analyse both the Suzaku and XMM–Newton spectra. In order to account for interstellar absorption, we used the Tuebingen–Boulder interstellar medium absorption model (TBABS in xspec) with cross-sections of Verner et al. (1996) and abundances of Wilms, Allen & McCray (2000). In this work, we assume a distance of 7.3 kpc (Falanga et al. 2008), NS mass and radius of 1.4 M⊙ and 10 km, respectively, and an orbital inclination of 60°.
3.2.1 Suzaku spectra
We simultaneously fit the 1–10 keV FI-XISs and 15–30 keV HXD/PIN spectra by using tied spectral parameters. HXD/PIN data above 30 keV were excluded since they do not exceed the background level (at 3σ). In order to avoid the silicon K-edge and gold-M-edge calibration uncertainties, we exclude the 1.7–2.4 keV energy range. We included a constant factor (CONSTANT) fixed to 1 for XIS spectra and 1.16 for HXD spectra to account for cross-calibration uncertainties between the instruments.3
In a first attempt to fit the spectra, we used a simple two-component model from the hybrid modelling proposed by Lin, Remillard & Homan (2007) to fit NS spectra. We combined a soft component to account for either emission from a relatively cold accretion disc or from the NS surface/boundary layer, and a hard component to model the inverse-Comptonized emission from the Corona. Thus, we used a multicolour disc (MCD) or single blackbody (BB) plus a thermally Comptonized continuum model (i.e. DISKBB+NTHCOMP and BBODYRAD+NTHCOMP in xspec; Mitsuda et al. 1984; Makishima et al. 1986; Zdziarski, Johnson & Magdziarz 1996; Zycki, Done & Smith 1999).
Although both models return acceptable fits [χ2≅ 153 for 129 degrees of freedom (dof)], the MCD+Comptonization model yields results that are not physically acceptable. Indeed, the corrected inner disc radius inferred from the DISKBB normalization component (Ndiskbb ∼ 5) is smaller than the size of the NS (|$R_{\rm dis\text{c}}<$|10 km, applying correction of Kubota et al. 1998, see also Armas Padilla et al. 2017, and references therein). In addition, the temperature obtained is |$kT_{\rm dis\text{c}bb}$| = 0.67 ± 0.08 keV, which is a factor of ∼2–3 higher than the disc temperatures observed in other NSs (e.g. Armas Padilla et al. 2017) and BHs (e.g. Miller, Homan & Miniutti 2006; Munoz-Darias et al. 2013; Armas Padilla et al. 2014; Shidatsu et al. 2014; Plant et al. 2015) in the hard state at similar luminosity ranges. Therefore, we select the latter model (BBODYRAD+NTHCOMP) to fit our data. This model provides an overall good fit (χ2 = 153.3 for 129 dof) but it leaves residuals around ∼6.4 keV consistent with Fe Kα emission. Thus, we added a Gaussian (GAUSS) component to the modelling, which improved significantly the fit (χ2 = 133.12 for 126 dof, F-test probability ∼10−4). The line has a central energy of El = 6.4 ± 0.1 keV, σl = 0.16 ± 0.1 keV, therefore barely resolved (Δχ2 ∼ 5.78 if σl is fixed to 0), and an equivalent width of 110 ± 50 eV. The Fe Kα line is typically the most prominent feature of a reflection component from optically thick material (e.g. Cackett et al. 2009; Ng et al. 2010). We checked for the presence of a neutral reflection continuum associated with the Fe Kα line by replacing the Gaussian with the neutral Compton reflection model (PEXNOM in xspec; Nandra et al. 2007). This provides no significant changes in the fit (Δχ2 = 2.8 for 2 dof) indicating that this line could be produced by reflection from either optically thick or thin material (García et al. 2015; Nayakshin, Kazanas & Kallman 2000). The best-fitting results are reported in Table 1 and Fig. 4 with uncertainties given at 90 per cent confidence level.
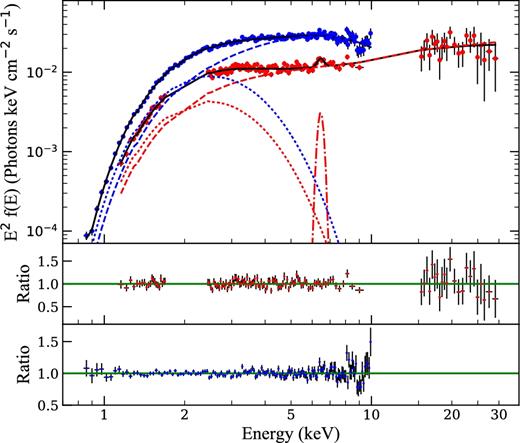
Unfolded Suzaku (red) and XMM–Newton (blue) spectra and data-to-model ratio using BBODYRAD+NTHCOMP model. The full fit is shown as a solid line, the blackbody component as a dotted line, the Comptonized component as a dashed line and the Suzaku Gaussian component as a dot–dashed line.
Fitting results for the BBODYRAD+NTHCOMP model for the Suzaku and XMM–Newton observations. Uncertainties are expressed at 90 per cent confidence level.
| Component | Suzaku | XMM–Newton |
|---|---|---|
| NH (× 1022 cm−2) | 1.9 ± 0.2 | 1.9 ± 0.1 |
| kTbb (keV) | 0.51 ± 0.04 | 0.53 ± 0.05 |
| Nbb/Rbb (km) | 18|$^{+8}_{-5}$|/3.1|$^{+0.6}_{-0.4}$| | 32|$^{+6}_{-7}$|/4.1 ± 0.3 |
| Γ | 1.68 ± 0.08 | 1.49|$^{+0.3}_{-0.4}$| |
| kTe (keV) | >7.4 | 2.0|$^{+0.4}_{-0.3}$| |
| Nnthcomp (× 10−3) | 2.17 ± 0.5 | 3.7 ± 3 |
| Egaus (keV) | 6.4 ± 0.1 | – |
| σgaus (keV) | 0.16|$^{+0.1}_{-0.08}$| | – |
| kgaus (× 10−5 photons cm−2 s−1) | 3 ± 1 | – |
| χ2dof | 133.12/126 | 148.04/148 |
| (0.5–10 keV) | ||
| FX (× 10−11ergcm−2s−1) | 4.6 ± 0.1 | 9.77 ± 0.2 |
| LXa (× 1035ergs−1) | 2.93 ± 0.06 | 6.2 ± 0.1 |
| BB fraction | 30 | 27 |
| NTHCOMP fraction | 70 | 73 |
| (0.5–30 keV) | ||
| FX (× 10−11ergcm−2s−1) | 7.68 ± 0.2 | – |
| LXa (× 1035ergs−1) | 4.89 ± 0.1 | – |
| BB fraction | 18 | – |
| NTHCOMP fraction | 82 | – |
aUnabsorbed luminosity assuming a distance of 7.3 kpc.
We obtain an equivalent hydrogen column density (NH) for the absorbing material of (1.9 ±0.2)× 1022 cm−2, consistent with the value reported by In’t Zand et al. (2002). The temperature of the blackbody component (kTbb = 0.49 ± 0.04 keV) is within the typical range of temperatures measured for other NS LMXBs in the hard state (e.g. Campana et al. 2014). We infer an emission radius (Rbb) of ∼3 km from the blackbody normalization assuming a spherical geometry, which might indicate that the emission arises from a small region of the NS (e.g. from an equatorial belt in the orbital plane or from the magnetic poles; Barret 2001; Lin et al. 2007; Matsuoka & Asai 2013). Nevertheless, we note that it is not straightforward to obtain physically meaningful Rbb values from this kind of modelling. Also, we did not apply any correction for the photons scattered by the Corona which might increase the obtained values by a factor <2 (see Kubota et al. 2004). The Comptonization asymptotic power-law photon index (Γ) is 1.69 ± 0.09. The temperature of the electron corona is not constrained, and has a lower limit of kTe > 7.4 keV. The inferred 0.5–10 keV unabsorbed flux is (4.6 ± 0.1) × 10−11ergcm−2s−1, which corresponds to LX = (2.93 ± 0.06) × 1035erg s−1. The thermal component accounts for 30 per cent of the total flux in this band. Similarly, in the 0.5–30 keV band, we measure (7.7 ± 0.2) × 10−11 erg cm−2 s−1 [LX(0.5–30 keV) = (4.9 ± 0.1) × 1035 erg s−1] and a thermal contribution of 18 per cent.
3.2.2 XMM–Newton spectrum
For clarity purposes, we report the results of the fit of EPIC-pn (the instrument with the larger effective area) data only. Nevertheless, we note that results obtained from MOS2 as well as the combination of PN and MOS spectra yield consistent results.
We fit the 0.8–10 keV spectrum with the same model used for the Suzaku data, but excluding the Gaussian component since it was not required by the fit. Therefore, we used BBODYRAD+NTHCOMP, which produces an acceptable fit (χ2 = 148.04 for 148 dof). We infer a 0.5–10 keV unabsorbed flux of (10.3 ± 0.3) × 10−11 erg cm−2 s−1, which translates into LX = (6.6 ± 0.2) × 1035ergs−1, that is, a factor of 2 more luminous than the Suzaku spectra. The blackbody parameters, kTbb = 0.53 ± 0.05 keV and Rbb = 4.1 ± 0.3 km are consistent with those obtained with Suzaku, while Γ is slightly harder (1.49 ± 0.4). In this case, the electron temperature was constrained to be atypically small (kTe = 2.0 ± 0.4 keV; see Section 4). Finally, and in agreement with the Suzaku spectrum we obtain NH = (1.9 ± 0.1) × 1022 cm−2(see Table 1).
3.2.3 Exploring alternative spectral scenarios
Recent studies have shown that the three-component model from the hybrid model (Lin et al. 2007) adequately fits both hard and soft state NS spectra when high-quality data (including broad-band coverage and soft energies) are available (Armas Padilla et al. 2017; Ponti et al. 2017, submitted). Thus, we explored the three-component model (DISKBB+BBODYRAD+NTHCOMP) for fitting our spectra. This modelling yields good fits (χ2= 129.02 for 124 dof and χ2 = 147.19 for 146 dof for Suzaku and XMM–Newton, respectively) with spectral values within the usual ranges for NSs in the hard state. However, the fits become degenerated, as the extra thermal component is not strictly required by the data (F-test probability ∼0.1). For reference, the disc temperature upper limits are kTdiskbb < 0.5 keV and <0.7 keV for Suzaku and XMM–Newton, respectively. In the same way, we also examined the most simplistic model, a single Comptonization model (NTHCOMP). This model does not provide a good fit for the Suzaku spectra (χ2 = 226.62 for 130 dof). On the other hand, although it returns an acceptable fit for the XMM–Newton data (χ2 = 161.54 for 149 dof), an F-test indicates that the fit would significantly improve by adding the thermal component (F-test probability ∼10−4). Additionally, the inferred Γ ∼ 2 is softer than typically observed in the hard state (but see Wijnands et al. 2015 for only power-law fits).
4 DISCUSSION
SLX 1737–282 is one of the few known LMXB persistently accreting at luminosities lower than LX∼ 0.01LEdd (e.g. in’t Zand, Cornelisse & Méndez 2005; Chelovekov & Grebenev 2007; Del Santo et al. 2007; Degenaar et al. 2012; Armas Padilla, Degenaar & Wijnands 2013; Degenaar et al. 2017). In order to study the spectral and timing properties in this regime, high-quality observations resulting from long exposures, such as those presented here, are essential. In this work, we report on two observations obtained with Suzaku and XMM–Newton over a time span of 7 yr. The 0.5–10 keV X-ray luminosity during these observations was in the range of 3–6 × 1035 erg s−1, which is consistent with previous measurements (In’t Zand et al. 2002; Falanga et al. 2008). This implies that the NS is still continuously accreting at 10−3LEdd. SLX 1737–282, which is located ∼1.3° above the Galactic Centre, is absorbed by a column density of neutral material of NH = 1.9(±0.1) × 1022 cm−2. This is a factor of 8–9 times lower compared to the value observed for Sgr A* and its immediate surroundings (Ponti et al. 2017).
Our timing analysis does not reveal the presence of dipping phenomena, which would eventually allow us to constrain the orbital period of the system and test the suspected ultracompact nature of SLX 1737–282. However, we are able to discard flux pulsations with semi-amplitudes larger than 2 per cent the observed flux. Moreover, from the XMM–Newton observation we are able to measure an integrated fractional rms (0.1–7 Hz) of ∼20 per cent, which indicates that the source was in the hard state (Muñoz-Darias et al. 2014) during this epoch, and strongly suggests a similar scenario for the Suzaku data given its lower associated luminosity.
The spectral analysis of the source is consistent with the above picture, as the X-ray spectrum is well modelled by a combination of a thermal component with kTbb ∼ 0.5 keV, that contributes ∼30 per cent to the 0.5–10 keV flux, and a thermally Comptonized component with Γ ∼ 1.5–1.7. XMM–Newton observations of several NS LMXB at low luminosities – both transient (e.g. Armas Padilla et al. 2011; Degenaar, Wijnands & Miller 2013; Chakrabarty et al. 2014; Arnason et al. 2015) and persistent (e.g. Armas Padilla et al. 2013; Degenaar et al. 2017) systems – have been successfully modelled with this two-component model. However, the blackbody temperature inferred here is slightly higher than typically observed in other persistent, low-luminosity systems with kTbb ∼ 0.3 keV (Armas Padilla et al. 2013). Still, these objects have luminosities that are up to one order of magnitude lower. Indeed, the kTbb temperature obtained for IGR J17062−6143, quasi-persistent at ∼1.6 × 1035 erg s−1, is similar to that measured here for SLX 1737–282 (Degenaar et al. 2017). The radius obtained from the blackbody normalization (Rbb ∼ 3–4 km) is smaller than the NS radius, and this might indicate that the emission arises from a reduced region of the NS surface. This could be explained by a boundary layer with a belt shape, in which the gas from a geometrically thin disc is accreted towards the NS equatorial region. However, this accretion geometry seems unlikely in the mid-to-low luminosity phase of the hard state. On the other hand, accretion through the magnetic poles could also account for the small blackbody normalization, but we do not detect coherent X-ray pulsations (but see Matsuoka & Asai 2013, for a possible non detection justification). In any case, we note that the radius obtained by this modelling is not physically meaningful and it could be underestimated by a factor of up to 2 (see Section 2.1).
While the overall spectral parameters are consistent between the XMM–Newton and the Suzaku observations, the temperatures measured for the Comptonizing electron cloud are found to be different. The (broader band) Suzaku spectrum obtained at lower luminosity yields only a lower limit of kTe > 7.4 keV, whilst the fit of the XMM–Newton data requires a very low electron temperature (kTe ∼2 keV). The temperature of the corona in NS systems is typically observed to change through the outburst according to the different accretion states. In the soft state, the Corona is characterized by a cold temperature (kTe ≲ 5 keV) and an optical depth ≳5, whereas in the hard state kTe ≳ 10 keV is typically observed as well as lower optical depths of ∼2 (Lin et al. 2007; Armas Padilla et al. 2017; see also Motta, Belloni & Homan 2009 for BHs). In addition, recent work by Burke, Gilfanov & Sunyaev (2017) illustrates the differing Corona properties between BH and NS in the hard state. In particular, the electron temperature in NS systems is observed to be lower due to the additional cooling from seed photons coming from the boundary layer or the NS star surface. In any case, the inferred value from our XMM–Newton observation is lower than typically observed for NS in the hard state. However, we note that the low-luminosity regime has been scarcely explored and the broader spectral coverage of our Suzaku observation provides a result, which is consistent with standard values.
5 CONCLUSIONS
We have presented the most detailed soft X-ray study up to date of the persistent, low-luminosity NS X-ray binary SLX 1737–282. Both the spectral and timing analysis of the source are consistent with SLX 1737–282 being in a very faint hard state. The spectral parameters are in agreement with those derived from the handful of high-quality observations obtained for objects of this class. On the other hand, some observables, such as those related to the physical conditions of the Comptonizing corona remain unclear, as well as the ultracompact nature of the source. Future multiwavelength observations of SLX 1737–282 and other persistent, low-luminosity LMXBs are required in order to get new insights on the accretion physics at work in this sub-luminous regime.
Acknowledgements
We thank Chichuan Jin for discussion and help with modelling of the distortions induced by dust scattering. The research leading to these results has received funding from the European Union's Horizon 2020 Programme under the AHEAD project (grant agreement n. 654215). MAP and TM-D acknowledge the hospitality of the Max-Planck-Institut für extraterrestriche Physik, where this work was carried out. MAP's research is funded under the Juan de la Cierva Fellowship Programme (FJCI-2014-22661) of the Ministry of Science and Innovation (MINECO) of Spain. BDM acknowledges support from the European Union's Horizon 2020 research and innovation programme under the Marie Skłodowska-Curie grant agreement No.665778 via the Polish National Science Center grant Polonez UMO-2016/21/P/ST9/04025. TMD acknowledges support via a Ramon y Cajal Fellowship (RYC-2015-18148). This research has made use of data obtained from the Suzaku satellite, a collaborative mission between the space agencies of Japan (JAXA) and the USA (NASA). The XMM–Newton Galactic Lobe project is supported by the Bundesministerium für Wirtschaft und Technologie/Deutsches Zentrum für Luft- und Raumfahrt (BMWI/DLR, FKZ 50 OR 1408) and the Max Planck Society. XMM–Newton is an ESA science mission with instruments and contributions directly funded by ESA Member States and NASA.
Suzaku Memo 2008-06 at http://www.astro.isas.jaxa.jp/suzaku/doc/suzakumemo
REFERENCES
