


Abstract
I studied giant discy galaxies with optical radii more than 30 kpc. The comparison of these systems with discy galaxies of moderate sizes revealed that they tend to have higher rotation velocities, B-band luminosities, H i masses and dark-to-luminous mass ratios. The giant discs follow the trend |$\log (M_{\rm H\,\scriptscriptstyle I})(R_{25})$| found for normal sized galaxies. It indicates the absence of the peculiarities of evolution of star formation in these galaxies. The H i mass-to-luminosity ratio of giant galaxies appears not to differ from that of normal-sized galaxies, giving evidence in favour of similar star formation efficiency. I also found that the bars and rings occur more frequently among giant discs. I performed mass modelling of the subsample of 18 giant galaxies with available rotation curves and surface photometry data and constructed χ2 maps for the parameters of their dark matter haloes. These estimates indicate that giant discs tend to be formed in larger more massive and rarified dark haloes in comparison to moderate-sized galaxies. However, giant galaxies do not deviate significantly from the relations between the optical sizes and dark halo parameters for moderate-sized galaxies. These findings can rule out the catastrophic scenario of the formation of at least most of giant discs, since they follow the same relations as normal discy galaxies. The giant sizes of the discs can be due to the high radial scale of the dark matter haloes in which they were formed.
1 INTRODUCTION
One of the most important problems in the theories of formation and evolution of galaxies is the lack of knowledge about the physical processes and characteristics that have the most significant effect on the observed properties. Are these factors internal (the total mass or the properties of the host dark halo) or external (environment)? The possible way to find this out is to pay attention to the unusual objects like giant discy galaxies that may differ significantly by the properties, which give clues about the evolution of galaxies.
Giant discy galaxies and their extreme representative giant low surface brightness (LSB) galaxies are known since 30 years (Bothun et al. 1987; Bothun et al. 1990). They have high total masses of ∼1012M⊙ and discs of enormous radii of up to 150 kpc. The formation of such systems represents a certain problem for hierarchical clustering concept in which the dark haloes hosting discy galaxies do not undergo major mergers.
I decided to look into the galaxies with more moderate but still high sizes with higher surface brightnesses in comparison to giant LSBs (the selection criteria and the sample are described below.). I had three reasons to choose them. First, due to the higher surface brightnesses, these systems have more available data on the rotational amplitude in comparison to giant LSBs; for some of them even extended stellar kinematics is measured. These data are very important if one needs to determine the parameters of dark matter (DM) haloes (which is one of the aims of my study). Secondly, these galaxies are more numerous in comparison to giant LSBs and I can study the statistics of their characteristics properly. Thirdly, it is essential to understand how the properties of giant high surface brightness (HSB) discy galaxies correspond to that of giant LSBs and normal moderate-sized discs. Could they be intermediate link between giant LSBs and’normal’ discy galaxies?
A lot of effort has already been made in order to understand the formation scenario of giant discs (see e.g. Lelli, Fraternali & Sancisi 2010; Reshetnikov, Moiseev & Sotnikova 2010; Kasparova et al. 2014; Courtois et al. 2015; Ogle et al. 2016 and references therein). Courtois et al. (2015) studied a sample of the most H i massive and fastest rotating disc galaxies in the local Universe and found possible connection of their unusual properties with the environment. According to their research the most massive H i detected galaxies are located preferentially in filaments. Ogle et al. (2016) considered superluminous spiral galaxies and proposed that they could be a result of major merger of two spiral gas-rich galaxies, or alternatively they could be formed gradually by accretion of cold gas. In this case, the halo should have a relatively low mass to avoid accretion shocks which can influence the settling of the gas in the outer parts of the discs. Ghosh & Mapelli (2008) studied giant ring galaxy UGC7069 with a diameter of ∼115 kpc and concluded that it could be produced by flyby interactions between galaxies. They considered the presence of such a giant ring as an indirect proof that ring galaxies might evolve into giant LSB galaxies like Malin1. The major merger scenario of the formation of giant discy galaxies was also discussed in Reshetnikov et al. (2010) and Lelli et al. (2010) (see also the references therein). By contrast Kasparova et al. (2014) studied giant LSB galaxy Malin2 and proposed that there is no need to involve the catastrophic scenario and its unusual structure could be due to the peculiar properties of its DM halo–high radial scale of the halo and probably poor gas environment at the time when the disc was formed.
The aim of this paper is to study the statistics of the giant HSB galaxies, to obtain their DM halo parameters and to compare them to the galaxies with’normal’ disc sizes and – if possible – with giant LSBs. It will aid in understanding of the reasons of the formation of giant discy systems.
The current paper is organized as follows. Section 2 is devoted to the description of the selection criteria and the sample of giant spiral galaxies; the statistics of the parameters of giant galaxies and their comparison with the total sample of spiral galaxies from Hyperleda are given in Section 3; Section 4 is dedicated to the details of the estimate of the parameters of DM haloes of several giant galaxies; the discussion is given in Section 5; the main results are summarized in Section 6.
2 THE SAMPLE
I consider the galaxies with the highest optical radii available in Hyperleda data base1 (Makarov et al. 2014). To define the sample of giant discy galaxies I requested from the data base the galaxies with half of the length of the projected major axis at the isophotal level 25 mag arcsec−2 in the B band R25 > 30 kpc, with morphological types t > 0, inclination i > 40° with available measurements of rotation velocity. I added the latter two specifications since I was interested in the dynamical mass estimates of the galaxies. The low inclination angle makes the rotation velocity estimate uncertain, thus the galaxies which were close to face-on were removed by the selection criterion. Another source of the uncertainty of dynamical mass is in the non-circular velocities induced by the gravitational interaction of galaxies. The tight interaction can also lead to the erroneous determination of the optical radius. Thus, I inspected the images of all giant galaxies from the sample and deleted closely interacting and perturbed galaxies. After all these selections, I had a sample of 272 giant discy galaxies.
The giant galaxies of my sample have similar H i masses as the most H i massive and fastest rotating disc galaxies from the sample of Courtois et al. (2015) – the median value of H i mass for my sample is 2.36 × 10¹⁰ solar masses. The stellar masses for the galaxies of my sample with available (B − V)0 colour indices are comparable to that of the superluminous spiral galaxies from Ogle et al. (2016). The closest galaxy of my sample is at the distance of roughly 17 Mpc and the most distant is at 662 Mpc. My sample has seven common objects with the sample of Courtois et al. (2015), but none with that of Ogle et al. (2016), since it contains predominantly more distant galaxies than in the current sample.
Most of the galaxies of the sample are not LSB, since for LSB galaxy the radius R25 should be significantly lower than the disc size due to low central surface brightness, so they will be excluded by the selection criterion unless, not to propose that giant HSB disc is surrounded by even more giant LSB disc which seems to be very exotic.
To learn more about the evolution of giant discy galaxies it is important to compare their properties to that of the entire sample of galaxies with the same types, inclinations, but without any restrictions on the disc sizes. So I made similar request to the data base as for giant galaxies but without the specification for R25. The resulted entire sample consisted of 23 756 systems. I used this sample for the comparison with the sample of giant discy galaxies. All properties that I used in the statistical analysis in the next section were taken from Hyperleda data base.
3 STATISTICS
As one can expect, giant discy galaxies appear to have higher B-band luminosities than the entire sample (see Fig. 1). This difference is significant according to Kolmogorov–Smirnov (hereafter KS) test with the significance level 0.05. The giant discy galaxies also have higher rotation velocities (see Fig. 2), which is also significant as follows from the KS test. This difference indicates that giant discs are both more luminous and more massive than discy galaxies of moderate sizes. I roughly calculated the dynamical masses of the galaxies inside the optical borders using the following formula: M ≈ V2R25/G, where R25 is the optical radius of object, V is its rotation velocity corrected for inclination and G is gravitational constant. The dynamical mass-to-light ratio can give one clues on the fraction of the DM in galaxies, so I compared the galaxies by the ratios of the dynamical masses to B-band luminosities (see Fig. 3). As one can see from the histograms, the giant discy galaxies tend to have higher dynamical mass-to-light ratios (the difference is significant according to the KS test.). Partly this difference can be explained by higher gas masses of giant discy galaxies (see Fig. 4). However, the H i mass to B-band luminosity ratios of giant discs are statistically not different from that of the galaxies from the entire sample if to delete the latest type galaxies from the entire sample, since they are absent in the sample of giant galaxies (see Fig. 5).2 It is in good agreement with Courtois et al. (2015) who found that there is no difference in stellar-to-baryonic mass ratio between the H i massive sample they studied and the typical disc galaxies. I also found that giant discy galaxies do not deviate from the correlation |$\log (M_{\rm H\,\scriptscriptstyle I})(R_{25})$| found for the galaxies with moderate sizes (see Fig. 6, where the line shows the fit for the moderate-sized galaxies and squares and circles correspond to giant and moderate-sized galaxies). It can give evidence of the absence of the peculiarities in the evolution of star formation of giant spirals. I can conclude that most of giant discs did not experience very strong star formation bursts or strangulation.
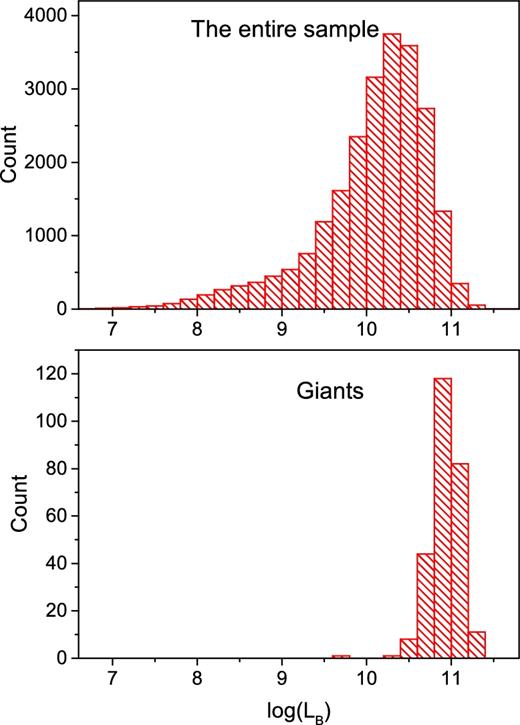
The histograms for B-band luminosities of the entire sample (upper panel) and giant discy galaxies (bottom panel). The bins are the same for both histograms.
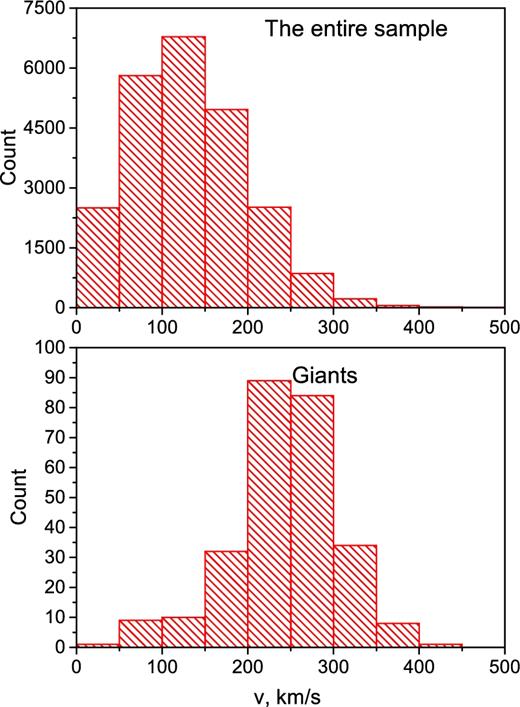
The histograms for rotation velocity of the entire sample (upper panel) and giant discy galaxies (bottom panel). The bins are the same for both histograms.
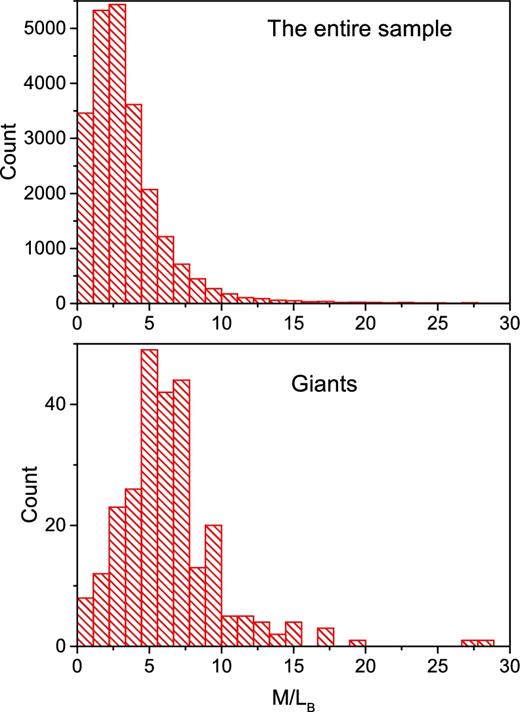
The histograms for the dynamical mass to light ratio in B band of the entire sample (upper panel) and giant discy galaxies (bottom panel). The bins are the same for both histograms.
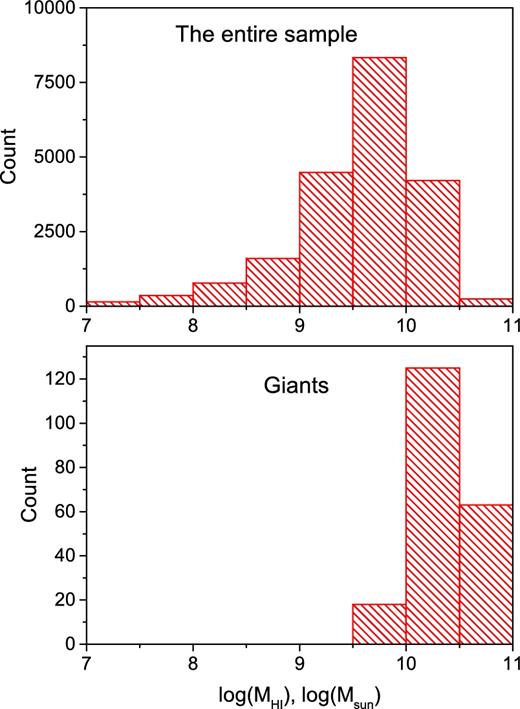
The histograms for the H i mass of the entire sample (upper panel) and giant discy galaxies (bottom panel). The bins are the same for both histograms.
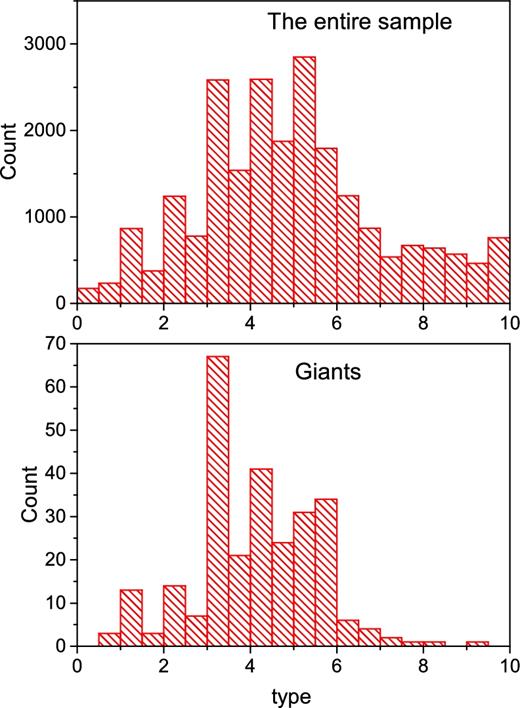
The histograms for the morphological type of the entire sample (upper panel) and giant discy galaxies (bottom panel). The bins are the same for both histograms.
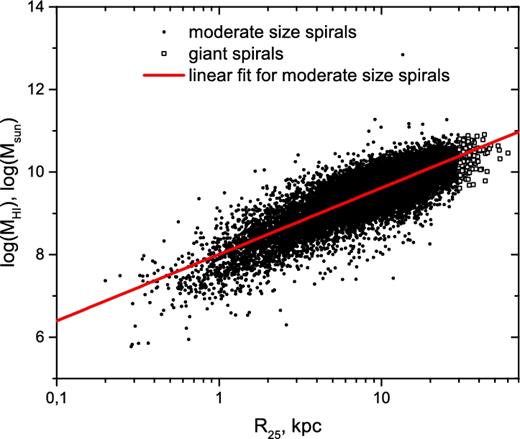
The relation between the optical radius and H i mass. Small circles show discy galaxies with R25 < 30 kpc. Squares correspond to giant spirals. Line shows the fit for the galaxies with R25 < 30 kpc.
The giant discy galaxies differ from’normal’ ones by the total-to-baryonic mass ratio [the baryonic mass is calculated as a sum of the H i mass and stellar mass estimated from the (B − V)0 colour indices and model M/L–colour relations from Bell & de Jong (2001)]. The giant discy galaxies tend to have higher total-to-baryonic mass ratios in comparison to the entire sample, although the statistics for giant galaxies becomes poor due to the lack of colour indices for the bulk of these systems. Thus the difference between dynamical mass-to-light ratios could be due to the higher fraction of DM either in baryonic (i.e. cold gas non-detected by its emission; see e.g. Kasparova et al. 2014) or no-baryonic form in giant discs.
Other specialties of giant discs are their shortage at the distances D < 100 Mpc (see Fig. 7) and their lower mean B-band surface brightnesses of the discs (see Fig. 8). The latter can indicate that giant discs are more rarified in comparison to typical late-type galaxies.
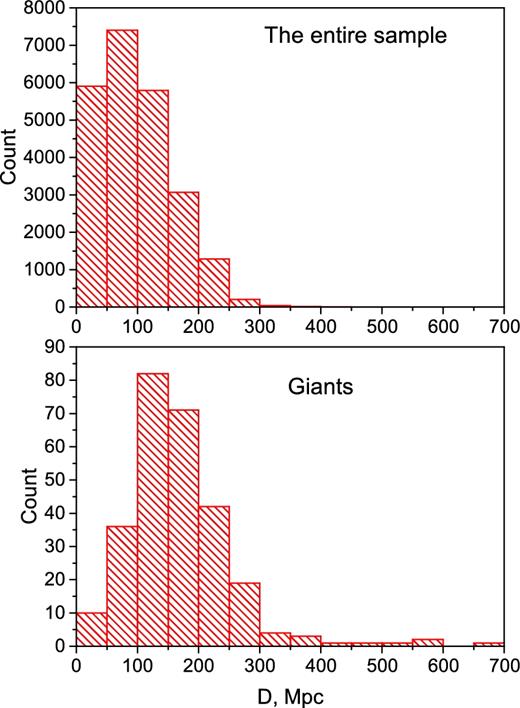
The histograms for the distances of the entire sample (upper panel) and giant discy galaxies (bottom panel). The bins are the same for both histograms.
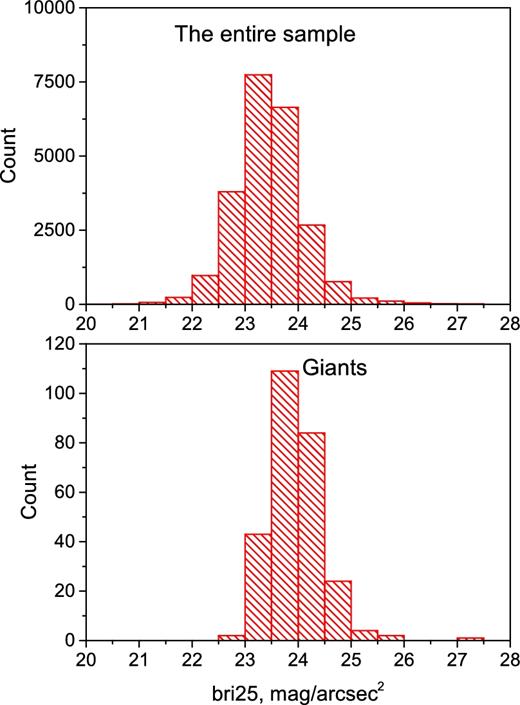
The histograms for the mean surface brightness within B-band isophote 25 mag arcsec−2 of the entire sample (upper panel) and giant discy galaxies (bottom panel). The bins are the same for both histograms.
Since bars can play an important role in evolution of galaxies I decided to compare the samples by the fraction of barred galaxies. According to my analysis the bars are slightly more frequent for giant discs in comparison to moderate-sized galaxies. I found the following frequencies of bar occurrence: 1/2.67 and 1/3.2 for giant galaxies and the entire sample, respectively. According to Seidel et al. (2015) bars do not strongly influence the global kinematics of their host galaxies; however they can have noticeable effect on the inner kinematics inducing the formation of inner disc or a peanut-shaped bulge (see e.g. Saburova et al. 2017). The bars in principle can supply with gas the central black hole which mass in turn can be related to the processes of fading of star formation in giant discs. Ogle et al. (2016) proposed that the insufficient mass of supermassive black hole can lead to the absence of strong feedback that drives away the gas from giant discs. However, it seems unlikely that bar has significant influence on the AGN strength (see e.g. Cisternas et al. 2015). Thus it is hardly probable that bars are strongly connected to the high disc sizes of giant galaxies.
Interestingly, the ring occurs in giant galaxies two times more frequently than in the entire sample; the frequencies of the ring are 1/4.69 and 1/10.2 for the giant discs and the entire sample, respectively. It can in principle indicate that at least a part of these objects has something in common with the largest ring galaxy UGC7069 studied by Ghosh & Mapelli (2008) (see Section 1). At the same time the higher luminosities, rotation velocities, H i masses of giant spirals and the fact that they follow the trend |$\log (M_{\rm H\,\scriptscriptstyle I})(R_{25})$| found for normal-sized galaxies speak against the catastrophic scenario of the formation of these systems in which the normal-sized galaxy is blown up. In this case one would expect them to have similar masses as moderate-sized spirals and to lie below the correlation |$\log (M_{\rm H\,\scriptscriptstyle I})(R_{25})$| which contradicts the results of current paper.
Another feature that could be important is the distribution of giant discs by inclination. In Fig. 9 I show the histograms plotted for the inclinations of giant galaxies and the entire sample. One can see that there is an excess of objects with i = 90° both for the entire sample and for giant galaxies. This excess is due to the fact that some of objects are erroneously considered as edge-on galaxies. One can see that the fraction of the galaxies with i = 90° is higher for the sample of giants. The dust extinction has higher influence on the surface photometry of the systems in a position close to edge-on. However, since I used B-band determination of the optical sizes I do not expect significant overestimation of R25 due to the dust extinction.
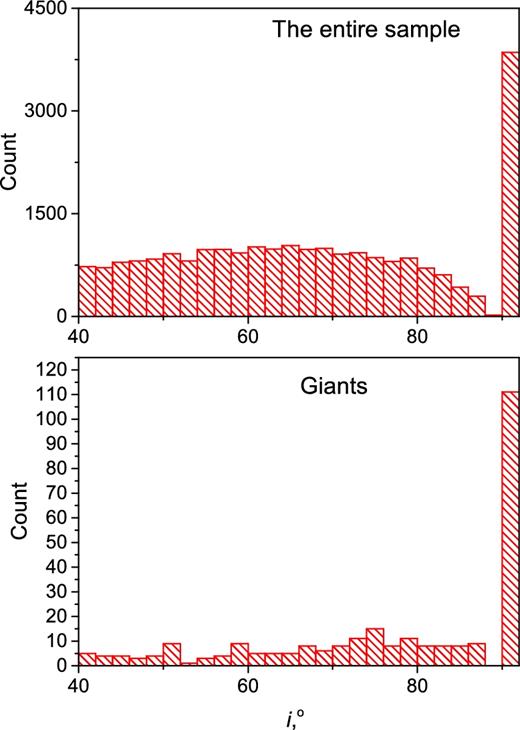
The histograms for the inclination of the entire sample (upper panel) and giant discy galaxies (bottom panel). The bins are the same for both histograms.
Since the environment can have significant influence on the evolution of galaxies I paid attention to the frequencies of the membership of systems to associations such as groups and clusters and compared these frequencies for the giant discs to that for the total sample of galaxies. To do it, I utilized the Hierarchy catalogue from Hyperleda and the galaxy group catalogues based on the 2MRS and SDSS DR12 galaxy samples by Saulder et al. (2016). According to both sources, giant galaxies tend to be slightly more rarely in groups and in clusters. This conclusion is in good agreement with that of Courtois et al. (2015) who found that none of the giant disc galaxies from their sample is in a highly overdense environment. However, Courtois et al. (2015) also concluded that the most massive H i detected galaxies are located preferentially in filaments. These conclusions can indicate that it is environment at the stage of galaxies formation that had the highest impact on the evolution of giant systems and could aid in the formation of the large discs, but not the current environment.
4 ON THE PARAMETERS OF DARK HALOES
As far as DM halo plays important role in the evolution of galaxies it is essential to know if there are any peculiarities in the DM haloes of giant discy galaxies. Thus, as the next step I referred to the compilation of Spatially Resolved Kinematics of galaxies3 – one of the Hyperleda projects and searched for the rotation curves of the giant galaxies. My goal was to obtain the DM halo parameters of the galaxies as reliably as it is possible using the decomposition of the rotation curve into the components. This method has its weak points, which are discussed e.g. in Saburova, Kasparova & Katkov (2016) and taken into account in current paper. Along with the rotation curve I required the photometrical parameters of discs and bulges. Eventually, I had a sample of 18 giant galaxies with available rotation curves of satisfactory quality and the parameters of disc and bulge. In Table 1 I list the galaxies, the adopted distances, inclinations and the sources of the rotation curve and photometrical parameters. The line-of-sight velocity profiles from Mathewson et al. (1992) were corrected for systemic velocity and inclination in good agreement with that was previously done by Persic & Salucci (1995).
The properties of giant discy galaxies with available rotation curves, adopted distance, inclination, the source papers for rotation curve and surface photometry.
| Galaxy | D | i | Source of | Source of |
|---|---|---|---|---|
| (Mpc) | (°) | rotation curve | bulge and disc parameters | |
| ESO030-009 | 114.8 | 82.1 | Mathewson, Ford & Buchhorn (1992) | Mathewson et al. (1992) |
| ESO184-051 | 103 | 78.4 | Mathewson et al. (1992) | Mathewson et al. (1992) |
| ESO240-011 | 35.4 | 90 | Kregel & van der Kruit (2004) | Kregel, van der Kruit & de Grijs (2002) |
| ESO382-058 | 106.2 | 79 | Mathewson et al. (1992) | Palunas & Williams (2000) |
| ESO460-031 | 84 | 90 | Mathewson et al. (1992) | Mathewson et al. (1992) |
| ESO471-002 | 121 | 73.2 | Mathewson et al. (1992) | Mathewson et al. (1992) |
| ESO563-021 | 70.1 | 83 | Spekkens & Giovanelli (2006) | Spekkens & Giovanelli (2006) |
| IC0724 | 125.6 | 73.1 | Corsini et al. (1999) | Moriondo, Giovanardi & Hunt (1998) |
| IC1862 | 89.2 | 90 | Mathewson et al. (1992) | Mathewson et al. (1992) |
| IC2531 | 36.8 | 86–90 | Allaert et al. (2015) | Xilouris et al. (1999) |
| NGC 0973 | 63.5 | 88 | Allaert et al. (2015) | Xilouris et al. (1997) |
| NGC 4705 | 62.9 | 78.4 | Mathewson et al. (1992) | Mathewson et al. (1992) |
| NGC 5529 | 49.5 | 85–87.5 | Allaert et al. (2015) | Xilouris et al. (1999) |
| NGC 7184 | 34.67 | 90 | Mathewson et al. (1992) | Mathewson et al. (1992) |
| PGC006966 | 70.2 | 90 | Mathewson et al. (1992) | Mathewson et al. (1992) |
| UGC02885 | 80.6 | 72 | Struve et al. (2007) | Lelli, McGaugh & Schombert (2016) |
| UGC04277 | 76.5 | 87.3 | Allaert et al. (2015) | Bizyaev & Mitronova (2002) |
| UGC05341 | 99.85 | 90 | Catinella, Haynes & Giovanelli (2005) | Bizyaev & Mitronova (2002) |
The photometrical parameters of discs and bulges of the giant discy galaxies obtained in current paper, central surface brightness of bulge, effective radius of bulge, Sérsic index of bulge, central surface brightness of exponential disc and radial scalelength of disc.
| Galaxy | (μ0)b | Re | n | (μ0)d | Rd |
|---|---|---|---|---|---|
| (mag arcsec−2) | (arcsec) | (mag arcsec−2) | (arcsec) | ||
| ESO030-009 | 18.23 | 4.6 | 0.74 | 19.59 | 23.27 |
| ESO184-051 | 15.86 | 2.26 | 1.56 | 19.21 | 17.02 |
| ESO382-058 | 15.17 | 0.71 | 1.45 | 19.82 | 9.66 |
| ESO460-031 | 18.27 | 8.81 | 1.02 | 20.18 | 25.98 |
| ESO471-002 | 17.95 | 4.09 | 1.61 | 19.42 | 12.59 |
| ESO563-021 | 17.86 | 1.65 | 0.80 | 19.04 | 8.37 |
| IC1862 | 18.38 | 4.41 | 0.77 | 19.11 | 17.09 |
| NGC 4705 | 17.40 | 16.33 | 1.63 | 19.85 | 29.06 |
| NGC 7184 | 17.42 | 5.48 | 0.69 | 18.88 | 40.37 |
| PGC006966 | 18.53 | 5.26 | 0.46 | 19.24 | 20.75 |
| UGC02885 | 13.38 | 7.15 | 1.98 | 17.78 | 26.57 |
I took the gaseous surface density radial profiles from the sources of the rotation curves if they were available. In the opposite case I fixed the gas density at zero level. The uncertainties of the rotation velocity amplitude were given by far not in every paper, which is a separate problem. In cases of the absence of error bars I used the mean dispersion of the points as the error. I made tests with different values of errors and concluded that it has no significant influence on the main conclusion of current paper but it can affect the uncertainties of the dark halo central density and radial scale, which are known to be ambiguous due to the degeneracy of these parameters and are already taken with great caution (see below).
In order to decrease the uncertainties of the parameters of DM haloes I decided to fix the mass-to-light ratios of disc and bulge in narrow ranges based on the population synthesis modelling and the observed colour indices. I used M/L–colour relations from McGaugh & Schombert (2014) for different stellar initial mass functions to get the lower and upper limits of mass-to-light ratio.
For several galaxies I got the infinite contours of 1σ confidence levels on the χ2 map. It means that it is impossible to obtain the trustworthy estimates of the central density and radial scale of the dark halo due to the degeneracy between these parameters; however the estimate of halo mass inside of optical radius is almost not affected by the degeneracy (see Saburova et al. 2016). In Figs 10 and 11 I show the examples of the χ2 maps for UGC04277 (closed 1σ contours) and ESO 240-011 (infinite contours of 1σ), respectively. Left panels correspond to the models with the piso profiles of the dark halo, centre panels – to the Burkert profiles and right panels – to the NFW profiles. The colour on the maps denotes the χ2 value; the darker the colour, the lower the χ2 and the better is the fit. The black contours refer to 1σ, 2σ and 3σ confidence limits. The lower row for each example gives the best-fitting decomposition corresponding to the χ2 minimum, where the black symbols mark the observed rotation curve, thick red line the total model, cyan line dark halo, blue line stellar disc, magenta line gas disc and green line bulge. In Tables 3 –5 I give the resulting parameters corresponding to the minimal values of χ2 for each type of DM density profile together with the errors associated with the range covered by 1σ confidence limit (each pair of the parameters of DM halo on the map corresponds to the certain values of χ2, disc mass-to-light ratio and bulge central surface density.). I discuss the results for each galaxy below.
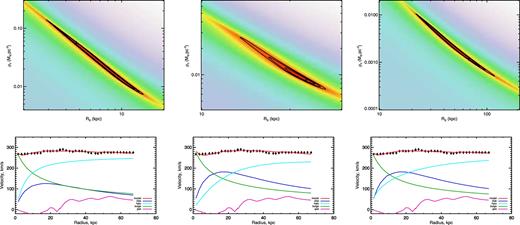
The χ2 maps and rotation curve models for UGC4277. Left panels correspond to the models with the piso profiles of the dark halo, centre panels to the Burkert profiles and right panels to the NFW profiles. The colour on the maps denotes the χ2 value; the darker the colour, the lower the χ2 and the better is the fit. The black contours refer to 1σ, 2σ and 3σ confidence limits. The cross shows the position of the χ2 minimum. The lower row gives the best-fitting decomposition corresponding to the χ2 minimum, where the black symbols mark the observed rotation curve, thick red line the total model, cyan line dark halo, blue line stellar disc, magenta line gas disc and green line bulge.
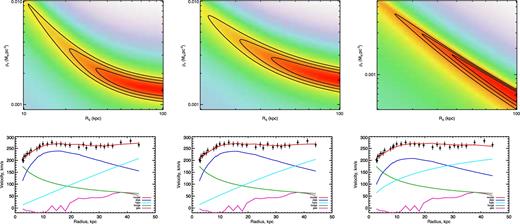
The χ2 maps and rotation curve models for ESO240-11. Left panels correspond to the models with the piso profiles of the dark halo, centre panels to the Burkert profiles and right panels to the NFW profiles. The colour on the maps denotes the χ2 value; the darker the colour, the lower the χ2 and the better is the fit. The black contours refer to 1σ, 2σ and 3σ confidence limits. The cross shows the position of the χ2 minimum. The lower row gives the best-fitting decomposition corresponding to the χ2 minimum, where the black symbols mark the observed rotation curve, thick red line the total model, cyan line dark halo, blue line stellar disc, magenta line gas disc and green line bulge.
The obtained parameters of the main components of the galaxies for Burkert dark halo density profile. The errors correspond to 1σ confidence limit. For galaxies with infinite 1σ contour (see the discussion in Section 4.1) I put 0.00 as error. The columns contain the following data: (1) galaxy name; (2) and (3) radial scale and central density of the DM halo; (4) optical radius (four disc scalelengths); (5) mass of DM halo inside of optical radius; (6) mass-to-light ratio, the band is noted in Section 4.1 for each galaxy; (7) central surface density of bulge.
| Galaxy | Rs | ρ0 | Ropt | Mhalo | M/L | (I0)b |
|---|---|---|---|---|---|---|
| kpc | 10−3 M⊙/pc−3 | kpc | 1010 M⊙ | M⊙/L⊙ | 103 M⊙/pc−2 | |
| ESO030-009 | 200.00|$^{+ 0.00}_{- 0.00}$| | 0.50|$^{+ 0.00}_{- 0.00}$| | 51.78 | 23.25|$^{+ 1.56}_{- 1.69}$| | 2.54 | 1.80 |
| ESO184-051 | 5.44|$^{+ 2.38}_{- 1.17}$| | 130.29|$^{+ 95.87}_{- 100.77}$| | 34.05 | 31.89|$^{+ 7.06}_{- 20.61}$| | 0.23 | 3.22 |
| ESO240-011 | 100.00|$^{+ 0.00}_{- 0.00}$| | 1.72|$^{+ 0.00}_{- 0.00}$| | 27.47 | 11.86|$^{+ 2.79}_{- 1.50}$| | 1.58 | 864.30 |
| ESO382-058 | 9.13|$^{+ 5.16}_{- 2.33}$| | 57.84|$^{+ 44.94}_{- 37.17}$| | 38.64 | 49.37|$^{+ 7.76}_{- 15.12}$| | 1.90 | 29.21 |
| ESO460-031 | 100.00|$^{+ 0.00}_{- 0.00}$| | 1.21|$^{+ 0.00}_{- 0.00}$| | 42.32 | 26.44|$^{+ 10.05}_{- 12.82}$| | 1.68 | 1.49 |
| ESO471-002 | 200.00|$^{+ 0.00}_{- 0.00}$| | 0.97|$^{+ 0.00}_{- 0.00}$| | 29.52 | 9.32|$^{+ 7.95}_{- 8.69}$| | 1.95 | 2.78 |
| ESO563-021 | 20.33|$^{+ 6.48}_{- 3.56}$| | 12.57|$^{+ 5.11}_{- 5.13}$| | 34.10 | 41.18|$^{+ 2.57}_{- 5.76}$| | 1.46 | 1.12 |
| IC0724 | 700.00|$^{+ 0.00}_{- 0.00}$| | 0.97|$^{+ 0.00}_{- 0.00}$| | 45.76 | 37.16|$^{+ 0.69}_{- 0.68}$| | 0.48 | 36.72 |
| IC1862 | 700.00|$^{+ 0.00}_{- 0.00}$| | 0.83|$^{+ 0.00}_{- 0.00}$| | 29.56 | 8.65|$^{+ 5.07}_{- 4.96}$| | 1.19 | 0.76 |
| IC2531 | 93.72|$^{+ 134.96}_{- 22.74}$| | 1.19|$^{+ 0.17}_{- 0.29}$| | 34.93 | 15.36|$^{+ 0.45}_{- 1.23}$| | 0.64 | 1705.76 |
| NGC 0973 | 200.00|$^{+ 0.00}_{- 0.00}$| | 0.63|$^{+ 0.00}_{- 0.00}$| | 44.35 | 19.24|$^{+ 2.03}_{- 3.68}$| | 0.71 | 3419.67 |
| NGC 4705 | 35.11|$^{+ 46.00}_{- 12.01}$| | 2.04|$^{+ 1.12}_{- 0.88}$| | 35.44 | 14.33|$^{+ 3.14}_{- 2.97}$| | 1.00 | 3.57 |
| NGC 5529 | 58.21|$^{+ 16.07}_{- 8.98}$| | 2.13|$^{+ 0.45}_{- 0.45}$| | 28.76 | 13.69|$^{+ 1.44}_{- 1.72}$| | 0.49 | 436.10 |
| NGC 7184 | 20.16|$^{+ 0.00}_{- 0.00}$| | 12.32|$^{+ 0.00}_{- 0.00}$| | 27.14 | 27.75|$^{+ 22.56}_{- 10.95}$| | 1.29 | 2.51 |
| PGC006966 | 24.89|$^{+ 15.29}_{- 7.17}$| | 12.49|$^{+ 5.98}_{- 4.34}$| | 28.25 | 39.14|$^{+ 6.83}_{- 6.25}$| | 1.00 | 0.00 |
| UGC02885 | 39.03|$^{+ 15.41}_{- 9.30}$| | 3.78|$^{+ 2.00}_{- 1.22}$| | 41.53 | 40.54|$^{+ 4.36}_{- 3.87}$| | 0.60 | 22.15 |
| UGC04277 | 22.02|$^{+ 2.03}_{- 2.63}$| | 9.21|$^{+ 2.72}_{- 1.35}$| | 32.12 | 30.88|$^{+ 2.50}_{- 1.22}$| | 0.80 | 1256.11 |
| UGC05341 | 26.19|$^{+ 5.21}_{- 2.44}$| | 11.56|$^{+ 1.66}_{- 2.73}$| | 35.28 | 57.18|$^{+ 2.11}_{- 3.58}$| | 0.37 | 0.00 |
The obtained parameters of the main components of the galaxies for piso dark halo density profile. The errors correspond to 1σ confidence limit. For galaxies with infinite 1σ contour (see the discussion in Sect.4.1) I put 0.00 as error. The columns contain the following data: (1) galaxy name; (2) and (3) radial scale and central density of the DM halo; (4) optical radius (four disc scalelengths); (5) mass of DM halo inside of optical radius; (6) disc mass-to-light ratio, the band is noted in Section 4.1 for each galaxy; (7) central surface density of bulge.
| Galaxy | Rs | ρ0 | Ropt | Mhalo | M/L | (I0)b |
|---|---|---|---|---|---|---|
| kpc | 10−3 M⊙/pc−3 | kpc | 1010 M⊙ | M⊙/L⊙ | 103 M⊙/pc−2 | |
| ESO030-009 | 200.00|$^{+ 0.00}_{- 0.00}$| | 0.44|$^{+ 0.00}_{- 0.00}$| | 51.78 | 24.32|$^{+ 1.83}_{- 1.59}$| | 2.55 | 1.80 |
| ESO184-051 | 2.48|$^{+ 2.37}_{- 1.35}$| | 75.85|$^{+ 258.59}_{- 52.29}$| | 34.05 | 17.80|$^{+ 18.93}_{- 3.85}$| | 1.00 | 3.22 |
| ESO240-011 | 100.00|$^{+ 0.00}_{- 0.00}$| | 1.39|$^{+ 0.00}_{- 0.00}$| | 27.47 | 11.56|$^{+ 2.79}_{- 1.46}$| | 1.59 | 856.21 |
| ESO382-058 | 4.51|$^{+ 3.97}_{- 1.69}$| | 65.92|$^{+ 82.68}_{- 46.76}$| | 38.64 | 54.12|$^{+ 8.15}_{- 16.64}$| | 1.90 | 29.21 |
| ESO460-031 | 100.00|$^{+ 0.00}_{- 0.00}$| | 1.00|$^{+ 0.00}_{- 0.00}$| | 42.32 | 28.64|$^{+ 11.41}_{- 14.24}$| | 1.68 | 1.49 |
| ESO471-002 | 200.00|$^{+ 0.00}_{- 0.00}$| | 0.88|$^{+ 0.00}_{- 0.00}$| | 29.52 | 9.37|$^{+ 8.18}_{- 8.70}$| | 1.97 | 2.74 |
| ESO563-021 | 10.92|$^{+ 4.19}_{- 2.52}$| | 13.46|$^{+ 7.04}_{- 5.84}$| | 34.10 | 41.00|$^{+ 2.16}_{- 5.15}$| | 1.46 | 1.12 |
| IC0724 | 700.00|$^{+ 0.00}_{- 0.00}$| | 0.97|$^{+ 0.00}_{- 0.00}$| | 45.76 | 38.73|$^{+ 0.73}_{- 0.76}$| | 0.48 | 36.72 |
| IC1862 | 3.76|$^{+ 0.00}_{- 0.00}$| | 22.35|$^{+ 0.00}_{- 0.00}$| | 29.56 | 9.56|$^{+ 4.21}_{- 5.40}$| | 0.94 | 0.76 |
| IC2531 | 58.84|$^{+ 39.91}_{- 14.30}$| | 1.05|$^{+ 0.16}_{- 0.18}$| | 34.93 | 15.50|$^{+ 0.66}_{- 1.08}$| | 0.64 | 1725.73 |
| NGC 0973 | 100.00|$^{+ 0.00}_{- 0.00}$| | 0.59|$^{+ 0.00}_{- 0.00}$| | 44.35 | 19.30|$^{+ 2.36}_{- 3.38}$| | 0.71 | 3415.19 |
| NGC 4705 | 23.10|$^{+ 26.67}_{- 8.93}$| | 1.78|$^{+ 1.04}_{- 0.72}$| | 35.44 | 14.93|$^{+ 2.73}_{- 3.05}$| | 1.00 | 3.57 |
| NGC 5529 | 37.52|$^{+ 11.54}_{- 6.62}$| | 1.87|$^{+ 0.41}_{- 0.43}$| | 28.76 | 13.95|$^{+ 1.44}_{- 2.00}$| | 0.49 | 441.16 |
| NGC 7184 | 12.35|$^{+ 0.00}_{- 0.00}$| | 11.38|$^{+ 0.00}_{- 0.00}$| | 27.14 | 28.37|$^{+ 22.24}_{- 10.87}$| | 1.29 | 2.51 |
| PGC006966 | 15.65|$^{+ 8.48}_{- 4.16}$| | 11.04|$^{+ 5.06}_{- 3.73}$| | 28.25 | 39.33|$^{+ 7.25}_{- 5.02}$| | 1.00 | 0.00 |
| UGC02885 | 22.57|$^{+ 8.69}_{- 20.98}$| | 3.66|$^{+ 383.72}_{- 1.19}$| | 41.53 | 40.51|$^{+ 10.92}_{- 2.72}$| | 0.60 | 22.15 |
| UGC04277 | 4.93|$^{+ 7.37}_{- 1.24}$| | 51.75|$^{+ 37.27}_{- 42.63}$| | 32.12 | 39.72|$^{+ 1.64}_{- 10.04}$| | 0.40 | 1197.98 |
| UGC05341 | 16.22|$^{+ 3.68}_{- 1.85}$| | 10.46|$^{+ 1.72}_{- 2.64}$| | 35.28 | 58.02|$^{+ 2.48}_{- 3.51}$| | 0.37 | 0.00 |
The obtained parameters of the main components of the galaxies for NFW dark halo density profile. The errors correspond to 1σ confidence limit. For galaxies with infinite 1σ contour (see the discussion in Section 4.1) I put 0.00 as error. The columns contain the following data: (1) galaxy name; (2) and (3) radial scale and central density of the DM halo; (4) optical radius (four disc scalelengths); (5) mass of DM halo inside of optical radius; (6) disc mass-to-light ratio, the band is noted in Section 4.1 for each galaxy; (7) central surface density of bulge.
| Galaxy | Rs | ρ0 | Ropt | Mhalo | M/L | (I0)b |
|---|---|---|---|---|---|---|
| kpc | 10−3 M⊙/pc−3 | kpc | 1010 M⊙ | M⊙/L⊙ | 103 M⊙/pc−2 | |
| ESO030-009 | 200.00|$^{+ 0.00}_{- 0.00}$| | 0.09|$^{+ 0.00}_{- 0.00}$| | 51.78 | 22.15|$^{+ 2.06}_{- 2.15}$| | 2.39 | 1.80 |
| ESO184-051 | 13.77|$^{+ 24.29}_{- 7.60}$| | 9.75|$^{+ 34.41}_{- 7.98}$| | 34.05 | 17.03|$^{+ 11.77}_{- 4.71}$| | 1.00 | 3.22 |
| ESO240-011 | 100.00|$^{+ 0.00}_{- 0.00}$| | 0.58|$^{+ 0.00}_{- 0.00}$| | 27.47 | 19.69|$^{+ 1.91}_{- 3.13}$| | 1.21 | 862.62 |
| ESO382-058 | 41.68|$^{+ 197.22}_{- 24.27}$| | 2.97|$^{+ 12.20}_{- 2.68}$| | 38.64 | 47.18|$^{+ 13.51}_{- 10.14}$| | 2.45 | 29.21 |
| ESO460-031 | 100.00|$^{+ 0.00}_{- 0.00}$| | 0.22|$^{+ 0.00}_{- 0.00}$| | 42.32 | 15.59|$^{+ 6.78}_{- 9.05}$| | 1.68 | 1.49 |
| ESO471-002 | 200.00|$^{+ 0.00}_{- 0.00}$| | 0.11|$^{+ 0.00}_{- 0.00}$| | 29.52 | 9.85|$^{+ 4.50}_{- 9.31}$| | 1.80 | 2.56 |
| ESO563-021 | 228.06|$^{+ 0.00}_{- 0.00}$| | 0.24|$^{+ 0.00}_{- 0.00}$| | 34.10 | 33.74|$^{+ 6.15}_{- 4.38}$| | 1.63 | 1.12 |
| IC0724 | 700.00|$^{+ 0.00}_{- 0.00}$| | 0.02|$^{+ 0.00}_{- 0.00}$| | 45.76 | 18.62|$^{+ 0.42}_{- 0.41}$| | 0.48 | 36.72 |
| IC1862 | 700.00|$^{+ 0.00}_{- 0.00}$| | 0.03|$^{+ 0.00}_{- 0.00}$| | 29.56 | 9.23|$^{+ 5.34}_{- 5.97}$| | 1.07 | 0.76 |
| IC2531 | 700.00|$^{+ 0.00}_{- 0.00}$| | 0.03|$^{+ 0.00}_{- 0.00}$| | 34.93 | 15.53|$^{+ 0.13}_{- 0.14}$| | 0.64 | 1602.52 |
| NGC 0973 | 685.65|$^{+ 0.00}_{- 0.00}$| | 0.02|$^{+ 0.00}_{- 0.00}$| | 44.35 | 17.99|$^{+ 1.47}_{- 1.60}$| | 0.70 | 3228.44 |
| NGC 4705 | 200.00|$^{+ 0.00}_{- 0.00}$| | 0.09|$^{+ 0.00}_{- 0.00}$| | 35.44 | 11.81|$^{+ 1.61}_{- 1.53}$| | 1.00 | 3.57 |
| NGC 5529 | 700.00|$^{+ 0.00}_{- 0.00}$| | 0.05|$^{+ 0.00}_{- 0.00}$| | 28.76 | 16.33|$^{+ 0.63}_{- 0.59}$| | 0.49 | 393.30 |
| NGC 7184 | 200.00|$^{+ 0.00}_{- 0.00}$| | 0.33|$^{+ 0.00}_{- 0.00}$| | 27.14 | 26.02|$^{+ 4.58}_{- 9.00}$| | 1.29 | 2.51 |
| PGC006966 | 100.00|$^{+ 0.00}_{- 0.00}$| | 0.91|$^{+ 0.00}_{- 0.00}$| | 28.25 | 32.58|$^{+ 3.77}_{- 3.61}$| | 1.00 | 0.00 |
| UGC02885 | 442.79|$^{+ 0.00}_{- 0.00}$| | 0.09|$^{+ 0.00}_{- 0.00}$| | 41.53 | 39.68|$^{+ 10.26}_{- 3.28}$| | 0.60 | 22.15 |
| UGC04277 | 68.68|$^{+ 17.40}_{- 43.25}$| | 1.16|$^{+ 6.72}_{- 0.34}$| | 32.12 | 30.65|$^{+ 11.46}_{- 0.97}$| | 0.80 | 1148.61 |
| UGC05341 | 100.00|$^{+ 0.00}_{- 0.00}$| | 0.99|$^{+ 0.00}_{- 0.00}$| | 35.28 | 51.71|$^{+ 0.55}_{- 1.61}$| | 0.37 | 0.00 |
4.1 Notes on individual galaxies
ESO030-009 is a spiral galaxy for which no H i data were available in literature. The disc and bulge I-band mass-to-light ratios were fixed in a range 1.95–2.82 according to model M/L–colour relations and the B − V colour inside of effective radius taken from Hyperleda data base and corrected for extinction in Galaxy. The resulting model of the rotation curve has maximum possible contribution of the disc. All halo density profiles give the infinite contours of 1σ confidence levels on the χ2 map.
ESO184-051 is barred spiral giant galaxy without available H i radial density profile. For this case I first used I-band mass-to-light ratios in a range 1.79–2.46 according to observed effective B − V colour index. However, this range led to the model of rotation curve with zero contribution of the DM halo. Such a model seems to be not very realistic, as baryonic contribution usually fails to reproduce the flat rotation curve outside of the optical radius (the region not covered by observations of this galaxy). Thus I decided to decrease the values of possible mass-to-light ratios and had more reasonable contributions of dark and baryonic matter to the total mass of the galaxy without the infinite contours of 1σ confidence levels on the χ2 map.
ESO240-011 is spiral galaxy seen edge-on. For this system both optical and H i kinematics are available together with the stellar kinematics. The rotation curve is very uncertain in the innermost part (see fig. A1 in Kregel & van der Kruit 2004), thus I used the rotation velocity data for the radii R > 15 arcsec. The estimates of the stellar velocity dispersion at two disc radial scalelengths enabled Zasov, Khoperskov & Saburova (2011) to obtain the surface density of the stellar disc using the marginal gravitational stability criterion. This estimate corresponds to the disc I-band mass-to-light ratio 1.59. I took this value as the upper limit of disc M/L. The lower limit is 1.19 according to the observed colour index of the galaxy. The disc mass-to-light ratio estimated using gravitational stability criterion appears to be in good agreement with observed rotation curve. It indicates the absence of strong dynamical overheating of the disc of ESO240-011. I show the model of the rotation curve of ESO240-011 and the χ2 map in Fig. 11. One can see that despite the fact that the model of the rotation curve of ESO240-011 looks quite reasonable, the degeneracy of the central density and the radial scale of the halo do not allow a reliable estimate of the dark halo parameters.
ESO382-058 is a giant spiral galaxy with a bar and a ring without available H i radial distribution. The observed effective B − V colour index corresponds to the range of M/LI: 1.9–2.47. The resulting model is in satisfactory agreement with observations and χ2 shows finite contours of 1σ confidence levels for all considered dark halo density profiles.
ESO460-031 is an edge-on spiral galaxy without available H i radial distribution. The observed effective B − V colour index corresponds to the range of M/LI: 1.68–2.22. The resulting model is in satisfactory agreement with observations; however χ2 demonstrates infinite contours of 1σ confidence levels for all considered dark halo density profiles.
ESO471-002 is a giant spiral galaxy without available H i radial distribution. The observed effective B − V colour index corresponds to the range of M/LI: 1.8–2.46. The resulting model is in satisfactory agreement with observations; however infinite contours of 1σ confidence levels on the χ2 maps for all considered halo density profiles do not allow me to reliably estimate the parameters of the dark halo.
ESO563-021 is a spiral giant galaxy also presented in the sample of Courtois et al. (2015). Its stellar mass-to-light ratio was fixed in the range 1.46–1.74 according to its B − V colour inside of effective radius. The model of the rotation curve is in satisfactory agreement with observational data and the contours of 1σ confidence levels are finite for all considered dark halo density profiles except NFW.
IC0724 is an Sa-type galaxy with no available H i radial distribution. The radial profile of stellar velocity dispersion obtained by Corsini et al. (1999) allows us to estimate independently the upper limit of the disc surface density using marginal gravitational stability criterion (see Zasov et al. 2011). The disc K-band mass-to-light ratio related to this estimate lies in the range 0.48–1.22 (corresponding to the errors of the observational data). These values are very close to that following from the stellar population synthesis models indicating that the disc of IC0724 is not dynamically overheated. The models of Bell & de Jong (2001) give M/LK of stellar population that lies in the range 0.4–0.8. McGaugh & Schombert (2014) give M/LK = 0.6, very slightly varying with the colour index. For the disc of IC0724 I utilized the range of mass-to-light ratios determined by marginal gravitational stability criterion and for the bulge I decided to use the range of M/LK: 0.6–0.8. The resulting model of the rotation curves is a model with maximal contribution of the baryonic matter, and the contours of 1σ confidence levels are infinite for all considered profiles of dark halo.
IC1862 is an edge-on spiral galaxy without available information on the radial distribution of H i surface density. The mass-to-light ratio in the I band according to the effective B − V colour lies in the range 1.88–2.64. However, these values led to the overprediction of the rotational velocity amplitude. So I had to decrease the lower limit of mass-to-light ratio by two times in order to get reasonable model of the rotation curve. The χ2 map has infinite contours of 1σ confidence levels for all considered density profiles of dark halo.
IC2531 is another edge-on late-type spiral galaxy. Zasov et al. (2011) estimated the upper limit of the stellar disc surface density of this galaxy using the marginal gravitational stability criterion. After correction for the adopted distance it leads to the following value of V-band disc mass-to-light ratio: M/LV = 0.64. It appears to be lower than follows from the observed colour index, 1.06–1.43, giving evidence in favour of the absence of significant major merging events, which could heat dynamically the inner parts of disc. For the disc of IC2531 I fixed mass-to-light ratios in the interval 0.64–1.43. For the bulge I utilized the values following from the colour index. The resulting model is in good agreement with the observed rotation curve. The χ2 map has finite 1σ contours for all considered dark halo density distributions except NFW.
NGC 0973 is a giant spiral galaxy seen edge-on. The photometrically determined contribution of stars to the rotation curve significantly overpredicts the rotation velocity amplitude, thus for this galaxy I decided to use mass-to-light ratios of disc and bulge as free parameters. The resulting best-fitting model is in good agreement with observations but the 1σ contours are infinite for the χ2 maps plotted for all considered dark halo density distributions.
NGC 4705 is a barred spiral galaxy with a ring and no available data on the H i surface density distribution. The effective B − V colour corresponds to the I-band mass-to-light ratio range of 1.8–2.46. However, these values for the disc led to the overprediction of the observed rotation curve. Thus, I had to decrease the lower limit of the disc mass-to-light ratio to 1. The resulting model gave a satisfactory fit to the observed rotation curve and the 1σ contours are finite for piso and Burkert dark halo density distributions.
NGC 5529 is a barred spiral galaxy. For NGC 5529 I found both optical and H i kinematical data. The Hα kinematical data from Kregel & van der Kruit (2004) are in contradiction with the H i data from Allaert et al. (2015) in the inner part of the galaxy, making the rotation curve uncertain in the inner region. So I decided to remove the innermost points (R < 4 kpc) from consideration. The stellar velocity dispersion data enabled Zasov et al. (2011) to estimate the upper limit of the disc surface density related to its marginal gravitational stability at 2 disc radial scalelengths. This estimate corresponds to the disc V-band mass-to-light ratio M/LV = 0.54 which is lower than that calculated from the observed colour index, according to the equations from McGaugh & Schombert (2014): 1.31–1.66. It can indicate the absence of dynamical overheating of the disc of NGC 5529. However, the stellar mass-to-light ratios obtained from both gravitational stability criterion and observed colour index for the disc and using only photometry for the bulge together with the surface photometry from Xilouris et al. (1999) give overpredicted value of the rotational velocity. Thus I had to decrease the lower limit of mass-to-light ratio by 10 per cent for the disc and by 1.5 times for the bulge. After this reduction I got the reasonable fit of the rotation curve and the finite 1σ contours on the χ2 maps for piso and Burkert dark haloes.
NGC 7184 is a barred giant spiral galaxy with a ring and no available H i data. The observed total colour index corresponds to the I-band mass-to-light ratio in the range 1.29–1.43. The resulting fit of the rotation curve is in satisfactory agreement with observed data; however the 1σ contours on the χ2 maps are infinite for all considered density profiles of dark halo.
PGC006966 is an Sc-type edge-on giant galaxy without available radial profile of H i surface density. The effective B − V colour refers to the I-band mass-to-light ratio range: 1.8–2.46. However, the rotation velocity increases very slowly in the central part leaving almost no room for the bulge. So, I had to reduce the lower limit of mass-to-light ratio of the disc to 1 and set the bulge contribution to zero which could be reasonable due to the low contribution of the bulge to the total luminosity. The resulting fit of the rotation curve is in satisfactory agreement with observations but not for NFW density profile. The 1σ contour for the χ2 map plotted for NFW halo is also infinite.
UGC02885 is a giant Sc galaxy. It is also present in the sample of Courtois et al. (2015). The parameters of piso dark halo agree with that from de Blok & McGaugh (1997) within error bars. The 3.6 μm mass-to-light ratios of disc and bulge were taken to lie between 0.45 (obtained using the Tully–Fisher relation in a good agreement with the models of stellar population by McGaugh & Schombert 2015) and 0.6 (Meidt et al. 2014) solar units. The model rotation curve is in reasonable agreement with observations. The 1σ contours for the χ2 maps are finite for piso and Burkert haloes.
UGC04277 is an Sc-type edge-on giant galaxy. The K-band disc mass-to-light ratio is set within the range 0.37–0.8 solar units (according to Bell & de Jong 2001). Due to the lack of photometrical data, the budge central density, effective radius and Sérsic index are considered as free parameters.5 The model rotation curves and χ2 maps for this galaxy are demonstrated in Fig. 10. One can see that the model rotation curve is in good agreement with observed one and 1σ confidence limit contours for the χ2 maps are finite for all dark halo profiles.
UGC05341 is an Sc-type edge-on giant galaxy without available H i surface density radial distribution. The K-band disc mass-to-light ratio is set within the range 0.37–0.8 solar units (according to Bell & de Jong 2001). The slowly rising rotation curve in the inner part of the galaxy does not leave room for a bulge, so I neglected its contribution to the total mass. The resulting model rotation curve is in reasonable agreement with observations for piso and Burkert dark halo. The 1σ contours for the χ2 maps are also finite for these halo profiles.
One can see that for six galaxies from the sample I had to decrease the lower limit of the disc mass-to-light ratio due to the fact that photometrically determined disc surface density leaves no room for DM halo or even corresponds to the model rotation velocity amplitude which is higher than the observed one. Unfortunately, this situation can occur even for well-studied nearby galaxies (see e.g. the discussion of this problem in Saburova et al. 2016). I compared these six systems with the contradiction between photometrical and dynamical estimates of the disc surface density and found out that three of them are classified in Hyperleda data base as barred galaxies (in total I have only five objects with such classification in my sample and three of them are among the galaxies with super-maximal discs.). The remaining three super-maximal disc galaxies are seen edge-on so their classification could be difficult, but I inspected their images and found boxy-shaped bulges in two of them which can speak in favour that they are also barred (see e.g. Chung & Bureau 2004). Thus, the most probable reason of the discrepancy between dynamical and photometrical disc mass estimates is the presence of the bar which can lead to lower rotation velocity (see e.g. Saburova et al. 2017). Another item that is related to this problem is to what extent the model dark halo parameters are sensitive to the disc mass. Partially, this problem is discussed in Saburova et al. (2016) where we considered both best-fitting modelling of the rotation curve when the surface densities of disc and bulge were considered as free parameters and the photometrical approach when the baryonic densities were fixed in the narrow ranges. According to Saburova et al. (2016) the dark halo mass is the most stable parameter which is less affected by the choice of the model. Since some of my conclusions are based on the dark halo parameters I also tested how they change with the decrease of the disc surface density on the example of NGC 4705 for Burkert profile. As it is expected, when I decrease the disc surface density the halo parameters are also changing in order to eliminate the increasing difference between the model and observed rotation curve in the region of the high contribution of the disc. The dark halo radial scale becomes lower and its central density increases, and the mass of the dark halo also rises. In agreement with Saburova et al. (2016), the dark halo mass is the most stable parameter. It changes by 7 per cent when the disc density decreases by 10 per cent. Even when I decrease the disc density by 55 per cent, it increases by roughly 30 per cent. The radial scale of the halo is less stable – it changes up to 20 per cent when the disc density is lowered by 10 per cent. If I decrease the disc density by 55 per cent the dark halo radial scale changes by roughly 50 per cent. The most unstable parameter is the central density of the halo which changes by almost four times in response to the variation of the disc density by 55 per cent. However even the most extremal changes of the parameters of DM halo due to the variation of the disc density lie in the range of the dispersion of points on the diagrams (see below) and the uncertainty of the parameters of dark halo is borne in mind.
5 DISCUSSION
As it is evident from the details given above, the modelling of rotation curves of giant discy galaxies using NFW dark halo often leads to the infinite 1σ confidence limit contours for the χ2 maps. It means that it is not possible to get reliable estimate of dark halo central density and radial scale for NFW profile based on the available data. Thus, I decided to eliminate the NFW parameters from further consideration. I cannot exclude the possibility that NFW profile fails more often in comparison to other profiles to reproduce the rotation curves of giant galaxies due to e.g. the observed slow rise of the velocity, but more accurate data are needed especially in the central regions to confirm or disprove this possibility. This will be a part of my future work.
Kasparova et al. (2014) proposed that the giant LSB galaxy Malin2 could have such a large disc due to the peculiar properties of its host DM halo, which has high radial scalelength. I decided to find out if the DM haloes of giant discy galaxies of my sample differ from that of the systems with more moderate sizes. One should remember, however, that the dark halo central density and radial scale are known to be very uncertain due to the degeneracy between these parameters (see Saburova et al. 2016). I partly solve this problem by fixation of the baryonic densities in the narrow ranges and by considering the χ2 map for the dark halo parameters. However, these parameters still should be considered with great caution. Saburova et al. (2016) showed that the dark halo mass within optical border is a much more reliable parameter, so I also discuss the dark halo masses of giant discy galaxies.
In Figs 12 –14, I plot the dark halo central densities, radial scales and masses within optical borders against the disc sizes. Squares show the compilation of literature data on the dark halo parameters from Saburova & Del Popolo (2014), which also contains three giant LSB galaxies Malin1, Malin2 and NGC 7589 for piso dark halo. Diamonds demonstrate the data from the current paper. For the current paper I plotted the four disc scalelengths as disc radius. For data from Saburova & Del Popolo (2014) I considered the radius of 25th B-band isophote as the size of the disc for all galaxies except LSBs for which I also took four disc scalelengths. Left panels correspond to piso halo, and right ones are for Burkert halo. The error bars for the sample of giant galaxies are associated with the range covered by 1σ confidence limit. The lines show linear fit to the data. I did not use giant galaxies with infinite 1σ contours in the fitting; they are also absent in Figs 12–14.
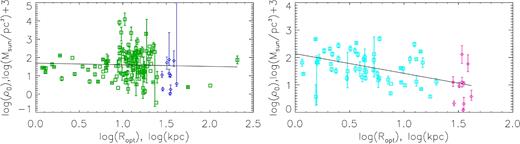
The comparison of central density of the halo with the optical radius for the current sample of giant spirals (diamonds) and the sample from Saburova & Del Popolo (2014) (squares). The left hand panel corresponds to piso dark halo, the right one to Burkert halo. The error bars for the sample of giant galaxies are associated with the range covered by 1σ confidence limit. The line shows the linear fit to the data.
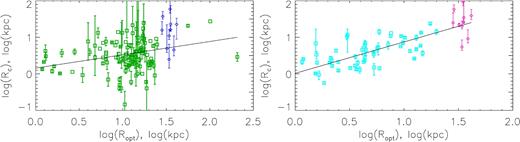
The comparison of radial scalelength of the halo with the optical radius for the current sample of giant spirals (diamonds) and the sample from Saburova & Del Popolo (2014) (squares). The left hand panel corresponds to piso dark halo and the right one to Burkert halo. The error bars for the sample of giant galaxies are associated with the range covered by 1σ confidence limit. The line shows the linear fit to the data.
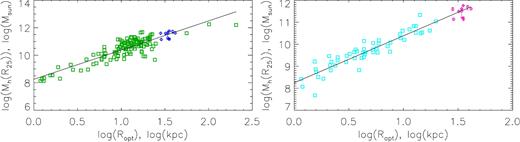
The comparison of the mass of the halo within disc radius with the optical radius for the current sample of giant spirals (diamonds) and the sample from Saburova & Del Popolo (2014) (squares). The left hand panel corresponds to piso dark halo and the right one to Burkert halo. The error bars for the sample of giant galaxies are associated with the range covered by 1σ confidence limit. The line shows the linear fit to the data.
As one can see, there are clear trends of the parameters of Burkert halo with the optical radius. For piso halo, the points have higher spread in comparison to Burkert halo. Partly it can be explained by the fact that for the Burkert halo one can get reliable estimates of the density and radial scale slightly more often than for piso and NFW halo (see Saburova et al. 2016). Bearing in mind the uncertainty of the estimates of density and scale of dark haloes based on the rotation curve decomposition one can still see that the central halo density decreases with the optical radius, and the scalelength increases with it for Burkert profile. I found the following correlations between the parameters: log (ρ0) = −1.14–0.72log (Ropt) (correlation coefficient 0.60); log (Rs) = 0.01 + 0.86log (Ropt) (correlation coefficient 0.83). The relation between the sizes of baryonic and DM structures could possibly be explained by the connection of the specific angular momentum of the galaxies and the host dark haloes (see e.g. Mo, Mao & White 1998). Kravtsov (2013) found approximately linear relation between the radius containing half of stellar mass and the virial radius estimated using abundance matching ansatz. Thus, the almost linear relation between the sizes that I obtained is expected in the models of the formation of the galaxies. Considering the correlation with the central density it may be due to the connection between central density and radial scale of the halo (see e.g. Kormendy & Freeman 2004, Burkert 2015 and discussion in Saburova & Del Popolo 2014 and Saburova et al. 2016).
For the dark halo mass the correlation is more significant and firmly determined in comparison to that with the radial scale and density for both Burkert and piso haloes. I found the following correlation for Burkert halo: log (Mh(Ropt)) = 8.25 + 2.13log (Ropt) (correlation coefficient 0.97) for the piso halo the result is very similar: log (Mh(Ropt)) = 8.25 + 2.12 log (Ropt) (correlation coefficient 0.89). Partially this correlation can be explained by the connection between the halo and stellar mass which could follow e.g. from the presence of the Tully–Fisher relation (Roberts 1969; Tully & Fisher 1977). The relation between the virial halo mass and the disc mass for a sample of discy galaxies was demonstrated e.g. in Zasov et al. (2017). As far as stellar mass is connected to the size of the disc it is natural to expect that the latter is also related to the halo mass. However, the index of the power of the relation I got in current paper is the same (within the uncertainty) as was found for the fixed stellar mass by Charlton et al. (2017), who considered a relation between the effective radius and the dark halo mass estimated using galaxy–galaxy lensing. Thus, the correlation between the size of the disc and the halo mass could not be fully due to the connection between the masses.
Another important thing is that giant discy galaxies do not deviate significantly from the trends found for galaxies with more moderate sizes. In particular, the giant spiral galaxies of my sample do not tend to have significantly lower halo masses compared to the general trend which could be expected in the formation scenario from the inside out by accretion of cold gas proposed by Ogle et al. (2016).6 It can indicate that the relations could be due to the same physical processes. Thus, e.g. the catastrophic scenarios of the formation of such galaxies can be ruled out since there is no need to introduce catastrophic scenario to explain the parameters of moderate-sized spirals which lie on the same trend. Another indication of the absence of major merger events comes from the marginal gravitational stability of the several giant discs of my sample with available data on the stellar velocity dispersion.
The found relations (especially the ones between the radial scale and the central density with optical size) could speak in favour of the scenario proposed by Kasparova et al. (2014) in which the giant size of the disc is explained by the properties of DM halo, namely the high radial scale of the halo. Another important factor can be the environment in the stage of the formation of giant galaxies – one needs a lot of gas to form the massive HSB discs. This gas could be accreted from the large-scale filaments.
It should be noted, however, that giant galaxies from my sample differ from giant LSBs like Malin2 – they have considerably smaller sizes and higher surface brightness. At the moment, there is a lack of the estimates of dark halo parameters of giant LSBs to understand if they differ significantly from the giant galaxies of my sample. At the moment it seems that the parameters of giant LSBs lie on the same trend as giant HSBs, except the halo mass which seems to be slightly lower than the relation. High-quality data on the rotation velocities in the central parts of giant LSBs will allow us to obtain more reliable estimates of dark halo parameters and to clarify this question.
6 CONCLUSIONS
I selected a sample of giant discy galaxies which have optical radii higher than 30 kpc and are not tightly interacting. I compared the properties of these systems with that of the discy galaxies available in Hyperleda data base. I also choose a subsample of 18 giant HSBs with available rotation curves and surface photometry data. For these objects, I performed the mass-modelling of the rotation curves and constructed the χ2 maps for the parameters of DM haloes. The baryonic densities were fixed in a narrow ranges found from the photometry and stellar kinematical data (when they were available). I came to the following main conclusions.
The rotation velocities, B-band luminosities, H i masses and dynamical mass-to-light ratios of giant discy HSBs appear to be higher than that of the galaxies of moderate sizes. The latter can indicate the higher dark-to-luminous mass ratio. The DM could be either in non-baryonic or baryonic form (e.g. cold gas non-detected by its emission).
The giant discs do not differ in the H i mass to B-band luminosity ratio. It speaks against the difference in star formation efficiency of giant spirals and moderate-sized galaxies.
I found that the rings and bars occur more frequently in giant discy galaxies in comparison to moderate-sized spirals. It can imply that some of these systems are similar to giant ring galaxy UGC7069 studied by Ghosh & Mapelli (2008).
Giant spirals follow the trend |$\log (M_{\rm H\,\scriptscriptstyle I})(R_{25})$| found for normal-sized galaxies. This conclusion together with higher H i masses and velocities of giant spirals can testify against the formation scenario of giant galaxies in which normal-sized galaxy is blown up. In this case one would expect giant galaxies to have similar masses as moderate-sized spirals and to lie below the correlation |$\log (M_{\rm H\,\scriptscriptstyle I})(R_{25})$| which is disproved in the current paper.
It can also give evidence against the peculiarities in the evolution of star formation of giant spirals, e.g. very strong star formation bursts or strangulation.
I found that giant discy galaxies belong to clusters and groups slightly less frequently than normal-sized galaxies. I propose that the most important role in the formation of giant discs is played not by the current environment but that at the beginning of their evolution.
Other specialties of giant discs are their shortage at the distances D < 100 Mpc and their lower mean B-band surface brightnesses of the discs. The latter can indicate that giant discs are more rarified in comparison to typical late-type galaxies.
The dark halo mass and radial scale increase with the radius of the disc. These relations (at least the relation of sizes) are expected in the models of the formation of galaxies (see e.g. Mo et al. 1998). Giant HSBs have higher dark halo radial scales and masses than moderate-sized galaxies, but they do not deviate significantly from the trend of the normal-sized galaxies. It can indicate the absence of catastrophic scenario of the formation of giant galaxies. This conclusion also follows from the marginal gravitational stability of several giant discs with available stellar kinematical data. All these findings support the formation scenario proposed by Kasparova et al. (2014) in which the giant disc is formed due to the rarified dark halo with high radial scalelength.
Acknowledgements
I thank the anonymous referee for valuable comments that helped me in improving the manuscript. I am grateful to Anatoly Zasov for fruitful discussion and his important comments on the manuscript. I thank my family for the support and inspiration.
This work is supported by The Russian Science Foundation (RSCF) grant No. 17-72-20119. I acknowledge the usage of the HyperLeda data base (http://leda.univ-lyon1.fr).
Before the removing of the latest type galaxies from the total sample, giant galaxies tended to have even lower H i mass-to-light ratios in comparison to the entire sample.
Below Rs and ρ0 are different for the various DM density profiles.
The resulting parameters for the bulge: n=4, Re = 2.7 kpc.
One should admit, however, that spiral giant galaxies of my sample have slightly lower luminosities than superluminous spirals, so they could have different origin.
REFERENCES
