


Abstract
We present a timing analysis of two Rossi X-ray Timing Explorer observations of the microquasar GRS 1915+105 during the heartbeat state. The phase–frequency–power maps show that the intermediate-frequency aperiodic X-ray variability weakens as the source softens in the slow rise phase, and when the quasi-periodic oscillation disappears in the rise phase of the pulse of the double-peaked class, its sub-harmonic is still present with a hard phase lag. In the slow rise phase, the energy–frequency–power maps show that most of the aperiodic variability is produced in the corona, and may also induce the aperiodic variability observed at low energies from an accretion disc, which is further supported by the soft phase lag especially in the intermediate-frequency range (with a time delay up to 20 ms). In the rise phase of the pulse, the low-frequency aperiodic variability is enhanced significantly and there is a prominent hard lag (with a time delay up to 50 ms), indicating that the variability is induced by extension of the disc towards small radii as implied by the increase in flux and propagates into the corona. However, during the hard pulse of the double-peaked class, the variability shows no significant lag, which may be attributed to an optically thick corona. These timing results are generally consistent with the spectral results presented by Neilsen, Remillard & Lee which indicated that the slow rise phase corresponds to a local Eddington limit and the rise phase of the pulse corresponds to a radiation pressure instability in the disc.
1 INTRODUCTION
Accretion plays a crucial role in the evolution of black hole binaries (BHBs). Timing analysis is an important tool for studying the accretion flow. The fast Fourier transformation is one of the most popular methods of timing analysis. However, the origins of the X-ray aperiodic variabilities and the low-frequency quasi-periodic oscillations (LFQPOs) in Fourier power density spectra (PDS) from BHB accretion flows remain yet unsolved (e.g. Miller et al. 2014).
GRS 1915+105 is a BHB suitable for studying the X-ray variability. The source has a rapidly spinning black hole (Zhang, Cui & Chen 1997; McClintock et al. 2006; Middleton et al. 2006; Miller et al. 2013) with a mass of ∼12 M⊙, and a K-M III secondary with a mass of ∼0.8 M⊙ (Greiner et al. 2001; Harlaftis & Greiner 2004; Reid et al. 2014). It is ∼10 kpc away from the Earth (e.g. Fender et al. 1999; Zdziarski et al. 2005; Reid et al. 2014), and is considered a microquasar because it shows a relativistic jet whose inclination to the line of sight is ≳60° (Mirabel & Rodríguez 1994; Fender et al. 1999; Reid et al. 2014). GRS 1915+105 has been active for more than 20 years (Castro-Tirado, Brandt & Lund 1992), and is intensively observed with the Rossi X-ray Timing Explorer (RXTE). The various kinds of source variabilities (Belloni et al. 2000; Klein-Wolt et al. 2002; Hannikainen et al. 2005) and the abundance of LFQPOs (e.g. Chen, Swank & Taam 1997; Morgan, Remillard & Greiner 1997; Belloni, Méndez & Sánchez-Fernández 2001; Strohmayer 2001; Belloni et al. 2006; Yan et al. 2013a) displayed in the RXTE data make it a unique source for studying the X-ray variability.
The variabilities of GRS 1915+105 are classified into 14 classes based on the count rate and the colour characteristics of the source (Belloni et al. 2000; Klein-Wolt et al. 2002; Hannikainen et al. 2005). Each class is regarded as transitions among three states, A, B and C. State C is a low-luminosity, spectrally hard state while states A and B are high-luminosity, soft states. The ρ class (heartbeat state) is a peculiar class where the source oscillates quasi-periodically between states B and C. The light curves in the ρ class have one to several peaks per ρ-cycle (e.g. Taam, Chen & Swank 1997; Vilhu & Nevalainen 1998; Belloni et al. 2000; Massaro et al. 2010). We call the ρ class with one peak per cycle the single-peaked ρ class (hereafter called ρ1 class), and the ρ class with two peaks per cycle the double-peaked ρ class (hereafter called ρ2 class).
Neilsen et al. (2011, 2012) carried out a phase-resolved spectral analysis of the RXTE observations 60405-01-02-00 during the ρ2 class and 40703-01-07-00 during the ρ1 class. In order to investigate the origin of the LFQPO, Yan et al. (2013b) performed a phase-resolved timing analysis of the ρ2 class, and showed that the LFQPO was tightly related to the corona. Besides, for one phase interval of the ρ2 class, Yan et al. (2013b) first detected a high-frequency (≳10 Hz) aperiodic variability from the disc through the amplitude-ratio spectrum method.
In this paper, we present the results of the diagram of the power density as a function of Fourier frequency and ρ-cycle phase (phase–frequency–power map), the diagram of the power density as a function of Fourier frequency and photon energy (energy–frequency–power map), and the phase lag as a function of Fourier frequency (phase-lag spectrum) of the ρ1 and ρ2 classes. We use the phase–frequency–power maps to investigate the continuous evolution of the X-ray variability along with the spectral evolution, use the energy–frequency–power maps to visually display the correlation between the X-ray variability and the spectral components, and use the phase-lag spectra to obtain the sequence information of the X-ray variabilities from different spectral components.
In addition to studying the origin of the X-ray variability, we aim to acquire a spectral-timing unified picture of the accretion in the heartbeat state of GRS 1915+105 through a combination analysis of our timing results and the spectral results presented by Neilsen et al. (2011, 2012).
We describe the observations and the data reduction methods in Section 2, present the results in Section 3, show the discussion in Section 4 and list the conclusions in Section 5.
2 OBSERVATIONS AND DATA REDUCTION
Using the phase-folding method of Neilsen et al. (2011), Yan et al. (2013b) performed a phase-resolved timing analysis for the ρ2 class (RXTE observation 60405-01-02-00 on 2001 May 23 at 11:18:42 ut with 13.9 ks exposure time). In this paper with the same method, we carry out a timing analysis for the ρ1 class (RXTE observation 40703-01-07-00 on 1999 February 26 at 07:32:13 ut with 9.9 ks exposure time). We extract two dead-time-corrected and background-subtracted light curves with a time resolution of 1 s from the binned-mode data (B_8ms_16A_0_35_H_4P) in the 1.9–13.0 keV band and the event-mode data (E_16us_16B_36_1s) in the 13.0–60 keV band, respectively, and add them together to obtain a light curve. We apply the barycentre correction to the light curve and then fold it to obtain an average folded light curve. We determine the start time of each cycle by an iterative cross-correlation method (for more details, see Neilsen et al. 2011), and obtain 209 cycles with a mean period of 44.54 s for the ρ1 class. In Yan et al. (2013b), we obtained 257 cycles with a mean period of 50.29 s for the ρ2 class. We average the PDS from a certain phase interval of all cycles for each class to study the timing properties of the ρ oscillation, since the shape difference of the individual cycles is always less than 20 per cent for a given phase interval.
We calculate the PDS in different energy bands from the binned and event files using 2 s segments at a time resolution of 8 ms, and subtract the dead-time-corrected Poisson noise (Morgan et al. 1997) from each PDS and normalize them to units of (rms/mean)2/Hz (e.g. Miyamoto et al. 1992). We then fit the PDS with a model including several Lorentzians to represent the broad-band noise and the LFQPOs (Nowak 2000; Belloni, Psaltis & van der Klis 2002). We calculate the PDS in the 1.9–60 keV band for each 0.04 phase interval of the ρ1 class, and calculate the PDS in the 2.1–60 keV band for each 0.02 phase interval of the ρ2 class. We then use these PDS to produce the phase–frequency–power maps for the ρ1 and ρ2 classes. We compute the significance of the QPOs with the method adopted by Strohmayer & Watts (2005). The 3.9 Hz QPO in the phase 0.84–0.86 of the ρ2 class has the minimum significance of 0.0017 among all of the QPOs studied.
We produce the PDS in different energy bands for phases I (0.00–0.08), II (0.08–0.26), III (0.26–0.40), IV (0.40–0.60) and V (0.60–1.00) of the ρ1 class, and for phases i (0.02–0.12), ii (0.12–0.26), iii (0.26–0.40), iv (0.40–0.74), v (0.74–0.92) and vi (0.92–0.02) of the ρ2 class, and use these PDS to produce the energy–frequency–power maps. We correct these PDS for background due to the energy dependence of the background (Berger & van der Klis 1994; Rodriguez & Varnière 2011).
For these phases, we calculate the Fourier cross-power spectra of two light curves extracted in different energy bands following Nowak et al. (1999) to obtain the phase-lag spectra. For the ρ1 class, a positive phase lag denotes that the variability in the 5.1–38.4 keV band lags that in the 1.9–5.1 keV band. For the ρ2 class, a positive phase lag denotes that the variability in the 4.9–37.8 keV band lags that in the 2.1–4.9 keV band. The reference bands for the phase-lag calculations for the two classes cannot be the same due to that they were observed in different gain epochs while archived with the same binning modes. All error bars in this paper correspond to the 1σ confidence level.
3 RESULTS
We present in this section the phase–frequency–power maps, the energy–frequency–power maps, and the phase-lag spectra of the ρ1 and ρ2 classes. We show the phase-folded RXTE/Proportional Counter Array (PCA) light curves and the ρ-cycle phase divisions of the two ρ classes in Fig. 1. For the aperiodic variability, we define three frequency bands, the low-frequency band (≲1 Hz), the intermediate-frequency band (∼1–10 Hz) and the high-frequency band (≳10 Hz).
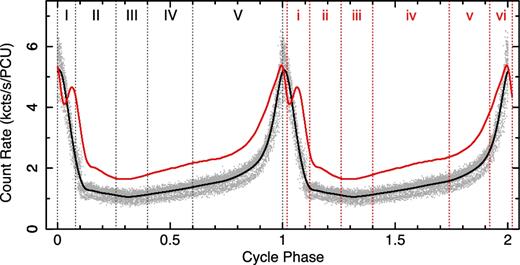
The phase-folded PCA light curves of the ρ1 class (black; RXTE Observation 40703-01-07-00) and the ρ2 class (red; RXTE Observation 60405-01-02-00) in GRS 1915+105. The grey points are the data points of the ρ1 class. The black and red vertical dashed lines denote phases I (0.00–0.08), II (0.08–0.26), III (0.26–0.40), IV (0.40–0.60), V (0.60–1.00) of the ρ1 class, and phases i (0.02–0.12), ii (0.12–0.26), iii (0.26–0.40), iv (0.40–0.74), v (0.74–0.92), vi (0.92–0.02) of the ρ2 class.
3.1 Phase–frequency–power maps
Fig. 2 shows the phase–frequency–power maps. The colours denote the values of the power density. The power densities lower than 10−4 (rms/mean)2/Hz are set to blue.
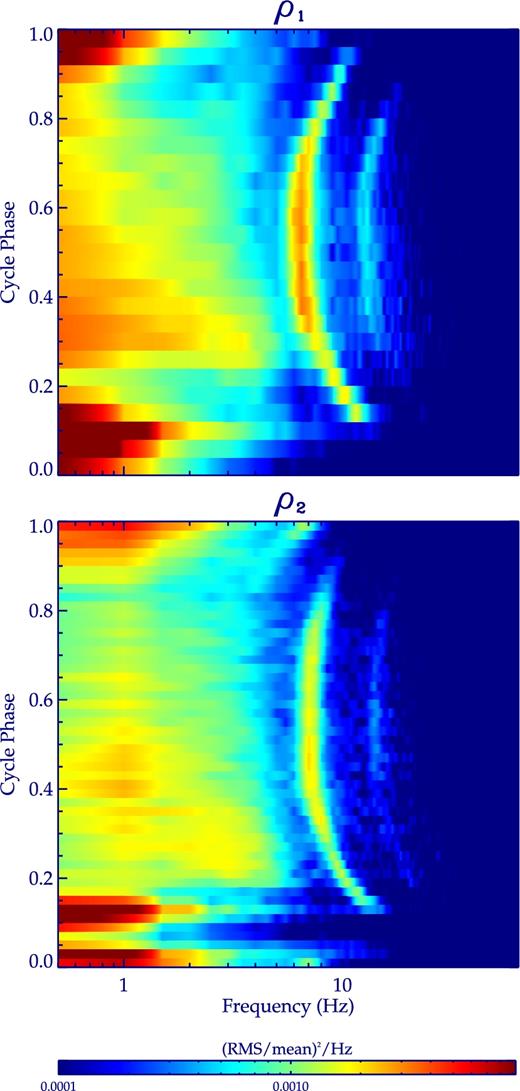
The phase–frequency–power maps of the ρ1 class (upper panel) and the ρ2 class (lower panel) in GRS 1915+105. The colour bar shows the scale of power density in the plots. The power densities lower than 10−4 (rms/mean)2/Hz are set to blue.
For the ρ1 class, the evolutions of the LFQPO and its second harmonic are visible as a green and a cyan fringe, respectively. The red, yellow, green, cyan and blue regions, which are clearly separated in the maps, show the evolution of the aperiodic variability. As the ρ-cycle phase, ϕ, increases from ∼0.25 to ∼0.80, the transition frequency between the red and green regions, ftr1, decreases from ∼3.5 to ∼0.7 Hz, and the transition frequency between the green and blue regions, ftr2, decreases from ∼5.0 to ∼3.0 Hz. At ϕ ∼ 0.20 and ∼0.85, which correspond to the end and the start of the flux peak, respectively, ftr2 decreases to ∼2.0 and ∼1.2 Hz, respectively. At ϕ ∼ 0.20, ftr1 decreases to ∼0.5 Hz. In the phase ∼0.92–0.15, the power density of the aperiodic variability below ∼1.5 Hz is enhanced.
For the ρ2 class, the evolutions of the LFQPO and its second harmonic are also displayed as a green and a cyan fringe, respectively. Another LFQPO is present in the phase 0.84–0.02 as a cyan fringe. We show the phase dependence of the fundamental LFQPO (black points) and the LFQPO in the phase 0.84–0.02 (blue points) in Fig. 3. We show the double of the frequencies of the LFQPO in the phase 0.84–0.02 as red points in panel (a). In the phase 0.84–0.92, the frequency of the fundamental LFQPO is about double of the frequency of the other LFQPO. Considering that the LFQPO with lower frequency evolves smoothly to the phase 0.92–0.02, we argue that the LFQPO in the phase 0.84–0.02 is the sub-harmonic of the fundamental LFQPO in the phase 0.12–0.92. As ϕ increases from ∼0.18 to ∼0.80, ftr2 decreases from ∼5.5 to ∼3.0 Hz. At ϕ ∼ 0.17 and ∼0.85, ftr2 decreases to ∼1.5 Hz. ftr1 is not obvious here. In the phase ∼0.90–0.15 excluding ∼0.04–0.08, the power density of the aperiodic variability below ∼1.5 Hz is enhanced. This result is further demonstrated by the amplitude of the 0.5–1.0 Hz aperiodic variability as a function of phase presented in panel (c) of Fig. 3.
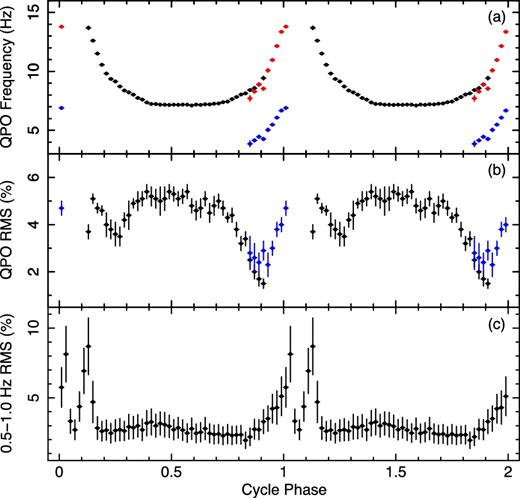
The evolutions of the QPO and its sub-harmonic as well as the 0.5–1.0 Hz aperiodic variability of the ρ2 class in GRS 1915+105. In panels (a) and (b), the black points represent the fundamental QPO in phase 0.12–0.92, and the blue points represent the sub-harmonic in phase 0.84–0.02. We doubled the frequencies of the sub-harmonic and show these values as red points.
3.2 Energy–frequency–power maps
Figs 4 and 5 show the energy–frequency–power maps. The colour scale is the same as that of the phase–frequency–power maps. The LFQPOs and their harmonics are displayed as vertical pencil-like patterns in the maps. These maps indicate that the power density is larger in the high-energy/low-frequency part of the maps than in the low-energy/high-frequency part for all phases of both ρ classes, and is larger in the high-energy/low-frequency part than in the low-energy/low-frequency part for phases III, IV, V in the ρ1 class and for phases iii, vi, v in the ρ2 class. For other phases, the power density decreases in the high-energy/intermediate-frequency part while increases in the low-energy/low-frequency part.
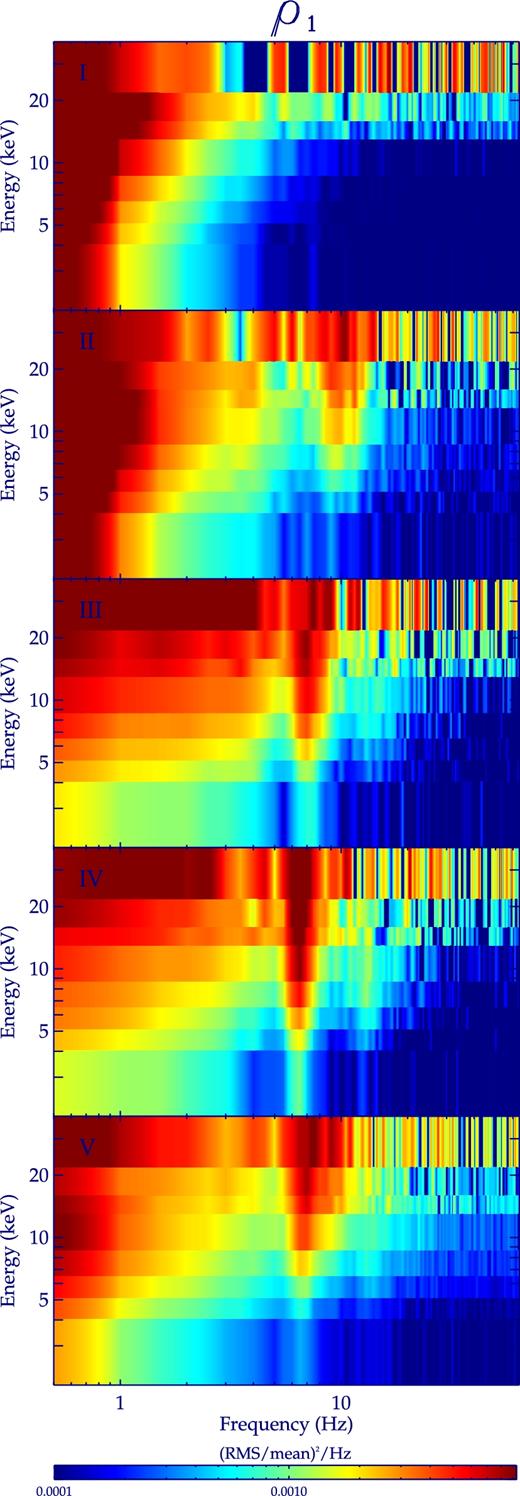
The energy–frequency–power maps for different phases of the ρ1 class in GRS 1915+105. The colour bar is the same as that in Fig. 2.
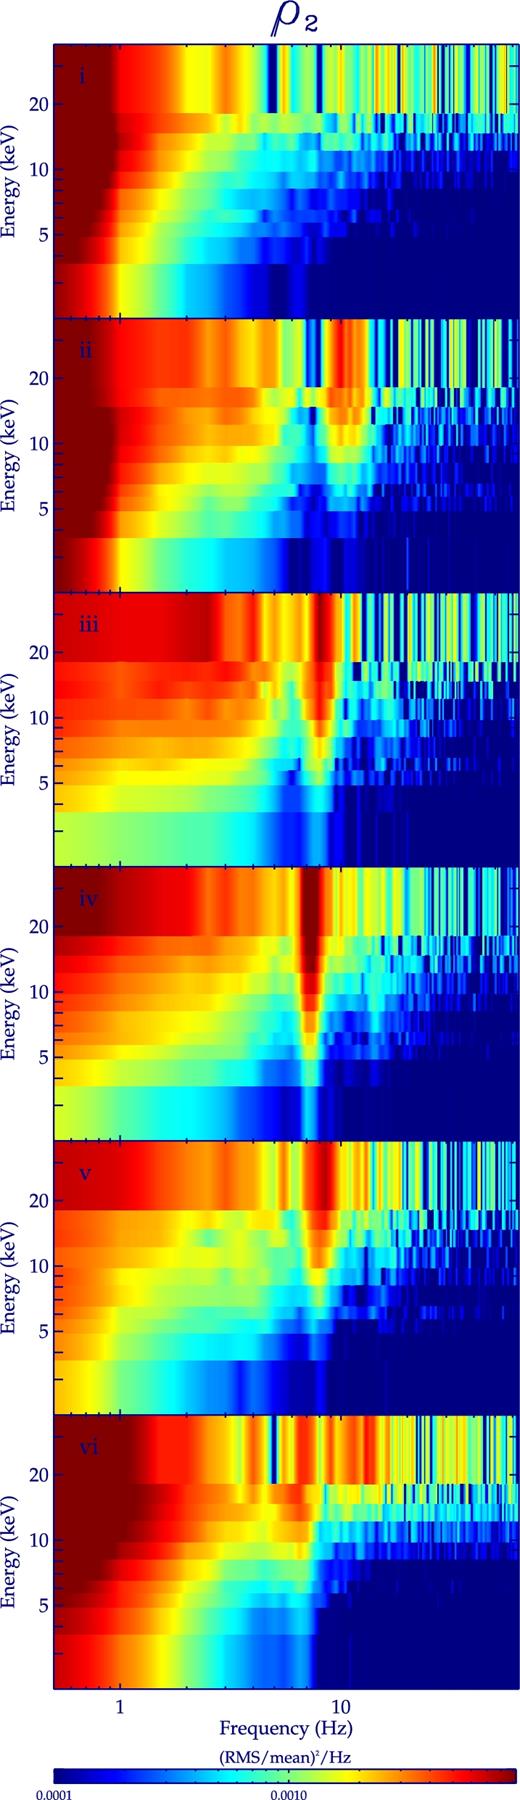
Same as Fig. 4 for different phases of the ρ2 class in GRS 1915+105.
3.3 Phase-lag spectra
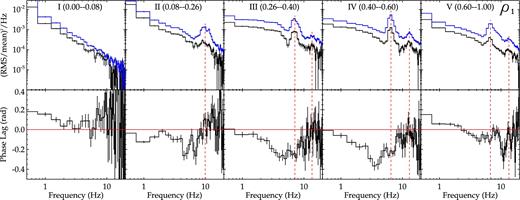
Figs 6 and 7 show the PDS and the phase-lag spectra in different phases of the ρ1 and ρ2 classes, respectively. Though the details are different, the phase-lag spectra of the aperiodic variabilities of the two ρ classes have a common feature: the phase lag is usually lower in the intermediate-frequency band than in the low-frequency band. When the source is in the rise phase of the pulse (e.g. phases V in the ρ1 class and vi in the ρ2 class), the phase lag is hard in the low-frequency band (the corresponding time lag, τ = φ/2πf, where f is Fourier frequency and φ is phase lag, is up to ∼50 ms). In the high-frequency band, the phase lag approximates zero for the ρ2 class and is soft for a narrow range of frequencies for the ρ1 class. When the source is in the slow rise phase (e.g. phases III, IV in the ρ1 class and iii, iv in the ρ2 class), the phase lag is soft (τ is up to ∼20 ms). A main difference between the two ρ classes is that at frequencies below ∼3 Hz, the phase lag approximates zero in phase i of the ρ2 class while it is hard in phase I of the ρ1 class.
The PDS and the phase-lag spectra for different phases of the ρ1 class in GRS 1915+105. The top panels show the PDS in the soft band (1.9–5.1 keV; black lines) and in the hard band (5.1–38.4 keV; blue lines). In the bottom panels, a positive lag means that the hard band photons lag the soft band photons. The vertical red dashed lines denote the centroid frequencies of the LFQPO and its harmonic. The horizontal red dot–dashed line denotes the zero phase lag.

Same as Fig. 6 for different phases of the ρ2 class in GRS 1915+105. Here the soft band is 2.1–4.9 keV, and the hard band is 4.9–37.8 keV.
For phases III, IV, V of the ρ1 class and phases iii, iv of the ρ2 class, there is a dip at LFQPO frequency in the phase-lag curve, indicating that the phase lag of the LFQPO is soft (τ is about several ms). The phase lag approximates zero for the LFQPO in phase II of the ρ1 class and phase ii of the ρ2 class, and is hard (τ is about 10 ms) for the LFQPO in phase vi of the ρ2 class. It is soft (τ is about several ms) for the second harmonic in phase iv of the ρ2 class, while approximates zero for the second harmonic in other phases.
4 DISCUSSION
In this section, we discuss the timing results of two RXTE observations of GRS 1915+105 during the heartbeat state to investigate the origin of the LFQPO and the aperiodic X-ray variability, and combine the timing results with the spectral results of Neilsen et al. (2011, 2012) to obtain a spectral-timing unified picture of the accretion in the heartbeat state of GRS 1915+105. We first introduce some interpretations for the phase lag in order to facilitate the discussion.
In black hole X-ray binaries, the phase/time lag between the high- and low-energy bands in the frequency range ∼0.1–10 Hz has been studied by many authors as an important property of the X-ray variability (e.g. Cui et al. 1997; Hua, Kazanas & Titarchuk 1997; Morgan et al. 1997; Nowak et al. 1999; Poutanen & Fabian 1999; Wijnands, Homan & van der Klis 1999; Cui, Zhang & Chen 2000; Lin et al. 2000; Reig et al. 2000; Kotov, Churazov & Gilfanov 2001; Poutanen 2001; Tomsick & Kaaret 2001; Arévalo & Uttley 2006; Qu et al. 2010; Uttley et al. 2011; Shaposhnikov 2012; Misra & Mandal 2013; Pahari et al. 2013; Altamirano & Méndez 2015; van den Eijnden, Ingram & Uttley 2016). The observed phase lag has been interpreted from several aspects, such as radiation propagation, mass transfer and property of variability. The hard and soft phase lags of the order of light travel time could be produced by the Comptonization of the soft photons from the disc by the hot electron in the corona (e.g. Nowak et al. 1999; Reig et al. 2000) and the reflection of the Comptonized photons from the disc (e.g. Tripathi et al. 2011; Uttley et al. 2011; Wilkins & Fabian 2013). The hard and soft lags of the order of a second could be caused by the differential responses of the inner disc radius and the corona to the mass accretion rate (Mir et al. 2016) or by the differential QPO frequency in the soft and hard energy bands (van den Eijnden et al. 2016). The hard lag of the order of a second could also be produced by the inward propagation of mass accretion fluctuations through the disc (e.g. Lyubarskii 1997; Kotov et al. 2001; Arévalo & Uttley 2006).
4.1 LFQPO
For the ρ2 class, the fundamental QPO is present in the phase 0.12–0.92, while its sub-harmonic is present in the phase 0.84–0.02 (Figs 2 and 3), indicating that the sub-harmonic QPO can still exist when the fundamental QPO disappears.
We use the model of van den Eijnden et al. (2016) and the model of Mir et al. (2016) to discuss the lag of the QPO since these two models can explain both hard and soft lags of the order of few tens of milliseconds (which is the case here).
For the first time, van den Eijnden et al. (2016) showed that the energy band with higher QPO frequency was running away from the other band on short time-scales, namely a positive correlation between QPO frequency and photon energy would result in a soft lag, while an anti-correlation between QPO frequency and photon energy would result in a hard lag. The LFQPO in phase iv of the ρ2 class can thus be qualitatively explained using this model as the QPO frequency is positively correlated with photon energy (Yan et al. 2013b) and the phase lag is soft (Fig. 7).
The model of Mir et al. (2016) is used to interpret the phase lag of a QPO resulted by the oscillation of the inner disc radius, and thus cannot directly explain the QPOs studied here which are highly correlated with the corona (Yan et al. 2013b). Nevertheless, its concept deserves consideration. The basic idea of the model is that the differential responses of different parts of the accretion flow with different temperatures to the mass accretion rate produce the phase lag. If the mass accretion rate has a QPO variation and the different parts of the corona located above different disc radii are different in temperature, then a hard lag will be produced when the temperature of the corona is larger at smaller radii than at larger radii, otherwise a soft lag will be produced. However, it is not clear whether this model can explain the observed energy dependence of QPO frequency.
4.2 Aperiodic X-ray variability
The phase–frequency–power maps show that the power density of the intermediate-frequency aperiodic X-ray variability decreases as the source becomes soft in the slow rise phase (Fig. 2). The significant enhancement of the power density of the low-frequency aperiodic variability in the phase ∼0.92–0.15 of ρ1 class and in the phase ∼0.90–0.15 excluding ∼0.04–0.08 of the ρ2 class coincides with the minimum inner radius of the accretion disc (see Neilsen et al. 2012), suggesting that at this time part of the low-frequency aperiodic variability is connected with the disc. However, the power density of the low-frequency aperiodic variability in the phase ∼0.04–0.08 of the ρ2 class is not enhanced. The phase ∼0.04–0.08 is included in the phase of the second, hard peak of the phase-folded light curve, which is suggested to be the result from the collision between the corona and the material ejected from the inner disc (Neilsen et al. 2011). The suppression of the power density of the low-frequency aperiodic variability in the phase ∼0.04–0.08, which mimics the variability suppression in the phase of the hard peak of the ρ2 class (see fig. 4 in Neilsen et al. 2011), is thus possibly due to the ejection of the inner disc.
The gradient of the power density in the energy–frequency–power maps clearly shows that most of the aperiodic X-ray variability comes from the corona in the slow rise phase (Figs 4 and 5). The energy–frequency–power maps also indicate that in the slow rise phase the low-frequency aperiodic variability from the corona is significant while in the soft ρ-cycle phase the low-frequency aperiodic variabilities from the corona and the disc are both significant, consistent with the results of the phase–frequency–power maps. These results also demonstrate that the energy–frequency–power map is an effective new method for studying the origin of the X-ray variability.
A natural interpretation of the large (∼50 ms) hard lag at low frequencies in the soft ρ-cycle phases (Figs 6 and 7) is that the mass accretion fluctuations in the disc propagate inwards and drive the corona variability at smaller radii. The millisecond level phase lag at high frequency may be due to Comptonization and/or reverberation processes. The observed large (up to ∼20 ms) soft lag cannot be interpreted as a simple reflection delay which is several milliseconds here. The large soft lag could be explained with the scenario of Mir et al. (2016). It also could be caused by propagation of acoustic waves from the hotter corona towards the cooler disc region. In Section 4.3, we continue to interpret the phase lag in the context of a spectral-timing combination analysis.
4.3 Spectral-timing unified picture
In the slow rise phase, the aperiodic X-ray variability from the corona dominates the X-ray variability (Figs 4 and 5) and the phase lag is soft (Figs 6 and 7), indicating that the X-ray variability is produced in the corona initiatively and then induces the aperiodic variability from the disc. The spectral analysis by Neilsen et al. (2011, 2012) indicated that in this phase the disc was a local Eddington limit disc which had a critical radius inside of which the disc was in a critical state, where some excess mass was expelled in the form of wind/outflow and the accretion rate was kept to be at the critical rate (Fukue 2004). It is plausible that in this phase the corona inside of the critical radius has a strong variability and affects the disc through wind/outflow and radiation.
In the rise phase of the pulse, the low-frequency aperiodic X-ray variabilities from both the disc and the corona dominate the X-ray variability (Figs 4 and 5) and the phase lag is hard in the low-frequency band (Figs 6 and 7), indicating that the low-frequency aperiodic variability is produced in the disc initiatively and then drives the corona. Neilsen et al. (2011, 2012) argued that in this phase the disc became unstable due to a thermal-viscous radiation pressure instability and collapsed inwards. It is therefore plausible that the variability of the disc is strong and initiative in this phase.
In the hard pulse of the ρ2 class, the variability shows no significant lag (Fig. 7). Neilsen et al. (2011) showed that in this phase a warm (∼6 keV) optically thick corona, which might be formed from the collision of the hot corona and the cold material ejected from the inner disc, scattered almost all of the photons from the disc. This process will blur the phase lag between the warm corona and the disc and results in the observed zero phase lag. For the decay phase of the pulse of the ρ1 class, the phase lag below ∼3 Hz is significant, which is consistent with the spectral result that about 10 per cent of the disc photons have not been scattered (Neilsen et al. 2012).
In short, we obtained a spectral-timing unified picture: when the disc is in a local Eddington limit, inside of the critical radius part of the mass is expelled by radiation pressure, and the aperiodic variability from the corona is initiative and drives the aperiodic variability from the disc; when there is a radiation pressure instability in the disc, the low-frequency aperiodic variability is initiative and drives the low-frequency aperiodic variability from the corona. When the disc photons are completely scattered by the optically thick corona, no significant phase lag has been observed.
5 CONCLUSIONS
We have performed a detailed timing analysis and made a spectral-timing combination analysis for two RXTE observations of GRS 1915+105 during the single-peaked heartbeat state (ρ1 class) and the double-peaked heartbeat state (ρ2 class), respectively.
The phase–frequency–power maps indicate that in the slow rise phase the intermediate-frequency aperiodic X-ray variability weakens as the source softens and in the rise phase of the pulse when the disc inner radius decreases the low-frequency aperiodic variability becomes more significant, and for the ρ2 class the LFQPO disappears in the rise phase of the pulse while its sub-harmonic is still present with a hard phase lag.
In the slow rise phase, the energy–frequency–power maps indicate that most of the aperiodic X-ray variability is from the corona; the phase-lag spectra indicate that the phase lag is soft at low and intermediate frequencies with a time delay up to 20 ms. In the rise phase of the pulse, the low-frequency aperiodic variabilities from the corona and the disc are both significant; the phase lag is hard at low frequencies with a time delay up to 50 ms. In the hard pulse of the ρ2 class, the phase lag approximates zero.
A spectral-timing unified picture is derived from the combination of our timing results and the spectral results of Neilsen et al. (2011, 2012). When the disc is in a local Eddington limit, the aperiodic variability from the corona drives the aperiodic variability from the disc; when the disc is in a radiation pressure instability, the low-frequency aperiodic variability from the disc drives the low-frequency aperiodic variability from the corona. In the hard pulse of the ρ2 class, the zero phase lag may be resulted from a fully scattering of the disc photons by the optically thick corona.
Acknowledgments
We thank the anonymous reviewer for comments which greatly improved the quality and clarity of the paper. We also thank Kinwah Wu, Peng-Fei Chen and Min Long for helpful discussions. The research has made use of data obtained from the High Energy Astrophysics Science Archive Research Center (HEASARC), provided by NASA's Goddard Space Flight Center. This work is supported by National Natural Science Foundation of China (grant nos. 11273062, 11133001, 11333004, 11173041 and 11373006), the Strategic Priority Research Program of CAS (grant no. XDB09000000) and China Postdoctoral Science Foundation (grant no. 2015M571838). LJ is also supported by the 100 Talents programme of Chinese Academy of Sciences.
