


Abstract
The outer halo regions of early-type galaxies carry key information about their past accretion history. However, spectroscopically probing the stellar component at such galactocentric radii is still challenging. Using the DEep Imaging Multi-Object Spectrograph on the Keck, we have been able to measure the metallicities of the stellar and globular cluster components in 12 early-type galaxies out to more than 10Re. We find similar metallicity gradients for the metal-poor and metal-rich globular cluster subpopulations, suggesting a common formation process for the two subpopulations. This is in conflict with most current theoretical predictions, where the metal-poor globular clusters are thought to be purely accreted and metal-rich globular clusters mostly formed in situ. Moreover, we find that the globular cluster metallicity gradients show a trend with galaxy mass, being steeper in lower mass galaxies than in higher mass galaxies. This is similar to what we find for the outermost galaxy stars and suggests a more active accretion history, with a larger role played by major mergers, in the most massive galaxies. This conclusion is qualitatively consistent with expectations from two-phase galaxy assembly models. Finally, we find that the small difference in metallicity between galaxy stars and metal-rich globular clusters at 1Re may correlate with galaxy mass. The origin of this difference is not currently clear.
1 INTRODUCTION
The currently most popular view of massive early-type galaxy (ETG) formation is the ‘two-phase’ scenario. The first phase consists of an early (z > 2) dissipative collapse of gas that forms the bulk of present-day galaxy stars. The formation of these ‘in situ’ formed stars is driven by gas-rich mergers and/or the gravitational in-fall of gas (De Lucia & Blaizot 2007; Dekel, Sari & Ceverino 2009; Khochfar & Silk 2009; Zolotov et al. 2009; Font et al. 2011; Cooper et al. 2015). The second phase, by contrast, involves the accretion of stars formed ‘exsitu’ (i.e. in external satellites), generally during gas-poor minor merger events. Simulations have found that such stars are mostly accreted in the outer regions of the galaxy at z < 2 (Naab, Johansson & Ostriker 2009; Oser et al. 2010; Font et al. 2011; Lackner et al. 2012; Navarro-González et al. 2013). In massive galaxies, an accretion of stars during major mergers events is predicted to strongly reduce the stellar specific angular momentum (Khochfar et al. 2011). As a consequence, massive slow rotators are thought to have experienced more major mergers than the fast rotators with similar mass.
We acknowledge that the separation of galaxy formation into two phases might be somewhat artificial and too simplistic. This is because mergers happen continuously, with the merger rate and gas fraction decreasing steadily in time. Therefore, the separation of galaxy formation in two phases at z ≈ 2 may be seen as the epoch that roughly denotes a shift from frequent gas-rich accretion episodes to more discrete gas-poor merger events.
While the study of the bright central regions of ETGs has provided strong constraints on their early formation phase, only the exploration of the outer regions of galaxies will help to understand the second accretion phase. In addition, more than 90 per cent of the total mass and angular momentum, and half of the stellar mass lie outside the half-light radius (Re). Therefore, most of the information about a galaxy's formation and evolution is encoded in its outer regions.
The two phase formation scenario makes prediction for the stellar metallicity ([Z/H]) gradients in ETGs. The different phases of formation are expected to produce different metallicity profiles for the ‘in situ’ and ‘exsitu’ components. For instance, the first dissipative phase is supposed to create a metal-rich ‘in situ’ component in the inner regions, where the density is higher and the stellar chemical evolution is faster (Chiosi & Carraro 2002; Zolotov et al. 2010). This ‘in situ’ component will also reveal a steep radial metallicity gradient, because of the rapidly decreasing local density with galactocentric radius (Kobayashi 2004; Pipino et al. 2010).
On the other hand, the ‘exsitu’ stars form mostly in lower mass, relatively metal-poor, external systems. In present-day ETGs, these stars contribute to lowering the metallicity in the regions where they have been accreted, i.e. at large galactocentric radii. These outermost regions are expected to show generally shallow metallicity gradients because of the dynamical mixing of pre-existing and accreted stars (Kobayashi 2004; Di Matteo et al. 2009; Cooper et al. 2010; Font et al. 2011).
In galaxies that experienced accretion, a transition between the ‘in situ’ metal-rich and the ‘exsitu’ metal-poor dominated regions is expected. The radial position of such a transition, which marks where the accreted component starts dominate, is still uncertain. For example, the simulations of Hirschmann et al. (2015) show that this transition radius could lie from 4 to more than 8 Re. Because of their different accretion histories, the metallicity profiles of low-mass galaxies are expected to be systematically different from those of their high-mass counterparts.
Finally, major merger events in massive galaxies will weaken any pre-existing stellar metallicity gradient (White 1978, 1980; Kobayashi 2004; Di Matteo et al. 2009; Rupke, Kewley & Barnes 2010; Navarro-González et al. 2013; Hirschmann et al. 2015). This is because as the mass of the two galaxies involved in the merger are similar, their stars will also show similar metallicities but will be mixed at all galactocentric radii in the final galaxy.
To date, just a handful of studies have spectroscopically probed the stellar metallicity at large radii, and most of them just in the high-mass galaxy range (i.e. M⋆ > 1011 M⊙; Coccato, Gerhard & Arnaboldi 2010; Greene et al. 2012; Mihos et al. 2013). An exception to this is Pastorello et al. (2014), where the stellar metallicity of the outer region (1 < R ≤ 2.5Re) has been spectroscopically measured also in lower mass galaxies (i.e. with stellar mass down to almost 1010 M⊙). In this work, the outer metallicity gradient was found to correlate with galaxy mass, becoming steeper in low-mass galaxies. This may confirm that high-mass galaxies accrete more, and higher mass, satellites than their low-mass counterparts. However, the study of Pastorello et al. (2014) did not reach the galactocentric radii where the accreted component is expected to dominate.
For a small number of very nearby galaxies, stellar metallicity studies at very large radii have been based on the photometric analysis of resolved red-giant branch (RGB) stars (Elson 1997; Harris et al. 2007a,b; Rejkuba et al. 2014; Bird et al. 2015; Peacock et al. 2015). A transition between possible ‘in situ’ and ‘exsitu’ stars has been noticed around 12 Re in NGC 3379 (Harris et al. 2007b). In a spectroscopic study of M31 RGB stars, Kalirai et al. (2006) found a transition in the stellar metallicity at ≈ 30 kpc from the galaxy centre. As this method requires resolved stars, it is limited to the local Universe, and just a handful of galaxies have been studied in this way.
A way to overcome such issues and explore a higher number of galaxies out to large radii is to use a different tracer of the galaxy stellar populations. In particular, globular clusters (GCs) are a viable way to explore the metallicity at large galactocentric radii, since they are bright and dense stellar systems. For this reason, their study can extend beyond the detectable galaxy stellar light, and their metallicities can be measured out to more than 10 Re (Usher et al. 2012). Since GCs are generally very old (i.e. age > 10 Gyr), they have survived the evolutionary processes that formed their present-day host galaxies.
Almost all the GC systems of galaxies with M⋆ ≳ 1010 M⊙ present a bimodality in colour and metallicity, with blue GCs (bGCs) showing lower metallicities than red GCs (rGCs) (Brodie & Strader 2006; Peng et al. 2006; Strader et al. 2006, and references therein). The origin of this bimodality is still unclear, but it is commonly believed that it is intrinsically linked with the host galaxy's formation history (e.g. Strader et al. 2005; Brodie & Strader 2006). In general, rGCs seem to be linked with the host galaxy bulge's stellar population, having similar spatial distribution, kinematics and metallicity, while bGCs seem to share several properties with the galaxy halo component (e.g. Arnold et al. 2011; Faifer et al. 2011; Forbes et al. 2011; Strader et al. 2011; Forbes, Ponman & O'Sullivan 2012; Pota et al. 2013; Kartha et al. 2014; Peacock et al. 2015; Pota et al. 2015).
In this paper, we explore galaxy stellar populations at large radii using both stellar and GC metallicities. In particular, we find that the steepness of the GC metallicity radial profile is higher in low-mass galaxies, qualitatively similar to that between stars and galaxy mass found by Pastorello et al. (2014). Furthermore, we measure the metallicity offset between the galaxy stars in the innermost regions and the rGCs. We find that this offset correlates with the galaxy mass, in the sense that higher mass galaxies present larger offsets. The paper is structured as follows. In Section 2, we present the data and the methods we use to obtain the metallicity of both stars and GCs. In particular, in Section 2.6 we compare our spectroscopic metallicities with photometric metallicity profiles from the literature in order to assess the possible selection bias for our sample of spectroscopic targets. Section 3 presents the results we obtain from the radial metallicity profiles for both the stellar and the GC components. In Section 4, we present our findings and discuss how they compare with the current theoretical predictions and literature results. Finally, in Section 5 we provide a summary of the results. In addition, in Appendix A we present an updated metallicity map for the galaxy NGC 3115, reflecting new extra data points obtained since the publication of the original in Pastorello et al. (2014).
2 DATA ACQUISITION AND ANALYSIS
2.1 The SLUGGS sample
In this work, we present the metallicity radial profiles of both the stellar and the GC components for 12 galaxies from the ongoing SAGES Legacy Unifying Globulars and GalaxieS (SLUGGS1) survey (Brodie et al. 2014). The survey sample includes 25 ETGs (i.e. ellipticals and lenticulars) within a distance D < 30 Mpc. One of the aims of this survey is the study of the stellar populations in both GCs and field stars. We select the subset of 12 SLUGGS galaxies for which the metallicities of at least 15 spectroscopically confirmed GCs have been measured.
The SLUGGS data set presented in this paper has been obtained over 9 yr and 25 observing runs. The GC photometry is from Usher et al. (2012) for all the galaxies, except NGC 4473 (Alabi et al. 2015), NGC 4649 (Pota et al. 2015) and NGC 1023 (this work). Table 1 presents the adopted parameters for the galaxies in this paper.
Galaxy parameters. The columns present: (1) galaxy name, (2) effective radius, (3) morphological type, (4) distance and (5) central velocity dispersion from Brodie et al. (2014). (6) total B-band magnitude from de Vaucouleurs et al. (1991), corrected for galaxy extinction, (7) total logarithmic stellar mass obtained from the K-band extinction corrected absolute magnitude from the 2MASS source catalogue (Jarrett et al. 2000), obtained following the same approach as in Pastorello et al. (2014), assuming the distances in Brodie et al. (2014), (8) colour marking the split between the blue and red GC subpopulations from Usher et al. (2012), except for NGC 1023, NGC 4473 and NGC 4649 (calculated in this work).
| Galaxy | Re | Type | Dist. | σkpc | MB | log(M⋆/M⊙) | (g − i) |
|---|---|---|---|---|---|---|---|
| (arcsec) | (Mpc) | (km s− 1) | (mag) | (dex) | (mag) | ||
| (1) | (2) | (3) | (4) | (5) | (6) | (7) | (8) |
| NGC 1023 | 48 | S0 | 11.1 | 183 | −20.15 | 10.92 | 0.96 |
| NGC 1400 | 28 | E1/S0 | 26.8 | 236 | −20.36 | 11.03 | 0.95 |
| NGC 1407 | 63 | E0 | 26.8 | 252 | −21.61 | 11.50 | 0.98 |
| NGC 2768 | 63 | E6/S0 | 21.8 | 206 | −21.02 | 11.20 | 0.95 |
| NGC 3115 | 35 | S0 | 9.4 | 248 | −20.10 | 10.91 | 0.93 |
| NGC 3377 | 36 | E5–6 | 10.9 | 135 | −19.02 | 10.42 | 0.93 |
| NGC 4278 | 32 | E1–2 | 15.6 | 228 | −19.99 | 10.83 | 0.86 |
| NGC 4365 | 53 | E3 | 23.1 | 253 | −21.30 | 11.40 | 0.91 |
| NGC 4473 | 27 | E5 | 15.2 | 189 | −19.82 | 10.82 | 0.99 |
| NGC 4494 | 49 | E1–2 | 16.6 | 157 | −20.45 | 10.96 | 0.99 |
| NGC 4649 | 66 | E2/S0 | 16.5 | 308 | −21.32 | 11.46 | 0.99 |
| NGC 5846 | 59 | E0–1/S0 | 24.2 | 231 | −21.02 | 11.31 | 0.96 |
2.2 DEIMOS spectra
In order to reduce the DEep Imaging Multi-Object Spectrograph (DEIMOS) spectra, we adopt a modified version of the idlspec2d pipeline (Cooper et al. 2012; Newman et al. 2013), as presented in Arnold et al. (2014). In multislit mode, from a single DEIMOS slit, it is possible to obtain the spectra of both the target object and the background light. While the former is used to study the GC stellar population properties, the latter includes light from both the galaxy's stars and the night sky. Adopting the ‘Stellar Kinematics with Multiple Slits’ (SKiMS) technique (Norris et al. 2008; Foster et al. 2009; Proctor et al. 2009; Arnold et al. 2014; Pastorello et al. 2014; Foster et al. 2015), it is possible to separate the two components in the background spectra and obtain an individual spectrum of the GC and the galaxy starlight at each slit location.
2.3 Stellar metallicities
From these metallicity values, we obtained 2D maps of the galaxy metallicity using the kriging technique (see Pastorello et al. 2014 for details). Kriging maps take into consideration the non-optimal spatial sampling of the available data points. In this way we are able to obtain pseudo-integral field unit (IFU) maps out to several effective radii and derive radial metallicity profiles.
2.4 GC metallicities
The metallicities of the GCs presented in this work are mostly those presented in Usher et al. (2012), Usher et al. (2013) and Usher et al. (2015). These are supplemented with new data obtained from recent Keck observations reduced and analysed using the methods described in Usher et al. (2012). In particular, we add new data for NGC 1023, NGC 1407 and NGC 3115. From the total sample, we select the galaxies with more than 15 spectroscopically confirmed GCs with S/N > 10 Å in the wavelength range from 8400 to 8500 Å.
In order to separate the blue and the red GC subpopulations we adopt a split in (g − i) colours as defined in Table 1. Such colour values are obtained from the best-fitting bimodal colour distributions calculated with the Gaussian Mixture Modelling (gmm) code of Muratov & Gnedin (2010), as in Usher et al. (2012). The whole sample of GC CaT and metallicities used in this paper are presented in Table 2.
2.5 Stellar and GC metallicity scales
The stellar and the GC metallicities used in this work are defined on slightly different metallicity scales. While SAURON/ATLAS3D metallicities are obtained from Lick indices and stellar population models from Schiavon (2007), the Pastorello et al. (2014) stellar metallicities are from the CaT index and the SSP models of Vazdekis et al. (2003). In addition, an empirical correction is applied to the Pastorello et al. (2014) metallicities to correct for an offset with SAURON/ATLAS3D metallicities in the overlapping radial regions, which is likely driven by the initial mass function (IMF). GC metallicities are also obtained from the CaT index and the SSP models of Vazdekis et al. (2003, for details, see Usher et al. 2012). Any differences in the metallicity scale between stellar and GC metallicities may, in principle, lead to systematic offsets between the two components.
2.6 Comparison between spectroscopic and photometric GC metallicity radial profiles
Our sample of GC spectroscopic metallicity may suffer from a selection bias at low metallicities, given that this selection is based on the detection of metallicity-dependent absorption lines. However, the GC metallicity of several galaxies in our sample has already been studied photometrically. For these galaxies we compare our spectroscopic GC metallicities with the photometric GC metallicities from the literature, in order to check whether or not our sample is representative of the whole GC population. Most GCs are predominately old, so photometric colours are a good proxy for metallicity (Puzia et al. 2005; Strader et al. 2005; Spitler et al. 2008), although the relationship is non-linear and seems to vary galaxy-to-galaxy (Usher et al. 2015).
In the case of NGC 1407, Forbes et al. (2011) presented (g − i) radial trends of the red and blue GCs from Subaru/Suprime-Cam. We convert these colours into metallicities following equation 10 in Usher et al. (2012). In their work, Forbes et al. (2011) found that the colour gradients of both rGCs and bGCs are steeper for R < 10 arcmin and flatten in the outer regions. They were concerned that the flattening of the rGC colour gradient in the outer regions may be a consequence of strong contamination (more than 50 per cent) outside of 10 arcmin from the galaxy centre. We reduce the probability of this case, since we spectroscopically confirm the presence of more than few rGCs out to almost 15arcmin in this galaxy.
The two subpopulations of GCs in NGC 3115 have been studied by Arnold et al. (2011) and Jennings et al. (2014). Arnold et al. (2011) presented the (g − i) colour profiles obtained from Suprime-Cam/Subaru photometry. We extract these profiles from their fig. 3 and convert them into metallicity profiles using equation 10 in Usher et al. (2012). Jennings et al. (2014) presented the (g − z) colour profiles obtained from HST/Advanced Camera for Surveys (ACS) photometry. To convert these colours into total metallicities, [Z/H], we adopt equation B1 in Usher et al. (2012).
Usher et al. (2013) presented the colour gradients of NGC 4278 rGCs and bGCs from both HST/ACS and Subaru/Suprime-Cam photometry. From these, we obtain the (g − z) and (V − I) colour gradients for both the GC subpopulations, which we convert into total metallicities [Z/H] with equation B1 and B3 in Usher et al. (2012), respectively.
The case of NGC 4365 is peculiar, since this galaxy hosts three, rather than two, GC subpopulations (Puzia et al. 2002). Blom, Spitler & Forbes (2012) presented the (g − i) colour profiles obtained from Subaru/Suprime-Cam photometry for the three subpopulations. For the purposes of a spectroscopic/photometric metallicity comparison, we consider only the rGC and the bGC colour profiles in their work and exclude the central ‘green’ GCs. We extract these colour profiles from their fig. 16 and convert them into metallicity profiles with equation 10 in Usher et al. (2012).
Similarly, Pota et al. (2015) present the (g − z) colour profiles for both the rGC and bGC subpopulations in NGC 4649. These colours are obtained from HST/ACS, Subaru/Suprime-Cam and Canada–France–Hawaii Telescope/MegaCam photometry. As per Jennings et al. (2014), we convert Pota et al. (2015) colours into total metallicities [Z/H] using equation B1 in Usher et al. (2012).
In Fig. 1, the comparison between photometric and spectroscopic metallicities is presented for NGC 1407, NGC 3115, NGC 4278, NGC 4365 and NGC 4649. In all the galaxies, the bGC average spectroscopic metallicities are generally consistent with the photometric metallicities. We therefore exclude the possibility of a significant bias at low metallicity for our spectroscopic bGC sample. However, the spectroscopic rGC metallicities are generally lower than the photometric ones at the level of ≈ 0.3 dex. This may be a consequence of (1) non-universal colour–metallicity relations for GCs, as discussed in Usher et al. (2015), (2) the spectroscopic sample not being representative of the GC subpopulation, and/or (3) an imperfect classification of GCs into the two subpopulations (which is based on the GC colours). In this latter case, if a non-negligible number of rGCs are, instead, misclassified bGCs, then the overall rGC average spectroscopic metallicity would be higher. This would happen if the rGC and bGC colour distributions are not symmetrical, with the distribution of bGCs showing a significant extension to redder colours. However, we note that this explanation is purely speculative, since the only models showing a possible asymmetry between the colour distributions of the two subpopulations we are aware of show a possible contamination of bGCs by rGCs and not the opposite (Forte, Faifer & Geisler 2007). In any case, the offset between photometric and spectroscopic rGC metallicities is comparable to the uncertainties on the actual spectroscopic measurements and the systematic uncertainties in the colour–metallicity conversions. We conclude that, at least in the galaxies for which we have a high number of spectroscopically measured GC metallicities, the spectral subsample is a reasonable representation of the true metallicity distribution.
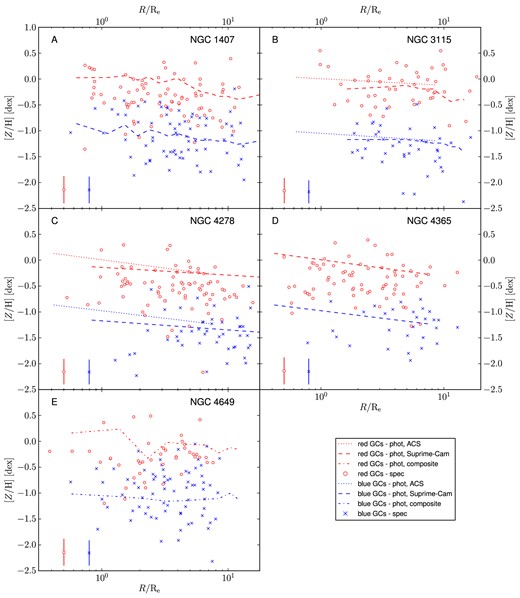
GC radial metallicity profiles. Circles and crosses show the spectroscopic metallicities for the rGCs and bGCs, respectively. The points with error bars show the average uncertainties on the rGC and bGC spectroscopic metallicities. All the points are plotted at their elliptical galactocentric radius scaled by Re. In all the panels the thin and thick lines show the literature photometric metallicity profiles of rGCs and bGCs, respectively.
3 RESULTS
In order to disentangle the different behaviours of the stellar and GC metallicities with galaxy mass, we split our sample into two different stellar mass bins. The radial metallicity profiles for the stellar and GC components of the 12 galaxies in this work are presented in Fig. 2 (for the galaxies with M⋆ > 1011 M⊙) and Fig. 3 (for the galaxies with M⋆ ≤ 1011 M⊙).
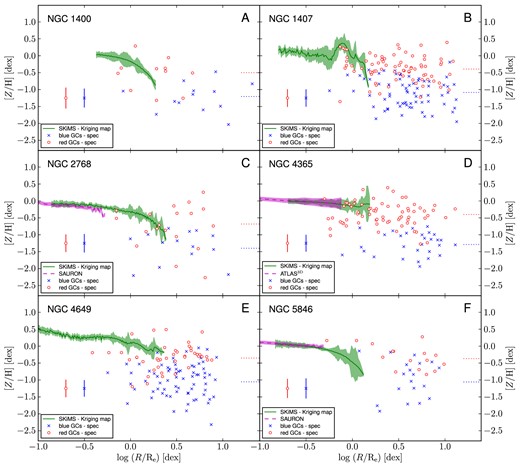
Metallicity profiles for the high-mass galaxies in our sample. The panels (A–F) show metallicity versus elliptical galactocentric radius scaled by Re. The SKiMS stellar metallicity profiles are presented as black solid lines. When available, the SAURON stellar metallicity radial profiles are presented as a black dashed line. For NGC 4365 (panel D), the black dashed line shows instead the ATLAS3D stellar metallicity profile. Crosses and circles show, respectively, blue and red GC metallicities. The circle points with error bars show the average uncertainties on the metallicities of GCs. The dotted and dash-dotted lines show the average metallicities of the rGC and bGC subpopulations, respectively.
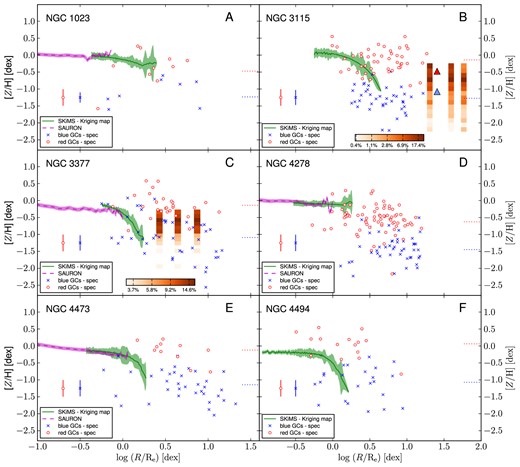
Metallicity profiles as in Fig. 2, but for the six low-mass galaxies in the sample. For NGC 3115 (panel B) and NGC 3377 (panel C) the density plots show the photometric stellar MDF from Peacock et al. (2015) and Harris et al. (2007a), respectively. The radial position of the density plots corresponds to the centre of the observed fields. For better readability, in both cases the radial extension of the density plots does not represent the actual size of the observed field. These density plots are colour-coded according to the colour bars in the same panels. For NGC 3115 (panel B) we also show the photometric metallicities of the halo metal-rich and metal-poor stellar populations as found by Elson (1997) as black and gray triangles, respectively.
Our [Z/H] stellar radial profiles are extracted from the kriging maps presented in Pastorello et al. (2014). In addition, for seven galaxies we have obtained their inner radial metallicity profiles from SAURON/ATLAS3D maps. While the former do not extend to the galaxy centre, the latter do not extend to 1 Re and are, thus, complementary to our data. The stellar metallicity profiles, their correction to match with the inner SAURON/ATLAS3D profiles and the stellar gradient trends with galaxy mass (i.e. steeper in lower mass galaxies) are discussed in Pastorello et al. (2014).
3.1 Halo stellar metallicity from resolved RGB stars
Here, we compare our integrated stellar metallicities and GC metallicities with those from resolved RGB stars from HST observations. A caveat for these studies is that the RGB measurements are usually incomplete at high metallicities, and therefore their values may underestimate the mean metallicities of the real stellar population. For two of our galaxies, NGC 3115 and NGC 3377, RGB metallicities are available and we include these values in Fig. 3.
More recently, for the same galaxy, Peacock et al. (2015) obtained RGB metallicities for three different HST/ACS and HST/WFPC3 fields. These are also plotted in Fig. 3. We confirm that the bulk of their measurements are consistent with a metallicity in between the red and the blue GC metallicities at the same radii. In addition, the low-metallicity tails in the three fields extend into the bGC metallicity domain. Peacock et al. (2015) also found evidence for a low-metallicity stellar population in their outermost peak (at R = 53.8 Re), with an average metallicity value (i.e. |$[Z/\rm {H}]\approx -1.2\,\rm {dex}$|) similar to that of Elson (1997), albeit with the number of RGB stars significantly lower than that presented in Elson (1997). Interestingly, this low-metallicity stellar population has an average metallicity very similar to that of the bGCs (i.e. |$[Z/\rm {H}]=-1.27\,\rm {dex}$|).
Similarly, we add Harris et al. (2007a) RGB stellar photometric metallicities from HST/ACS imaging in the outer regions of NGC 3377. The targeted three contiguous fields, all yielding to a consistent metallicity of |$[Z/\rm {H}]\approx -0.6\,\rm {dex}$|. This is in conflict with the general trend of our SKiMS metallicities up to 2 Re, which instead show a steep decline down to |$[Z/\rm {H}]\approx -1.0\,\rm {dex}$|. Since the Harris et al. (2007a) fields probed only a small fraction of the halo, a possible azimuthal variation or substructure of the RGB stellar metallicity may explain the observed difference.
3.2 GC spectroscopic metallicity gradients
In Fig. 4, we show the combined metallicity profiles for both the stellar and the GC components for our two galaxy stellar mass bins. To obtain the combined stellar metallicity profiles in the two mass bins, we stack the stellar metallicity profiles of the single galaxies and derive the average profile (and the standard deviation) within logarithmic radial bins of 0.05 dex. The combined rGC (bGC) metallicity profiles are obtained stacking the metallicities of all the rGCs (bGCs) in each galaxy mass bin. We derive the average profile (and the standard deviation) within radial bins with a constant number of elements (i.e. Nbin = 20). In Table 3, we present the metallicity gradients measured for the rGC and bGC subpopulations in the two galaxy mass bins with separation at M⋆ = 1011 M⊙. In the low-mass galaxy bin, the rGC and bGC gradients are consistent within the associated uncertainties. Likewise, the rGC and bGC metallicity gradients in the high-mass bin are consistent with each other within the associated uncertainties, and are shallower than the rGC and bGC metallicity gradients in the low-mass bin. In particular, both rGC and bGC gradients show a strong difference between the two mass bins (i.e. 1.7σ and 2.3σ, respectively). Such gradients are measured in the whole available radial range for the different GC subpopulations (we find that using a restricted, common radial range does not change the conclusions). It is useful to remember that, in general, 3D metallicity profiles are ≈10 per cent steeper than those measured for projected galactocentric radii (Liu et al. 2011).
![Combined stellar, rGC and bGC radial metallicity profiles for the low-mass (left-hand panel) and high-mass (right-hand panel) galaxies in our sample. In both panels, the combined stellar, rGC and bGC metallicity profiles are presented as a dotted, a dashed and a solid line, respectively. The dotted curves have been obtained combining SKiMS and SAURON/ATLAS3D metallicity profiles. The shaded region represent the 1σ confidence limits in the stellar, rGC and bGC cumulated metallicity profiles. In the stellar case, the confidence intervals are dominated by the scatter among the galaxies. In the rGC and bGC cases, the confidence intervals are dominated by the scatter among the GC metallicities within the same galaxy. The thick dotted line in the left-hand panel and the thick dashed line in the right-hand panel show the stellar metallicity profiles for the model M215 and M305 of Hirschmann et al. (2015), respectively. Such models represent two extreme formation histories (i.e. M215 experienced only minor mergers while M305 has had a recent major merger). These simulation stellar metallicity profiles have been scaled in [Z/H] to match with the photometrically observed metallicity profiles of the high-mass sample in La Barbera et al. (2012).](https://oup.silverchair-cdn.com/oup/backfile/Content_public/Journal/mnras/451/3/10.1093_mnras_stv1131/2/m_stv1131fig4.jpeg?Expires=1750476745&Signature=44bvmuJOXNB4iowLX4DZQ2ZqXKscPMoD6ZEKwuUcY9daDhrsLH6t0CjWEfbqs5pPeqb3l62YXjXB8LHgMNrK-o0WWbcWq3qJazK~bBZKrmaD9-idBZxTcwBWMRBQ8hYmC3ybrj0bFVWNX2d-6bN4-0FLMPyQf6XhShpm9Y1u-K8GLj-z6WZx~TisqGP9bIiq5BWjPr-BSrhqeyD0Qdger0m~urfOLvmoV7pFsB6TUJMqqOcQm-Q-0med9NSJ~Btw6gccw7D-KRQ-X3rvzJT2mzvcRDbjF4xhs-C~NrHkHXKKqWgUg~gFLv55UHS4UNCckzqmPcWfI8j0mroB3VJ8xQ__&Key-Pair-Id=APKAIE5G5CRDK6RD3PGA)
Combined stellar, rGC and bGC radial metallicity profiles for the low-mass (left-hand panel) and high-mass (right-hand panel) galaxies in our sample. In both panels, the combined stellar, rGC and bGC metallicity profiles are presented as a dotted, a dashed and a solid line, respectively. The dotted curves have been obtained combining SKiMS and SAURON/ATLAS3D metallicity profiles. The shaded region represent the 1σ confidence limits in the stellar, rGC and bGC cumulated metallicity profiles. In the stellar case, the confidence intervals are dominated by the scatter among the galaxies. In the rGC and bGC cases, the confidence intervals are dominated by the scatter among the GC metallicities within the same galaxy. The thick dotted line in the left-hand panel and the thick dashed line in the right-hand panel show the stellar metallicity profiles for the model M215 and M305 of Hirschmann et al. (2015), respectively. Such models represent two extreme formation histories (i.e. M215 experienced only minor mergers while M305 has had a recent major merger). These simulation stellar metallicity profiles have been scaled in [Z/H] to match with the photometrically observed metallicity profiles of the high-mass sample in La Barbera et al. (2012).
GC metallicity gradients in the two galaxy mass bins with separation at M⋆ = 1011 M⊙. The gradients are measured in the whole available radial range (i.e. 0.6 ≲ R ≲ 14Re).
| Low-mass ∇[Z/H] | High-mass ∇[Z/H] | |
|---|---|---|
| (dex dex− 1) | (dex dex− 1) | |
| rGC | −0.26 ± 0.08 | −0.07 ± 0.08 |
| bGC | −0.45 ± 0.13 | −0.08 ± 0.09 |
| Low-mass ∇[Z/H] | High-mass ∇[Z/H] | |
|---|---|---|
| (dex dex− 1) | (dex dex− 1) | |
| rGC | −0.26 ± 0.08 | −0.07 ± 0.08 |
| bGC | −0.45 ± 0.13 | −0.08 ± 0.09 |
3.3 Comparison with metallicity gradients from simulations
From hydrodynamical high-resolution, cosmological zoom simulations, Hirschmann et al. (2015) obtained stellar metallicity profiles out to large radii for 10 galaxies with stellar mass in the range 1.7 × 10¹¹ < M⋆ < 3.7 × 10¹¹ M⊙. They found that when including stellar wind feedback the average stellar metallicity profile slope is consistent with the photometric observations by La Barbera et al. (2012). Hence, we compare our metallicity gradient results with the predictions from only their simulations including stellar wind feedback. In what follows we assume that the Hirschmann et al. (2015) gradient predictions are predominately driven by the different accretion histories of the simulated galaxies, and not by the mass (which has a very narrow range).
We do not compare the absolute metallicity values of Hirschmann et al. (2015), although we do apply an offset in order to have the profiles match photometric observations from the literature. This is because the absolute value of stellar metallicity in simulations is sensitive to the subgrid baryonic physics. Therefore, it is not safe to directly compare our absolute values with those from simulations, while instead we can qualitatively compare the metallicity gradients (which depend mostly on the galaxy formation history).
In fig. 4 of Hirschmann et al. (2015), the average metallicity profile is arbitrarily scaled in metallicity for visualization purposes (Hirschmann, private communication). We extract from this figure the average metallicity profile and offset it to match the observed profile for the high-mass galaxy sample in fig. 8 of La Barbera et al. (2012). In particular, we adopt the La Barbera et al. (2012) metallicity profile obtained with the Bruzual & Charlot (2003) single stellar population models. In this way we obtain the vertical offset to apply to the Hirschmann et al. (2015) profiles.
In Fig. 4, we plot two extreme examples of assembly history from the Hirschmann et al. (2015) simulations with stellar wind feedback at z = 0, representative of minor and major merger dominated evolutionary history, respectively. In particular, in the left-hand panel (i.e. our low-mass galaxy bin) we plot the stellar metallicity profile from the minor merger model M215, which is the model with the highest fraction of minor mergers and no past major merger event. In the right-hand panel (i.e. our high-mass galaxy bin) we plot the stellar metallicity profile from the major merger model M305. This is the model with the highest accreted mass fraction from major mergers. In particular, it includes a major merger event at z ≈ 0. In both cases, the vertical offsets applied to the simulated stellar metallicity profiles provide a good match with our spectroscopically measured stellar metallicity profiles at the common radius.
Hirschmann et al. (2015) provided the stellar metallicity gradients in the range 2 < R < 6 Re. The stellar metallicity profile of M215 has a gradient of − 0.41dex dex− 1, consistent with that of bGCs in our low-mass bin (Table 3). The stellar metallicity gradient of M305 has a gradient of − 0.13 dex dex− 1, consistent with both the gradients of rGCs and bGCs in our high-mass bin (Table 3).
The range of metallicity gradients in the minor merger simulations by Hirschmann et al. (2015) is |$-0.22\le \nabla [Z\rm {/H]} \le -0.76\,\rm {dex\,dex^{-1}}$|, while the range in the major merger simulations is |$-0.10\le \nabla [Z\rm {/H]} \le -0.46\,\rm {dex\,dex^{-1}}$|. Within these ranges, both our high-mass bin rGC and bGC metallicity gradients are fully consistent with those from the major merger simulations. However, in the low-mass bin our GC subpopulation metallicity gradients are consistent with both major and minor merger simulations. We will return to these comparisons in more detail in Section 4.3.
3.4 The metallicity offset between inner stars and rGCs
Thanks to our radially extended stellar and GC spectroscopic metallicity sample we are able to measure the metallicity offset at 1 Re between stars and rGCs.
We verify the existence of a correlation between the stellar-rGC metallicity difference with galaxy mass from our sample of 12 galaxies. In Fig. 5, we plot the metallicity difference Δ[Z/H] between the rGCs and the stars at 1 Re for our sample as a function of different galaxy mass proxies. In particular, for the five galaxies with a high number of rGCs (i.e. NGC 1407, NGC 3115, NGC 4278, NGC 4365 and NGC 4649), we have been able to extrapolate the rGC metallicity to R ≈ 1 Re from the best linear fit of the rGC metallicity profile. For such galaxies, the best linear fit parameters are presented in Table 4. Because of the low number of rGCs in the other galaxies, we adopt the average metallicity of the whole rGC subpopulation in each galaxy as a proxy for the value at R ≈ 1 Re.
![Difference between stellar and rGC metallicities (i.e. $[Z/\rm H]_{\rm {star}}-[Z/\rm H]_{\rm {rGC}}$) versus various galaxy mass proxies. The stellar metallicities values are obtained at 1Re. For five galaxies we have been able to extrapolate the rGC metallicity to 1Re from a linear fit of their radial metallicity distribution. These galaxies are presented as white points. For the other galaxies, the rGC metallicities are obtained as the average metallicity of the whole rGC system. These galaxies are presented as black points. In the left-hand panel the metallicity differences are plotted against the stellar central velocity dispersion, in the central panel against the total stellar mass and in the right-hand panel against the total B-band magnitude of the host galaxy. The dashed lines are the best-fitting linear functions in the three cases. A mild correlation between the stellar-rGC metallicity difference and galaxy mass is seen.](https://oup.silverchair-cdn.com/oup/backfile/Content_public/Journal/mnras/451/3/10.1093_mnras_stv1131/2/m_stv1131fig5.jpeg?Expires=1750476745&Signature=L9DfyR86yRs5I8pUF0e83h20qR54hd6GWvHvZdeQkaJwfd6W1WkIsLIZ5ijbeSwpxgBWIKqYjcqSM3HSmmhuEU3WQ~7AKRg4EgTAr1gLYkHLXwtQJb2C0DhOc1YNCth~kfa~juB3dvOV9QrBii5npS1v4-k4maXsbqg7ADX0Tyb7vdJTMFzWB-8MKNT20SZeEQUAglWIBvAv~i4EjsGg8Jr4-njftPXJqQWI3wAw-QwZ8OJWO7Cwrx2iCW9BxynS8QST1cgDS9MqRcpXu-lUQkwGcXKNi1pCbY0-06jNpS-~eVVLX9DqdgM8cfrsA9ztKTbypLG1nAzJ3UBvmjoCqw__&Key-Pair-Id=APKAIE5G5CRDK6RD3PGA)
Difference between stellar and rGC metallicities (i.e. |$[Z/\rm H]_{\rm {star}}-[Z/\rm H]_{\rm {rGC}}$|) versus various galaxy mass proxies. The stellar metallicities values are obtained at 1Re. For five galaxies we have been able to extrapolate the rGC metallicity to 1Re from a linear fit of their radial metallicity distribution. These galaxies are presented as white points. For the other galaxies, the rGC metallicities are obtained as the average metallicity of the whole rGC system. These galaxies are presented as black points. In the left-hand panel the metallicity differences are plotted against the stellar central velocity dispersion, in the central panel against the total stellar mass and in the right-hand panel against the total B-band magnitude of the host galaxy. The dashed lines are the best-fitting linear functions in the three cases. A mild correlation between the stellar-rGC metallicity difference and galaxy mass is seen.
Best linear-fit parameters for the rGC metallicity profiles of the five galaxies with the highest number of rGCs. The linear fit is in the form: |$[Z\rm {/H}]=m \log ({\it R}\rm {/{\it R}_{e}}) +{\it q}$|.
| Galaxy | m | q |
|---|---|---|
| (dex) | ||
| NGC 1407 | −0.01 ± 0.02 | −0.31 ± 0.08 |
| NGC 3115 | 0.00 ± 0.01 | −0.18 ± 0.10 |
| NGC 4278 | −0.02 ± 0.01 | −0.40 ± 0.08 |
| NGC 4365 | −0.02 ± 0.02 | −0.37 ± 0.07 |
| NGC 4649 | 0.03 ± 0.04 | −0.38 ± 0.12 |
| Galaxy | m | q |
|---|---|---|
| (dex) | ||
| NGC 1407 | −0.01 ± 0.02 | −0.31 ± 0.08 |
| NGC 3115 | 0.00 ± 0.01 | −0.18 ± 0.10 |
| NGC 4278 | −0.02 ± 0.01 | −0.40 ± 0.08 |
| NGC 4365 | −0.02 ± 0.02 | −0.37 ± 0.07 |
| NGC 4649 | 0.03 ± 0.04 | −0.38 ± 0.12 |
GC CaT and metallicity measurements summary. The full version of this table is provided in a machine readable form in the online Supporting Information. The columns present: (1) globular cluster IDs, (2) and (3) right ascension, declination in the J2000.0 epoch, (4) (g − i) colour, (5) i magnitude, (6) CaT index measurement, (7) total metallicity.
| Name | RA | Dec. | (g − i) | i | CaT | [Z/H] |
|---|---|---|---|---|---|---|
| (deg) | (deg) | (mag) | (mag) | (Å) | (dex) | |
| (1) | (2) | (3) | (4) | (5) | (6) | (7) |
| NGC1023_GC1 | 40.1543 | 39.0783 | 1.08 ± 0.03 | 21.98 ± 0.01 | |$7.64^{+0.82}_{-1.01}$| | |$-0.23^{+0.38}_{-0.46}$| |
| NGC1023_GC2 | 40.1542 | 39.0645 | 1.07 ± 0.01 | 19.71 ± 0.01 | |$6.49^{+0.22}_{-0.18}$| | |$-0.76^{+0.10}_{-0.08}$| |
| NGC1023_GC3 | 40.1460 | 39.0370 | 1.12 ± 0.06 | 22.72 ± 0.04 | |$8.24^{+0.68}_{-1.78}$| | |$0.05^{+0.31}_{-0.82}$| |
| – | – | – | – | – | – | – |
In summary, we find that the difference between the stellar metallicity and the rGC subpopulation metallicity at 1 Re correlates mildly with the galaxy mass. Thus, the rGC subpopulations in low-mass galaxies show an average metallicity closer to that of the galaxy stars at similar radii than in high-mass galaxies.
This trend may suggest a longer lag between the peaks of formation for rGCs and stars in more massive galaxies (i.e. continued enrichment in galaxy stars), as suggested by Spitler (2010). Supporting this view, Montes et al. (2014) found that the rGCs in M87 are older and more metal-poor than the bulk of the stars in the central regions of the galaxy. However, as lower mass galaxies have been found to experience a more extended star formation than their higher mass counterparts (Thomas et al. 2005; McDermid et al. 2015), the trend between stellar-rGC metallicity difference and galaxy mass should be the opposite (i.e. larger metallicity offsets in lower mass galaxies).
However, there is another possible cause for this correlation. The correction applied to our stellar metallicities is obtained from the offsets with SAURON metallicities (see Section 2.3). Since this offset is probably linked with a more bottom-heavy IMF in the central regions of high-mass galaxies (Pastorello et al. 2014), this may not apply to the region at R ≥ 1 Re, where the IMF has been found to be shallower and similar among galaxies with different mass (Martín-Navarro et al. 2015). In this case, the stellar metallicity at 1 Re in high-mass galaxies may be systematically overestimated.
Goudfrooij & Kruijssen (2013) found that a colour offset between rGCs and stars in high-mass galaxies exists out to around 1 Re. From the Lick indices analysis in two of their galaxies, they found consistent ages and metallicities between rGCs and stars. Therefore, they claimed that only a steep IMF for the galaxy stars can explain the colour offset with the rGCs. This is in conflict with our findings at 1 Re, since we spectroscopically measure different metallicities for rGCs and stars. However, as discussed above, a shallower IMF slope in high-mass galaxies at 1 Re may reduce the stellar metallicity at such radii.
3.5 Summary of the results
In summary, we find that the possible metal-poor stellar population at large radii from RGB stellar studies shows a metallicity similar to that of bGCs. In addition, we observe that the metallicity gradients of bGCs and rGCs are consistent one with another within the uncertainties in the same galaxy mass bin. Moreover, in the high-mass galaxy bin, both bGCs and rGCs show shallower metallicity gradients than in the low-mass galaxy bin. We also compare our metallicity profiles in low- and high-mass galaxies with stellar metallicity profiles from simulations assuming a minor merger and a major merger dominated evolutions. We find that the bGC metallicity gradient in our low-mass galaxies is consistent with the former, while in the high-mass galaxies both rGC and bGC metallicity gradients are consistent with the latter. Moreover, we observe that the average stellar metallicity at 1 Re is very similar to that of the rGC subpopulation, with larger differences for higher mass galaxies, where the metallicity of the stars is higher than that of the rGCs. In the few cases where we can probe the stellar component to large Re (i.e. NGC 3115, NGC 3377, NGC 4473 and NGC 4494), we find that the stellar metallicity at large radii tends to be similar to the average metallicity of the bGC subpopulation.
4 DISCUSSION
4.1 Stellar metallicity profiles at large radii
In what follows, we discuss the results within the framework of the two-phase galaxy formation scenario, although the general conclusions we draw from our observations can be used as constraints for future different galaxy formation models.
In a two-phase formation scenario, the outer regions of massive ETGs are thought to be dominated by stars formed exsitu, i.e. accreted from smaller companion galaxies or during major merger events. In the first case, the relation between a galaxy's mass and its mean stellar metallicity dictates that small accreted galaxies are made up of metal-poor stars. Therefore, if the stars in the outskirts of ETGs are mostly accreted from smaller satellite galaxies, these regions should reveal a stellar population with a low mean metallicity. In this case, higher metallicity inner regions and lower metallicity outskirts in the final galaxy are expected to be separated by a transition region. The metallicity profile in this region will be steeper than the original one at the same radii (Hirschmann et al. 2015). However, quantitative predictions about the galactocentric radius of this region vary in the literature. One issue is the estimation of the effects of SNe and AGN feedback on the final stellar metallicity profiles, even though some recent studies have started to tackle this problem in detail (e.g. Hirschmann et al. 2015).
In the case of major mergers, accreted stars will have a metallicity comparable with that of pre-existing in situ formed stars. Thus, any pre-existing metallicity gradient will be washed out by the major merger event (Hirschmann et al. 2015). In addition, a significant fraction of in situ stars is pushed at large radii, further diluting their metallicity gradient.
In Pastorello et al. (2014), we found that the stellar metallicity outside 1 Re declines steeply with radius in low-mass galaxies, while it displays a shallower gradient in high-mass systems. This is either a reflection of a relative lack of mergers in the assembly history of our lower mass ETGs and/or we are probing the region between in situ and exsitu dominated regions, where the latter are built-up via minor mergers. If it is a lack of mergers, then the galaxy metallicity profiles are still similar to those formed during the dissipative phase of galaxy formation. If, instead, minor mergers dominate in the evolutionary history of low-mass galaxies, then a stellar low-metallicity ‘plateau’ should be present at larger radii, where the accreted stars dominate the stellar population.
Spectroscopically probing such regions is still a challenge, but some hints of the stellar metallicity profiles at large radii come from resolved RGB stars in nearby low-mass galaxies, albeit with some limitations (e.g. limited radius baseline, observational completeness issues). For example, the almost radially constant RGB stars’ metallicities in NGC 3115 (Elson 1997; Peacock et al. 2015) suggest that the average integrated stellar metallicity in these outer regions does indeed reach a ‘plateau’ for R > 1Re. The RGB metallicities obtained for NGC 3377 at large radii by Harris et al. (2007a) also show a flat metallicity radial profile. On the other hand, in the nearby galaxy NGC 5128, RGB metallicities have been found to show a mild gradient (i.e. |$\Delta [Z/\rm {H}]/\Delta {\it R}_{\rm {e}}\approx -0.030\pm 0.003\,\rm {dex}$|) out to more than 20 Re (Rejkuba et al. 2014; Bird et al. 2015).
An interesting addition to this picture is the observation of distinct stellar components in the data of both Elson (1997) and Peacock et al. (2015). Their median metallicities are qualitatively close to those of the red and blue GCs in NGC 3115 at the same radii.
4.2 What is the origin of GC metallicity bimodality?
Most GC systems of large galaxies show a bimodality in colour, which generally reflects a bimodality in metallicity (Brodie & Strader 2006; Brodie et al. 2012; Usher et al. 2012 and references therein). Most current theoretical models of GC formation predict that rGCs are mostly formed in situ, together with the bulk of the host galaxy's stars, and bGCs form in dwarf galaxies that are later accreted, preferentially in the outer regions of the larger galaxies (Côté, Marzke & West 1998; Katz & Ricotti 2013, 2014; Tonini 2013), although some in situ GC formation in the galaxy halo may occur (Canning et al. 2014). In this scenario, the bGC average metallicity is lower than that of rGCs because it reflects that of the low-mass systems where the bGCs form.
However, another possible scenario for the bimodality formation allows both rGCs and bGCs to be formed in situ and also accreted from low-mass galaxies. In this case, in situ rGCs and bGCs mostly populate the inner regions of the host galaxy, while the accreted GCs lie in the outer regions. If the main sources of exsitu GCs are minor mergers, one may expect a lower number of accreted rGCs than accreted bGCs. This because low-mass accreted galaxies likely had low numbers of rGCs, hence their contribution to the host galaxy's rGC subpopulation should be small (Forbes, Brodie & Grillmair 1997; Peng et al. 2006; Strader et al. 2006; Forbes et al. 2011). On the other hand, major mergers will contribute with a more similar number of rGCs and bGCs.
The most notable difference between the two scenarios concerns the origin of the bGCs, for which the available theoretical models predict almost exclusively exsitu formation, while in the second case a significant fraction of bGCs may have formed in situ.
Differences in rGCs and bGCs azimuthal, kinematic and metallicity distributions are expected in the two scenarios. If bGCs are exclusively formed exsitu and later accreted, their azimuthal and kinematic distributions should be, to first order, decoupled from those of the rGCs and the galaxy inner stars. Instead, if bGCs and rGCs formed under similar conditions, both will show in the inner regions kinematics and azimuthal distributions comparable to those of the galaxy stars (i.e. with similar ellipticity and PA). Observations of GC kinematics and azimuthal distributions do not give a clear answer to the origin of bGCs. In fact, several observations favour the latter scenario (i.e. bGCs and rGCs formed under similar conditions), with galaxies displaying azimuthal distributions for both rGCs and bGCs similar to those of the host galaxy's stellar component (e.g. Dirsch, Schuberth & Richtler 2005; Hargis & Rhode 2014), while others have more decoupled components (e.g. Strader et al. 2011; Kartha et al. 2014). Moreover, in a number of nearby ETGs the kinematics of bGCs have been found to be significantly distinct from those of the stellar component and the rGCs (e.g. Schuberth et al. 2010; Pota et al. 2013).
A better way to disentangle the contribution of in situ and exsitu formed GCs in the two subpopulations is to examine the relation between their average metallicity and host galaxy mass. If a GC subpopulation exclusively formed in situ, then its metallicity should show a positive correlation with host galaxy mass, i.e. in high-mass galaxies the in situ formed GCs will have higher average metallicities than those in low-mass galaxies. On the other hand, the average metallicity of an accreted component would show a weaker correlation with the current host galaxy mass. This is because the mass of an accreted satellite is not directly dependent on the mass of the final host galaxy, although high-mass galaxies tend to accrete higher mass satellites (Oser et al. 2012). So, if rGCs are mostly formed in situ and bGCs are accreted, the rGCs will show a strong trend of their average metallicity with the host galaxy mass, while for the bGCs this trend will be weak/negligible (Bekki et al. 2008).
It is not clear whether or not the bGC average metallicity trend with host galaxy mass is consistent with this picture. A weak correlation between bGC average colour/metallicity and galaxy mass has been confirmed by several studies (e.g. Larsen et al. 2001; Strader, Brodie & Forbes 2004; Peng et al. 2006; Strader et al. 2006). However, in the cases where a colour/metallicity gradient exists (e.g. Peng et al. 2006) this result may be simply a consequence of an aperture bias (i.e. a GC system average will lead to measuring the colours/metallicities of mostly the innermost bGCs in massive galaxies). Once corrected by this bias, the estimated slope for the relation between bGC average metallicity and host galaxy mass may be greatly reduced, potentially disappearing, as discussed in Liu et al. (2011). This would reinforce the theoretical view of exclusively externally formed bGCs. In our low-mass galaxy bin, we note that bGCs show a lower average metallicity (i.e. |$\overline{[Z/\rm {H]}}=-1.21\pm 0.04\,\rm {dex}$|) than in the high-mass galaxy bin (i.e. |$\overline{[Z/\rm {H]}}=-1.12\pm 0.03\,\rm {dex}$|) if compared over the same radial range (i.e. 1 ≤ R/Re ≤ 8). Since our spectroscopic sample is not affected by aperture bias, a mild trend of bGC average metallicity with galaxy mass may exist.
Another key difference between in situ and exsitu formed GCs concerns their radial colour/metallicity gradients. Similar to the predictions for the stellar component, in situ formed GCs will be more metal-rich closer to the centre of the gravitational well. This is because the gas from which GCs form is more metal-rich where the stellar evolution is faster.
Hirschmann et al. (2015) found that the stellar metallicity profile in the region 2 ≤ R ≤ 6 Re is steeper in the minor merger simulations, since the accreted stars at large radii will have a lower metallicity than the in situ formed stars at the same radii. In general, one may expect a similar trend for the case of in situ and exsitu GCs, with steeper gradients if these latter are accreted during minor merger episodes. However, the specific frequency of rGCs is lower in low-mass galaxies and, therefore, minor merger events will generally contribute with more bGCs than rGCs. Major mergers, instead, will strongly reduce the steepness of the metallicity profiles at almost any radius. This is because the accreted GCs will be radially mixed in the host galaxy and the in situ formed GCs will be pushed at larger radii. However, since the GCs formed in more massive satellites tend to be accreted at smaller galactocentric radii, a mild metallicity gradient may be created by this mass segregation effect.
Therefore, if rGCs are mostly formed in situ and bGCs are formed exsitu, the former should show steeper metallicity gradients than the latter. Instead, if the two GC subpopulations have had a similar formation process, both being formed in situ and accreted, they are expected to show similar metallicity gradients over all radii (i.e. steep in the inner regions and shallow in the outer regions).
In the literature there are several massive ETGs for which both the rGCs and bGCs in the inner regions show a significant colour/metallicity gradient, while in the outer regions such gradients flatten (Forte et al. 2001; Harris 2009a,b; Arnold et al. 2011; Forbes et al. 2011; Liu et al. 2011; Hargis & Rhode 2014; Jennings et al. 2014; Pota et al. 2015). While this strongly supports a common in situ formation for the two GC subpopulations in the inner regions, the metallicities have been obtained from photometric colours. Even though most GCs have old ages, these colour gradients may include age variations, thus obscuring the true metallicity gradients. In summary, from the available literature it is not clear whether bGCs may be also formed in situ or are exclusively accreted (as suggested by most theoretical models).
In Section 3.2, we presented the spectroscopic metallicity gradients for both rGCs and bGCs in two galaxy mass bins. In both mass bins, the gradients of the two GC subpopulations are similar to each other. These results support a scenario in which rGCs and bGCs in the same galaxy share a common origin. In particular, the significant bGC and rGC metallicity gradients in our low-mass galaxy bin are in agreement with a mostly in situ origin for both the GC subpopulations.
4.3 Fraction of accreted GCs
As seen in the previous section, from the rGC and bGC metallicity gradients it is possible to infer the existence of both in situ and exsitu formation for both GC subpopulations. Under the two-phase galaxy formation scenario, the exsitu fraction of stars is predicted to be higher in more massive galaxies than in their low-mass counterparts (e.g. Oser et al. 2010; Hirschmann et al. 2013). The Hirschmann et al. (2015) simulations, including stellar wind feedback, also showed that the exsitu stars accreted during minor merger episodes contribute to steepening the pre-existing in situ stellar metallicity gradient. In addition, major mergers create a shallower stellar metallicity profile in the outer regions. If these trends with the formation history apply also to the GC subpopulations, one can draw some simplistic conclusions from the GC metallicity gradients in galaxies of different mass. In particular, if we assume that GCs are a good proxy for the stellar component at large radii, then we can compare the Hirschmann et al. (2015) stellar metallicity gradient predictions with our GC metallicity gradients. A caveat to keep in mind is that Hirschmann et al. (2015) simulations regard galaxies with M > 1011 M⊙, and thus our low-mass galaxies are not directly comparable with their simulations. However, in what follows we assume that Hirschmann et al. (2015) predictions are also valid for the galaxies in our low-mass bin (see Section 3.3).
Similarly to the stellar component, if in high-mass galaxies a high fraction of rGCs and bGCs are accreted during major mergers, then the final rGC and bGC metallicity profiles should be flat. Conversely, if most of the GCs form in situ or are accreted during minor mergers, then they should show steep metallicity gradients. In particular, if the ex situ GCs are accreted during minor mergers episodes, then the bGC metallicity profiles may be expected to be steeper than those of the rGCs in the same galaxies. This is because, given the different specific frequency of rGCs and bGCs in low-mass systems, minor merger episodes will in general contribute with more accreted bGCs than rGCs. As a consequence, the total metallicity gradients of both GC subpopulations will be steeper than in the major merger accretion case, but rGCs will also show a shallower gradient than the bGCs.
This is consistent with our results from Section 3.2. The shallower (consistent with being flat) metallicity gradients we measure for the rGCs and bGCs in high-mass galaxies are consistent with the presence of a higher fraction of ex situ formed GCs accreted during major mergers in these systems. We find that both these metallicity gradients are consistent with the stellar metallicity gradients obtained in a major merger dominated evolutionary history in the simulation by Hirschmann et al. (2015).
On the other hand, the steeper metallicity gradients for rGCs and bGCs in low-mass galaxies show consistency with both minor and major merger dominated formation histories. This is qualitatively similar to that observed for the stellar component in low-mass galaxies (Pastorello et al. 2014). The rGC metallicity gradient in the same galaxy mass bin is shallower. We argue that this is because the number of accreted rGCs is lower than for the bGCs and, therefore, their metallicity gradient is more similar to the in situ stellar metallicity gradient.
In Fig. 6, we present a further comparison of our GC metallicity gradients with the simulations by Hirschmann et al. (2015) that include stellar wind feedback. In particular, we plot the simulated gradients for both of the minor and major merger models against the mass weighted merger ratio and the fraction of ex situ stars in the simulations.
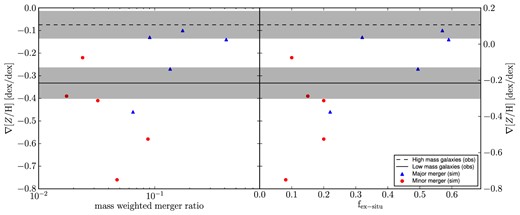
Outer metallicity gradients against mass weighted merger ratio and ex situ stellar fraction. In the left-hand panel, the stellar metallicity gradients for Hirschmann et al. (2015) simulated galaxies in the wind feedback models at z = 0 are plotted against the mass weighted merger ratio. These gradients are measured in the radial range 2 ≤ R ≤ 6Re. In the right-hand panel, the same stellar metallicity gradients are plotted against the total fraction of ex situ stars in the simulations. In both panels the circles are for minor merger dominated formation and triangles for major merger dominated formation. The solid and dashed black lines show the average metallicity gradients for rGCs and bGCs obtained in this work for the low and high galaxy mass bins, respectively. These gradients are obtained in the whole available radial range for our GCs. Qualitatively, the GC metallicity gradient in our high-mass galaxies is similar to those in simulated galaxies with a high fraction of ex situ stars accreted via major mergers. Our low mass galaxy GC metallicity gradient is similar to those in simulated galaxies with a lower fraction of ex situ stars and more influence from minor mergers.
In general, the simulated minor merger stellar metallicity gradients have lower mass weighted merger ratios and lower fractions of ex situ stars than the simulated major merger models. In the same figure, we also show the average metallicity gradients of rGCs and bGCs in our two mass bins. In the low-mass galaxy bin, the average metallicity for the two GC subpopulations is qualitatively in between those of the minor and major merger models. We note that, even though the Hirschmann et al. (2015) simulations did not include galaxies in our low mass bin mass range, the effects of the formation history on the metallicity gradients is the dominant factor. In the high-mass galaxy bin, the average metallicity gradients of both the two GC subpopulations are similar to those from the major merger models.
5 CONCLUSIONS
Here, we present for the first time a systematic compilation of spectroscopically measured metallicities for the stellar and the GC components of 12 galaxies as part of the SLUGGS survey. Metallicities at large radii for both stars and GCs have been obtained from the CaT index. For the innermost radii, we adopt stellar metallicities from SAURON (Bacon et al. 2001) and ATLAS3D (Cappellari et al. 2011) surveys for the galaxies in common. Combining SAURON, ATLAS3D and SLUGGS values, we have been able to spectroscopically measure the metallicity of the stellar component out to almost 4 Re, and of the red and blue GCs out to almost 15 Re.
Our main results can be summarized as follows.
We spectroscopically confirmed that some rGCs exist out to R > 10 Re.
We compare the average stellar metallicity at 1 Re with that of the rGC component, finding that high-mass galaxies host a stellar population that is more metal-enriched than the rGC component, while in low-mass galaxies the stellar and the rGC metallicities are more similar. We claim that this cannot be simply due to a bottom-heavy IMF.
We find that the metallicity gradients of red and blue GCs are consistent within the same galaxy mass bin. In particular, in the low galaxy mass bin blue and red GC metallicity gradients are −0.26 ± 0.08 and − 0.45 ± 0.13 dex dex− 1, respectively. In the high galaxy mass bin, red and blue GC metallicity gradients are −0.07 ± 0.08 and − 0.08 ± 0.09 dex dex− 1, respectively. This consistency between GC subpopulation metallicity gradients within the same galaxy mass bin suggests a common formation process for both red and blue GCs in the same systems. The colour/metallicity bimodality is then potentially a consequence of different epochs for the two subpopulations, as already concluded by photometric studies (e.g. Arnold et al. 2011; Forbes et al. 2011). This is in contrast with most of the current theoretical models that consider rGCs as mostly formed in situ and bGCs as mostly formed ex situ and later accreted into their present-day host galaxy.
We measure metallicity gradients for both the GC subpopulations that are steeper in the low galaxy mass bin than in the high galaxy mass bin. From the comparison with stellar metallicity gradients from simulations at similar radii, we find that this trend is qualitatively consistent with a mass-dependent galaxy formation history, in which the ex situ fraction and the importance of major mergers increase with the galaxy mass. In particular, in high-mass galaxies the higher number of accreted GCs yields shallower metallicity gradients because of the dynamical mixing of in situ and ex situ formed GCs. On the other hand, the bGC metallicity gradient is consistent with the steep stellar metallicity gradient from simulations of minor merger dominated galaxy formation, while the rGC metallicity gradient in the same galaxies is qualitatively shallower. This is in agreement with a galaxy formation dominated by minor mergers, since the merger of lower mass satellites will accrete more blue than red GCs.
ACKNOWLEDGEMENTS
We want to thank the (anonymous) referee for useful comments and suggestions which helped to improve this paper. We wish also to thank Luca Cortese, Martina Fagioli, Alister Graham, William Harris, Michaela Hirschmann and Chiara Tonini for the helpful discussions and suggestions. We are also grateful to Harald Kuntschner for sharing NGC 4365 ATLAS3D metallicity profile and Mark Peacock for sharing the NGC 3115 RGB stellar metallicity distribution data. Some of the data presented herein were obtained at the W. M. Keck Observatory, operated as a scientific partnership among the California Institute of Technology, the University of California and the National Aeronautics and Space Administration, and made possible by the generous financial support of the W. M. Keck Foundation. The authors wish to recognize and acknowledge the very significant cultural role and reverence that the summit of Mauna Kea has always had within the indigenous Hawaiian community. The analysis pipeline used to reduce the DEIMOS data was developed at UC Berkeley with support from NSF grant AST-0071048. DF thanks the ARC for support via DP130100388. This work was supported by NSF grant AST-1211995.
REFERENCES
SUPPORTING INFORMATION
Additional Supporting Information may be found in the online version of this article:
Table 4. GC CaT and metallicity measurements summary. (Supplementary Data).
Please note: Oxford University Press are not responsible for the content or functionality of any supporting materials supplied by the authors. Any queries (other than missing material) should be directed to the corresponding author for the article.
APPENDIX A: UPDATED STELLAR METALLICITY MAPS AND RADIAL PROFILES
Since the publication of Pastorello et al. (2014), we have obtained new stellar metallicity data from the ongoing SLUGGS survey. In particular, for the purposes of this work we have updated the metallicity data set for NGC 3115. In Fig. A1, we present the new metallicity profiles and 2D map. An important difference between this and the Pastorello et al. (2014) metallicity maps for NGC 3115 is that the higher metallicity substructure previously extracted in the north-east region of the galaxy is not visible anymore. The relatively low number of data points in the old version of the 2D kriging map biased the results, in the sense that few high metallicity data points in the same region caused an overestimation of the kriging extracted metallicity.
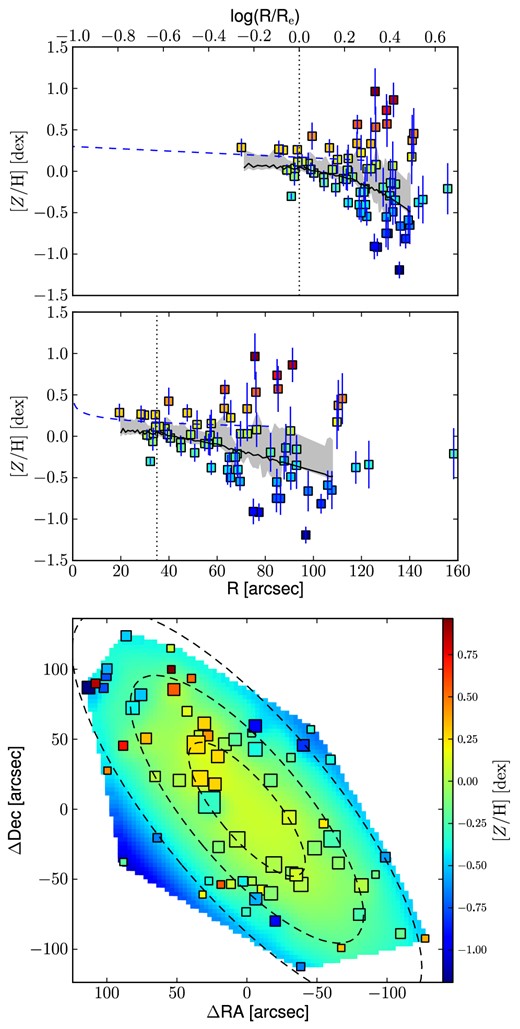
1D metallicity profiles and 2D metallicity map of NGC 3115. The upper panel shows the metallicity profile extracted from the kriging map (black solid line) versus the galactocentric radius in logarithmic space. The central panel shows the same profile, but on a linear radial scale. In both these panels, the measured data points are shown as squares colour coded according to their metallicity. The black dot-dashed vertical line shows the radius corresponding to 1 Re. The blue dashed line shows the metallicity profile along the major axis as measured by Norris, Sharples & Kuntschner (2006). The lower panel shows the 2D metallicity map from kriging and the measured data points colour coded according to their metallicity values. The size of each point is inversely proportional to its uncertainty. The black dashed lines show the isophotes at 1, 2 and 3 Re, with ellipticity and PA from table 2 in Brodie et al. (2014). The data points, radial profiles and 2D metallicity map have been corrected with the empirical relation presented in equation 7 of Pastorello et al. (2014).
