


The paper ‘Condition for the formation of micron-sized grains in dense molecular cloud cores’ (Hirashita & Li 2013) was published in MNRAS, 434, L70 (2013). In the calculation code of coagulation, there was an error in the elapsed time for coagulation. As a result, coagulation proceeds faster in the correct result than that shown in the paper. Correct figures for the evolution of grain size distribution are shown in Fig. 1. The coagulation time to form micron (μm)-sized grains is shorter by a factor of 2.0. The correct condition for the formation of μm-sized grains is shown in Fig. 2.
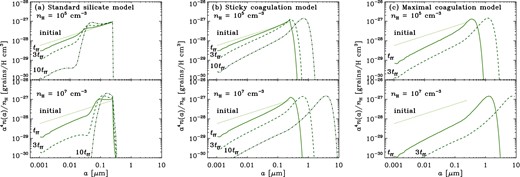
Evolution of grain size distribution. The solid, dashed, and dot–dashed lines show the grain size distributions at t = 1tff, 3tff, and 10tff, respectively, for (a) the standard silicate model, (b) the sticky coagulation model, and (c) the maximal coagulation model. In panel (c), we only show t = 1 and 3 tff, since apeak exceeds 1 μm at t < 3tff. The dotted line presents the initial condition. The upper and lower panels show the cases with nH = 105 cm−3 and 107 cm−3, respectively.
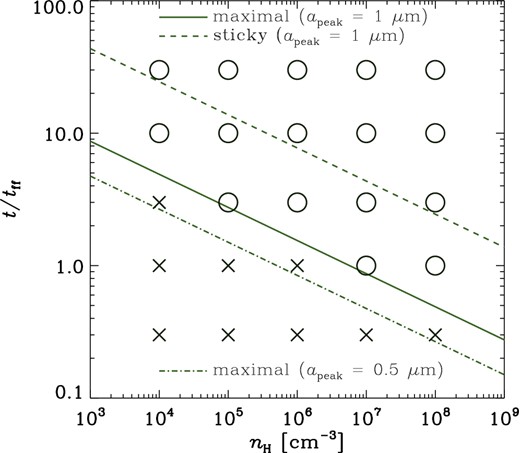
The condition for the formation of μm-sized grains. The success and failure of the formation of a > 1 μm grains in the maximal coagulation model are shown by ‘o’ and ‘x’, respectively. The solid and dashed lines show the boundary of those two cases in the maximal coagulation model and the sticky coagulation model, respectively, if we adopt |$a_\rm{peak}=1\,{\mu m}$| for the criterion for core shine. The dot–dashed line marks the boundary for the maximal coagulation model for a more conservative criterion: |$a_\rm{peak}=0.5 {\mu m}$|.
The conclusion that tgrow is significantly larger than tff does not change.
We are grateful to Paola Paruta who helped us finding this mistake.
