


Abstract
We examine the possibility that a claimed dependence of the Fanaroff–Riley type I/II (FR I/II) break value in radio luminosity on the absolute magnitude of the optical host galaxy could be due to the Malmquist bias, where a redshift–luminosity correlation appears in a flux-limited sample because of an observational selection effect. In such a sample, the redshift dependence of a phenomenon could appear as a luminosity-dependent effect and may not be really representing an intrinsic property of the radio sample. We test this on the radio-complete MRC (Molonglo Reference Catalog) sample, where Spearman rank correlation and Kendall rank correlation tests show that the correlations are indeed stronger between the redshift and the optical luminosity than that between the radio luminosity and the optical luminosity, suggesting that the latter correlation perhaps arises because of the Malmquist Bias. We further show that similar effects of the Malmquist bias could also be present elsewhere in other correlations claimed in the literature between the radio luminosity and other observed properties of FR I and II sources.
1 INTRODUCTION
One of the robust correlations in extragalactic radio astronomy is between the morphology types of radio galaxies and their radio luminosity, first noted by Fanaroff & Riley (1974). In their archetypal paper, Fanaroff & Riley pointed out that almost all radio galaxies below P178 = 2 × 1025 W Hz−1 sr−1 (for Hubble constant H0 = 50 km s−1 Mpc−1) are edge darkened (called type I) in their brightness distribution, while all radio galaxies above this luminosity limit are more or less edge brightened (called type II). This correlation has withstood the test of time (Miley 1980; Antonucci 1993; Urry & Padovani 1995; Saripalli 2012), though the subsequent observations have shown that the transition is not really so sharp, encompassing a band ∼2 orders of magnitude wide in the radio luminosity (see e.g. Baum, Zirbel & O'Dea 1995, and the references therein). Additionally, there is also a claim (Owen & Ledlow 1994; Ledlow & Owen 1996) that the Fanaroff–Riley type I/II (FR I/II) break value in the radio luminosity may itself be a function of the optical luminosity of the host galaxy.
However, because of a strong redshift–luminosity correlation (Malmquist bias) in a flux-limited sample, any effect related with redshift can appear as a luminosity-dependent effect. A question could then arise – Is the construed dependence of the break value in the radio luminosity on the optical luminosity likely to be due to the Malmquist bias? Moreover, could some of the other correlations claimed in the literature between the radio luminosities and other observed properties of FR I and II sources, e.g. the line or continuum optical luminosities of the host galaxies etc., be partially or even wholly results of the Malmquist bias? We investigate these possibilities here.
2 THE SAMPLES AND THE DATA
To study the effect of the Malmquist bias on the shift observed in FR I/II break value in the radio luminosity with a change in the optical luminosity of the host galaxy, we have chosen the essentially complete MRC (Molonglo Reference Catalog) sample (Kapahi et al. 1998) with S408 ≥ 0.95 Jy, and which has the required radio and optical information. The total sample comprises 550 sources, with 111 of them being quasars and the remainder radio galaxies. To quantitatively distinguish between FR I and II, following Fanaroff & Riley (1974), we classify a radio galaxy as FR I if the separation between the points of peak intensity in the two lobes is smaller than half the largest size of the source. Similarly, FR II is the one in which the separation between the points of peak intensity in the two lobes is greater than half the largest size of the source. This is equivalent to having the ‘hot spots’ nearer to (FR I) or further away from (FR II) the central optical galaxy than the regions of diffuse radio emission. We have examined the radio maps and using the above criteria have classified each source into either of the two types (FR I and II). There were a small number of sources that had a doubtful classification, we have dropped them from our analysis and that should not be too detrimental to our conclusions. Optical identifications for the sample are complete up to a red magnitude of ∼24 or a K magnitude of ∼19. The still non-identified cases are expected to be at high redshifts (z ≳ 1), and therefore of high radio luminosities as well, it is not likely that many FR I types will be amongst those. The other sample we have examined for the Malmquist bias is that of Zirbel & Baum (1995) where they have compiled data on FR Is and FR IIs from literature and showed a correlation between the radio and optical luminosities of sources in their sample.
3 RESULTS AND DISCUSSION
Most or perhaps all FR I/II radio data in the literature are from flux-limited samples, in which the Malmquist bias will undoubtedly be present, showing a strong redshift–radio luminosity correlation in the data. Fig. 1 shows such a plot for our MRC data. A similar bias in the sample could as well be there even in the plots of optical absolute magnitudes of host galaxies against redshifts. In most of the samples considered one does not have 100 per cent identifications with spectroscopic redshift measurements and often there is an upper limit on the apparent magnitude for optical identifications of galaxies. In such a case, the Malmquist bias would be present in the optical data as well. Perhaps one way to resolve it would be if we have samples where 100 per cent identifications with spectroscopic redshifts are available. But in the MRC sample incomplete optical identifications does not seem to be problem because more or less all FR Is have been optically identified. Of course there could also be some genuine correlation of optical luminosity with redshift, e.g. if there were a cosmic evolution of the optical luminosity of the host galaxy. In such cases, any plot of the radio luminosities versus absolute visual magnitudes of the galaxies will, through their common denominator of redshift, display a correlation. This correlation could be very strong, even though the optical luminosity might not necessarily be having any intrinsic correlation with the radio luminosity of the source. It is difficult to untangle a Malmquist bias from an intrinsic correlation. Any attempt to eliminate effects of a redshift correlation could inadvertently remove also some genuine effects of radio luminosity. Only if there are sufficient data in the P-z plane so that one could vary parameters P and z independently, could one disentangle the two effects.
Fig. 2 shows the presence of a correlation of the absolute visual magnitudes of the host galaxy with redshift, especially for FR I types, in the MRC data. Irrespective of the ultimate cause, there is no denying that a discernible correlation exists between absolute visual magnitude and redshift, more so among FR Is. In Fig. 3, we see how the correlations for the MRC data seen in Figs 1 and 2 show up as semblance of a correlation between radio luminosities and the absolute visual magnitudes of the host galaxies, especially for FR I types. Among FR IIs the M-z correlation, if any, is much weaker (Fig. 2), the same of course is reflected as a weaker P-M correlation among FR IIs in Fig. 3.
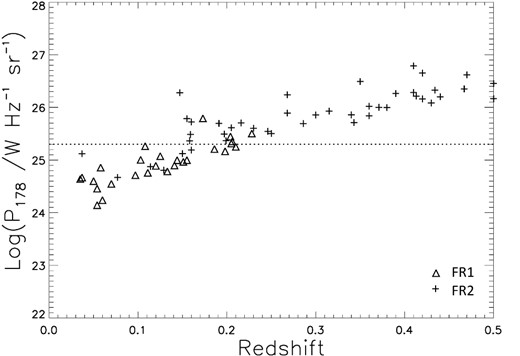
A plot of radio luminosity against redshift, showing a correlation due to the Malmquist bias, for both FR I and II type sources in the MRC sample. The dotted line indicates the FR I/II break-luminosity value from Fanaroff & Riley (1974).
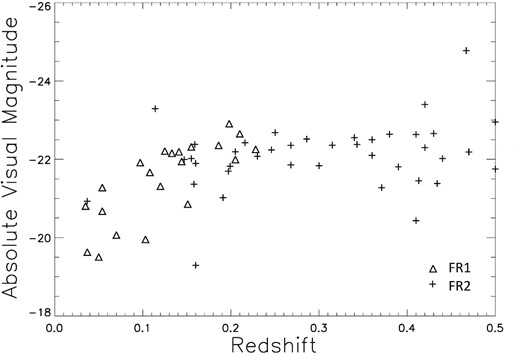
A plot of the absolute visual magnitude of the host galaxy as a function of redshift for both FR I and II type sources in the MRC sample.
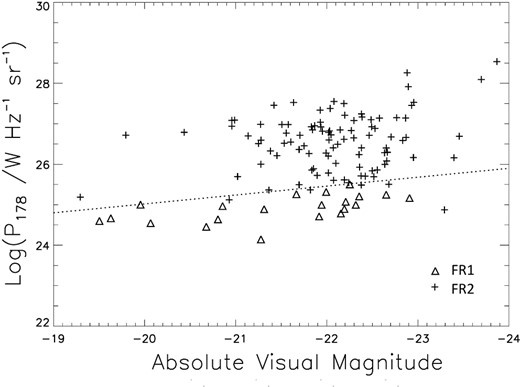
A plot of the radio luminosity against absolute visual magnitude of the host galaxy for both FR I and II type sources in the MRC sample. The dotted line indicates the FR I/II break-radio luminosity value.
Table 1 shows a Spearman rank correlation ρ and a Kendall rank correlation τ between pairs of various parameters, organized in the following manner. (1) Sample used. (2) FR type of the sub-sample. (3) Spearman rank correlation in radio luminosity and redshift. (4) Spearman rank correlation in optical absolute magnitude and redshift. (5) Spearman rank correlation in radio luminosity and optical absolute magnitude. (6) Standard deviation in Spearman rank correlations. (7) Kendall rank correlation in radio luminosity and redshift. (8) Kendall rank correlation in optical absolute magnitude and redshift. (9) Kendall rank correlation in radio luminosity and optical absolute magnitude. (10) Standard deviation in Kendall rank correlations. Standard deviation in each case is calculated under the null hypothesis where the rank correlation between the respective pair of parameters is zero with the correlation coefficient having a normal distribution about the zero mean (Babu & Feigelson 1996).
We notice two things from Table 1 for the MRC sample. The M-z and P-M correlations are much stronger as well as statistically more significant for FR Is as compared to FR IIs, as seen from comparatively much higher values of ρ and τ for FR Is. It was already apparent from Figs 2 and 3 qualitatively, but now we have a more quantitative measure of the correlations and their statistical significance. But what was not that much apparent from Figs 2 and 3 was that the M-z correlations in Table 1 are stronger and statistically more significant than the P-M correlations, both for FR Is and FR IIs. Therefore, it is more likely that the primary correlation is between optical luminosity and redshift and that the weaker correlation between radio and optical luminosities arises as a consequence of the Malmquist bias.
Spearman rank correlation ρ and Kendall rank correlation τ between various pairs.
| Sample | FR type | ρ(P-z) | ρ(M-z) | ρ(P-M) | σρ | τ(P-z) | τ(M-z) | τ(P-M) | στ | ||||
|---|---|---|---|---|---|---|---|---|---|---|---|---|---|
| (1) | (2) | (3) | (4) | (5) | (6) | (7) | (8) | (9) | (10) | ||||
| MRC | FR I | 0.82 | 0.83 | 0.67 | 0.14 | 0.65 | 0.63 | 0.49 | 0.16 | ||||
| MRC | FR II | 0.92 | 0.22 | 0.16 | 0.06 | 0.77 | 0.15 | 0.11 | 0.07 | ||||
| ZS | FR I | 0.85 | 0.75 | 0.76 | 0.08 | 0.69 | 0.57 | 0.57 | 0.09 | ||||
| ZS | FR II | 0.94 | 0.87 | 0.89 | 0.06 | 0.80 | 0.67 | 0.69 | 0.06 |
If the FR I/II break-radio luminosity had a sharp value (as stated by Fanaroff & Riley 1974), then Fig. 3 would contain only a horizontal line with no apparent P-M correlation. However, a spread in the break-radio luminosity value will appear as a corresponding spread in the z value due to the Malmquist bias. This in turn would show up as a spread in optical luminosity for a sample having a correlation in absolute magnitudes and redshift. Thereby, the band of FR I/II break in the radio luminosity would get stretched into a correlation between the radio luminosity of the source and the optical luminosity of its host galaxy. In the case of a strong optical luminosity–redshift relation, the correlation coefficient could be almost as strong as for the radio luminosity–redshift case, since all luminosities have mathematically the same relation with redshift. A suspicion of such an artificial correlation could be there in the claimed correlation by Owen & Ledlow (1994) and Ledlow & Owen (1996), where the slope of the observed correlation is such that a change of optical magnitude of ∼5 in absolute magnitude corresponds to a change of radio luminosity of a factor of about ∼102. Such a thing could be expected because of the Malmquist bias, since both radio and optical luminosities would change by the same factor as a function of redshift. After all it might not be a mere coincident that the correlation between radio and optical luminosities is almost exactly the same as expected from their redshift dependence.
Also in the data of Owen & Ledlow (1994) and Ledlow & Owen (1996), the upper luminosity envelope for FR II case too seems to be related to the absolute optical magnitude by an almost exactly similar slope. Therefore, we think that the claimed correlation does not represent an actual intrinsic correlation but could merely be result of the Malmquist bias through their redshift dependence. Then, any further theoretical interpretation would also need to be accordingly revised or at least looked at afresh.
Similar effects of the Malmquist bias could also be seen in some other correlations claimed between the radio luminosity and some other parameters like the optical line luminosity (Zirbel & Baum 1995, fig. 9). While the authors have mentioned the effects of redshift on radio and optical luminosities, but they have not really tried to remove them.
In Fig. 4 here, we show a plot of the line luminosity of the host galaxy against radio luminosity at 408 MHz for the sample of FR Is and FR IIs from Zirbel & Baum (1995, table 11). The correlation seems to be quite tight between the two quantities. However, this all could merely be a manifestation of the Malmquist bias which can be seen from Figs 5 and 6 where we have plotted distribution of redshift (z), in 3D plots in the radio luminosity–optical line luminosity plane, for the same sources as in Fig. 4. While in Fig. 5 we have restricted the redshift range to z < 0.5 to avoid too much compression of the scale for FR Is, Fig. 6 shows a 3D surface plot for FR IIs covering their full redshift range. From these two figures, it seems that the apparent correlation seen in Fig. 4 was perhaps because the higher radio luminosity sources due to the Malmquist bias are predominantly picked at higher redshifts and which necessarily will also be of higher optical line luminosities so as to be able to find their place in the sample at those high redshifts. Then, the perceived correlation in Fig. 4 would have arisen mainly due to this selection effect and might not represent any real intrinsic correlation in the source properties. From Table 1 also, we see that both M-z and P-M correlations are approximately of equal strength and of comparable statistical significance. Considering that, one cannot unambiguously say that it is an intrinsic correlation between radio and optical luminosities, as generally stated in the literature. Instead, it could as well be a correlation between optical luminosity and redshift, masquerading as a P-M correlation due to the Malmquist bias. The question could not decisively be settled based on any amount of arguments, sans actual observational data, and it could be a non-trivial task to isolate true correlation, if any, between the two luminosities in the presence of a Malmquist bias.
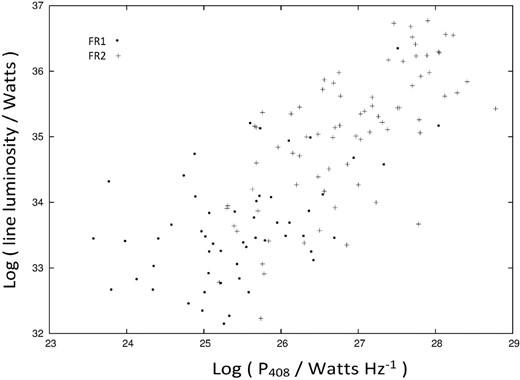
A plot of the line luminosity of the host galaxy against radio luminosity at 408 MHz for both FR I and II type sources in the Zirbel & Baum (1995) sample.

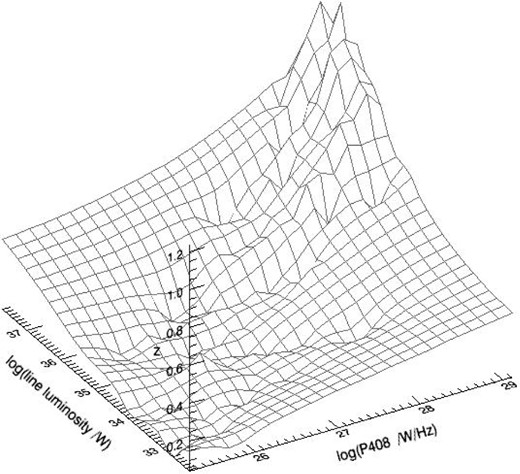
A 3D surface plot of the redshift distribution in the line luminosity–radio luminosity plane corresponding to Fig. 4, for FR II type sources.
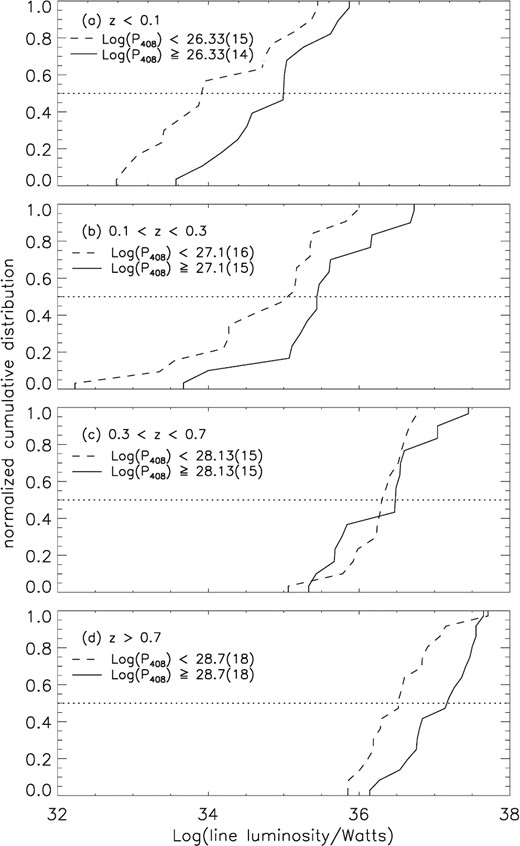
Correlation of the optical luminosity with radio luminosity of FR IIs investigated from their normalized cumulative distributions for different radio luminosity bins within various redshift zones. The dotted lines intersect the cumulative plots at their median values. The number of sources in each radio luminosity bin are given within parentheses.
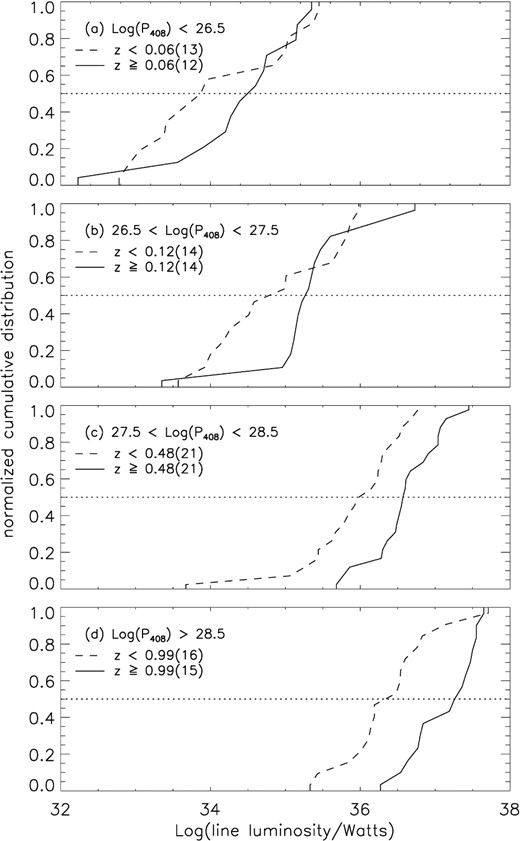
Correlation of the optical luminosity with redshift of FR IIs investigated from their normalized cumulative distributions for different redshift bins within various radio luminosity zones. The dotted lines intersect the cumulative plots at their median values. The number of sources in each redshift bin are given within parentheses.
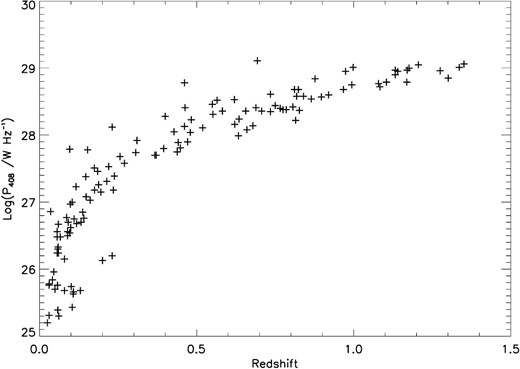
Correlation of the radio luminosity with redshift of FR IIs from Zirbel & Baum (1995).
How to disentangle the two effects? As an illustration we quote from the literature a case where the Malmquist bias was successfully removed in the dependence of linear sizes on redshift and radio luminosity of radio galaxies and steep spectrum quasars. An earlier claim (Kapahi 1987) was that both radio galaxies and quasars have a similar radio size dependence on redshift. These results were marred by the Malmquist bias since size dependence, if any, on the radio luminosity was not considered. However, using a much bigger sample, (Singal 1993) could separate the size dependences on luminosity and redshift by varying them independently and showed that the radio galaxies and quasars differed very much from each other in their size dependences on redshift and radio luminosity. Such was not possible to discern earlier due to a Malmquist bias.
We attempt here a similar separation by first intersecting the 3D surface in Fig. 6 by three horizontal planes at z = 0.1, 0.3 and 0.7, thereby dividing it into four redshift regions, with roughly similar number of sources in each region. Then, within each redshift region we plotted the normalized cumulative distribution of the optical line luminosity for two radio luminosity bins. Due to the lack of sufficient sources, the data were divided in only two bins, choosing the median value of radio luminosity in that redshift range as the dividing line between the two bins. Fig. 7 shows the plots. Though the cumulative plots may have certain overlap at some places, but we definitely see a direct correlation between the optical line luminosity and the radio luminosity within each redshift range. This might appear to support the claims of Zirbel & Baum (1995). However, a similar division into four radio luminosity regions and plots of the normalized cumulative distribution of the optical line luminosity for different redshift bins (Fig. 8) shows a similar correlation between the optical line luminosity and redshift. It is clear from Figs 7 and 8 that from the present data alone one cannot unambiguously conclude whether the optical line luminosity is intrinsically correlated with the radio luminosity, redshift or both and how much might be the effect of the Malmquist bias. The Malmquist bias is too strong in the present data, due to a tight correlation between redshift and radio luminosity (Fig. 9), to disentangle the two. One needs much more data at different radio flux-density levels, so that one could get wide range of radio luminosities within narrow redshift ranges (and vice versa) to successfully disentangle the two effects.
