


Abstract
We present the Dark MaGICC (Making Galaxies in a Cosmological Context) project, which aims to investigate the effect of dark energy (DE) modelling on disc galaxy formation via hydrodynamical cosmological simulations. Dark MaGICC includes four dynamical DE scenarios with time varying equations of state, one with a self-interacting Ratra–Peebles model. In each scenario, we simulate three disc galaxies with high resolution using smoothed particle hydrodynamics. The baryonic physics model is the same used in the MaGICC project, and we varied only the background cosmology. We find that the DE parametrization has a surprisingly important impact on galaxy evolution and on structural properties of galaxies at z = 0, in striking contrast with predictions from pure N-body simulations. The different background evolutions can (depending on the behaviour of the DE equation of state) either enhance or quench star formation with respect to a Λ cold dark matter model, at a level similar to the variation of the stellar feedback parametrization, with strong effects on the final galaxy rotation curves. While overall stellar feedback is still the driving force in shaping galaxies, we show that the effect of the DE parametrization plays a larger role than previously thought, especially at lower redshifts. For this reason, the influence of DE parametrization on galaxy formation must be taken into account, especially in the era of precision cosmology.
1 INTRODUCTION
Since the first Type Ia supernova (SN) data were published (Riess et al. 1998; Perlmutter et al. 1999), it has been clear that our Universe is expanding with a positive acceleration. To enable an accelerated expansion, there needs to be a repulsive force in our model of the Universe, and thus Einstein's cosmological constant Λ was reintroduced. Its reintroduction led to the current standard Λ cold dark matter (ΛCDM) cosmological model.
Allowing the existence of a cosmological constant is the simplest solution to obtain a positive acceleration. It implies that more than 70 per cent of the energy in our Universe could be described as a homogeneous fluid whose equation-of-state parameter is w ≡ p/ρ = −1 and, consequently, that its energy density |$\Omega _\Lambda$| remains constant as a function of time.
Despite the excellent agreement of ΛCDM cosmology with observations, the model does suffer from fundamental problems. The cosmological constant must be finely tuned in the early Universe to reproduce the fit to observations we see today. Moreover, the attempt to explain the presence of such an energy density with vacuum energy fails by several orders of magnitude in predicting today's Λ energy density value. Finally, it is a remarkable coincidence that the values of the energy densities of Λ and of matter are today of the same order (see Weinberg 1989; Carroll, Press & Turner 1992).
For these reasons, cosmologists have been seeking alternatives to a cosmological constant. Such alternatives are generally referred to as ‘dark energy’ (DE), a more general setting in which the equation-of-state parameter w is allowed to be a function of time. Under this assumption, we describe DE with a homogeneous scalar field whose energy density evolves with time. This changes the expansion history of the Universe and affects the evolution of density perturbations (Baldi 2012). Thus, distinctive signatures of DE models can be found by looking at the formation of structures.
In pioneering dark matter-only simulations with an evolving w, Klypin et al. (2003) found that the differences between the cosmological models were not significant at z = 0 both in the non-linear matter power spectrum and in the halo mass function, although differences between models became significant at higher redshifts with a higher number of clusters for the DE models compared to ΛCDM.
Subsequently, multiple groups investigated the properties of dark matter structures in DE cosmologies; see, for instance, Dolag et al. (2004), Bartelmann et al. (2005), Francis, Lewis & Linder (2009), Grossi & Springel (2009). They looked at halo concentrations, velocity dispersions, abundance relations and linear density contrast at collapse time in DE and early DE models. Generally, more significant differences on the halo mass functions between the ΛCDM and DE cosmologies were found at high redshifts (when the same value for the mean density amplitude σ8 at z = 0 was assumed).
Several studies compared the inner structure of haloes simulated in ΛCDM and DE cosmologies in collisionless simulations. In all cases, a Navarro–Frenk–White (Navarro, Frenk & White 1997) density profile well described the matter distribution. The only difference in the DE simulations was that the matter was more centrally concentrated because the haloes had earlier formation times (Klypin et al. 2003; Linder & Jenkins 2003; Kuhlen et al. 2005).
While these studies all considered DE cosmologies that featured earlier collapse times than ΛCDM, it is also possible for DE cosmologies to form structure later. The equation-of-state parameter, w(a) can ‘cross over the cosmological constant boundary from below’. In other words, w can evolve from w < −1 at high redshift to w > −1 at z = 0. Such models have less collapsed structure at high redshift than ΛCDM (see Pace et al. 2012). Xia et al. (2006) and Xia, Li & Zhang (2013) showed observational constraints favour such models.
While it is useful to study collisionless simulations of DE cosmologies, we can only directly observe baryons. Even though they account for |$\sim\!\! \frac{1}{5}$| of the mass density of dark matter in the Universe, baryons can have an impact on the formation of small-scale structures (White 1976; Gallagher, Hunter & Tutukov 1984; Zhan & Knox 2004; Puchwein et al. 2005; Jing et al. 2006; Maio et al. 2006; Rudd, Zentner & Kravtsov 2008; Casarini et al. 2011b, 2012; De Boni et al. 2011; van Daalen et al. 2011; Fedeli, Dolag & Moscardini 2012). So far, simulations including DE have focused on massive galaxy clusters since cosmology has the largest effect on the formation of the largest structures.
In the last decade, different groups have been studying galaxy formation and evolution by performing high-resolution hydrodynamical simulations in a cosmological context. Only recently they have succeeded in simulating realistic disc galaxies, e.g. star formation history matching with observational constrains, flat rotation curves, exponential surface density profiles (see Robertson et al. 2006; Governato et al. 2007; Agertz, Teyssier & Moore 2011; Guedes et al. 2011; Brook et al. 2012; Scannapieco et al. 2012; Stinson et al. 2013a; Marinacci, Pakmor & Springel 2014). In all of these high-resolution simulations, a ΛCDM cosmology has always been assumed. Recently, an attempt to study galaxy formation in different cosmological models has been presented in Fontanot et al. (2012, 2013), where N-body simulations were combined with a semi analytical model for galaxy formation. While they were able to address the effect of cosmology on global properties of galaxies (e.g. the cosmic star formation), due to their approach they were not able to study the effects of DE parametrization on the internal structure of simulated galaxies.
In this work, we aim to perform the first detailed study of the effect of DE on galactic scale using high-resolution hydrodynamical simulations for three different disc galaxies. Our study is an extension of the MaGICC (Making Galaxies In a Cosmological Context) project and we dubbed it Dark MaGICC. The MaGICC project has been quite successful in reproducing several properties of observed disc galaxies, including star formation rates (SFRs) and stellar masses (Brook et al. 2012; Stinson et al. 2013a), metals production and distribution (Stinson et al. 2012; Brook et al. 2013), flat rotation curves and cored profiles (Macciò et al. 2012; Di Cintio et al. 2014) and disc properties as observed in the Milky Way (Stinson et al. 2013b; Brook et al. 2014).
We adopt the same set of numerical parameters describing the baryonic physics as in Stinson et al. (2013a), and perform high-resolution hydrodynamical simulations with different DE backgrounds, to study the impact of cosmology on disc galaxy properties. In the spirit, this paper is very similar to the recent work by Herpich et al. (2014) that extended the MaGICC project to warm dark matter cosmologies.
This paper is organized as follows. In Section 2, the cosmological models are described and compared with observational constraints. In Section 3, we introduce the numerical methods and implementations. In Section 4.1, we outline the results from our set of simulations and investigate the interplay between feedback and DE. Finally, we draw conclusions in Section 5.
2 COSMOLOGICAL MODELS
For our project, we have chosen four dynamical dark energy (dDE) models, each of which is consistent with Wilkinson Microwave Anisotropy Probe (WMAP) 7 data (Komatsu et al. 2011) at the 2σ level. All the models have at z = 0: |$\Omega _{{\rm b}_0} = 0.0458$|, |$\Omega _{{\rm DM}_0} = 0.229$|, H0 = 70.2 km−1 s−1 Mpc−1, σ8 = 0.816, ns = 0.968, where these parameters are density parameters for baryons and dark matter, Hubble constant, root mean square of the fluctuation amplitudes and primeval spectra index.
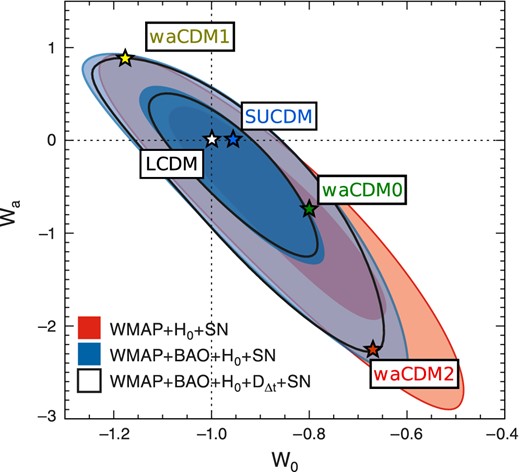
Confidence contours of constrains for w0 and wa from WMAP7. Each cosmological model is represented by a star. All of these models are viable models according to WMAP7 data. The star representing the SUCDM model is here shown only for comparison, but clearly its position on this plot holds only at z = 0, since its equation-of-state parameter w(a) cannot be described by the CPL parametrization.
Parameters of the waCDM cosmological models.
| w0 | wa | |
|---|---|---|
| waCDM0 (green) | −0.8 | −0.755 |
| waCDM1 (yellow) | −1.18 | 0.89 |
| waCDM2 (red) | −0.67 | −2.28 |
| w0 | wa | |
|---|---|---|
| waCDM0 (green) | −0.8 | −0.755 |
| waCDM1 (yellow) | −1.18 | 0.89 |
| waCDM2 (red) | −0.67 | −2.28 |
In Fig. 1, the 2σ contours from WMAP7 in the wa–w0 plane are shown, and each cosmological model is represented by a triangle. It is important to note that all of these models are viable models according to WMAP7 data. The triangle representing the SUCDM model is here shown only for comparison, but clearly its position on this plot holds only at z = 0, since its equation-of-state parameter w(a) cannot be described by the CPL parametrization. In order to show how the background evolution changes between cosmological models, Fig. 2 shows the expansion velocity as a function of the logarithm of the scalefactor while Fig. 3 shows the growth factor as a function of the scalefactor for each cosmology we use. We chose to compare different cosmological models by normalizing them to the same σ8 today. With this choice, a model with a faster expansion will have to start producing structure earlier than a model with slower universe expansion. This means that statistically, the SUCDM model (blue) will show collapsed structures at an earlier epoch than the waCDM2 model (red), in order to compensate for the faster expansion of the universe. The earlier structure formation also leads to earlier accretion of the substructures on to the main halo. In turn, we expect that earlier accretion will lead to earlier star formation in the simulated galaxies.
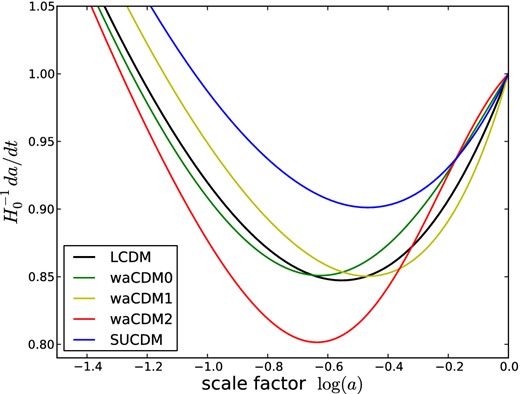
Expansion velocities of the universe in units of the Hubble constant as a function of the scalefactor. Different colours represent different cosmological models.
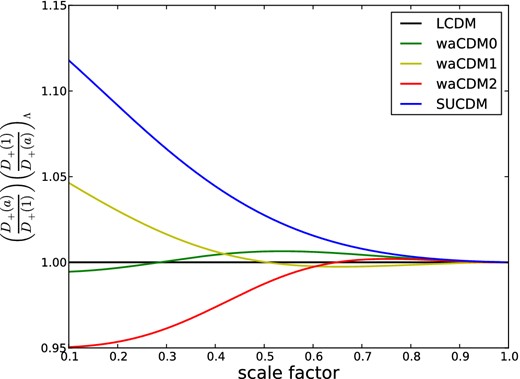
The ratio of the growth factor at a given scalefactor and at a = 1 divided by the same ratio for ΛCDM.
3 NUMERICAL METHODS
3.1 Initial conditions and dDE generalization
We modified the initial condition generator grafic-2 (Bertschinger 2001) such that we can generate initial conditions for a generic cosmological model once the evolution of the cosmological parameters are given as an input. Our implementation requires transfer functions for baryons and for dark matter at initial and final redshift, evolutions of the density parameters Ωi, linear growth factor D+ and fΩ, the logarithmic derivative of the growth factor with respect to the scalefactor. Note that also the original code grafic-2 needs both transfer functions at initial and final redshifts, since, especially for baryons, transfer functions cannot simply be rescaled. The transfer functions were computed with a modified version of camb (Lewis & Bridle 2002) that allows us to account for dDE scenarios. As the original code, grafic-de is able to generate zoomed initial conditions from a cosmological box.
At first, we generate a uniform particle distribution in an 80 Mpc h−1 box with 3503 particles. The initial conditions were evolved with the pkdgrav tree-code (Stadel 2001), we then select a dark matter halo and we resimulate it with pkdgrav for the dark matter-only runs and with gasoline (Wadsley, Stadel & Quinn 2004) for the hydrodynamical runs. The ΛCDM haloes are chosen so that no structures are present in within three of their virial radii and the equivalent haloes in the other cosmological models are then identified.
Both pkdgrav and gasoline have been modified so that they can accept cosmological background evolutions as inputs. We have simulated three disc galaxies, galα, galβ, galγ, and each of them was run in all five cosmological models. In Table 2, we summarize the main proprieties of the chosen three disc galaxies in ΛCDM, SUCDM and waCDM2 cosmologies. For all three galaxies, the softening for gas and dark matter particles are, respectively, 0.45 and 1 kpc. Note that, for all galaxies, the SUGRA equivalents are always the most massive and, on the other hand, the waCDM2 are always the least massive.
Physical properties of the three disc galaxies in ΛCDM, SUCDM and waCDM2. We show virial mass (total mass), dark matter mass, gaseous mass and stellar mass, all calculated within one virial radius.
| Mvir | MDM | Mgas | M* | |
|---|---|---|---|---|
| [M⊙] | [M⊙] | [M⊙] | [M⊙] | |
| galα | ||||
| ΛCDM | 7.74 × 10¹¹ | 6.76 × 10¹¹ | 5.34 × 10¹⁰ | 4.52 × 10¹⁰ |
| SUCDM | 8.23 × 10¹¹ | 7.12 × 10¹¹ | 5.52 × 10¹⁰ | 5.62 × 10¹⁰ |
| waCDM2 | 7.33 × 10¹¹ | 6.46 × 10¹¹ | 5.68 × 10¹⁰ | 3.07 × 10¹⁰ |
| galβ | ||||
| ΛCDM | 5.65 × 10¹¹ | 4.91 × 10¹¹ | 3.48 × 10¹⁰ | 3.87 × 10¹⁰ |
| SUCDM | 5.70 × 10¹¹ | 4.97 × 10¹¹ | 2.84 × 10¹⁰ | 4.50 × 10¹⁰ |
| waCDM2 | 5.45 × 10¹¹ | 4.82 × 10¹¹ | 3.47 × 10¹⁰ | 2.91 × 10¹⁰ |
| galγ | ||||
| ΛCDM | 3.44 × 10¹¹ | 3.09 × 10¹¹ | 2.76 × 10¹⁰ | 6.68 × 10⁹ |
| SUCDM | 3.65 × 10¹¹ | 3.24 × 10¹¹ | 2.82 × 10¹⁰ | 1.33 × 10¹⁰ |
| waCDM2 | 3.35 × 10¹¹ | 3.02 × 10¹¹ | 2.69 × 10¹⁰ | 5.77 × 10⁹ |
3.2 Hydrodynamical simulation
For the Dark MaGICC project, we are using the same baryonic physics that was used in the MaGICC project (see Stinson et al. 2013a), based on the smoothed particle hydrodynamics (SPH) code gasoline (Wadsley et al. 2004). For further details on the physical processes implemented in gasoline, please refer to Stinson et al. (2013a). Briefly, stars form from cool dense gas that has reached a temperature of T = 1.5 × 10⁴ K and a density of 9.6 cm−3 following the Kennicutt–Schmidt law with 10 per cent efficiency of turning gas into stars during one dynamical time (Stinson et al. 2006). The stellar mass distribution in each star particle follows the Chabrier initial mass function (IMF; Chabrier 2003).
Massive stars explode as Type II SNe and deposit an energy of ESN = 1051 erg into the surrounding gas. Cooling for gas particles subject to SN feedback is delayed based on the subgrid approximation of a blast wave as described in Stinson et al. (2006).
Furthermore, radiation energy from massive stars is considered since molecular clouds are disrupted before the first SN explosion (which happens after 4 Myr from the formation of the stellar population). We assume that 10 per cent of the total radiation energy is coupled with the surrounding gas. The inclusion of this early stellar feedback (ESF) reduces star formation before SNe start exploding. Thus, after the ESF heats the gas to T > 106 K, the gas rapidly cools to 104 K, which creates a lower density medium than if the gas were allowed to continue cooling until SNe exploded. Stinson et al. (2013a) show how this feedback mechanism limits star formation to the amount prescribed by the stellar–halo mass relationship at all redshifts. The code also includes metal cooling and metals can diffuse between gas particles as described in Shen, Wadsley & Stinson (2010).
The hydrodynamical simulations in all cosmological models have been run with the same feedback descriptions just mentioned. The main point of the work is not which of the many recently used feedback recipes best reproduced observations, but the impact of dDE on galactic scales.
4 RESULTS
Using hydrodynamical and dark matter-only simulations, we present how galα, galβ and galγ evolved and their z = 0 properties. These include the dark matter distribution, gas, star and total halo masses, star formation histories, baryonic matter distribution (rotation curves and surface brightness profiles) and the chemical enrichment of the galaxies.
4.1 Stellar and halo mass
Fig. 4 shows how the dark matter profiles of simulations with and without baryons compare in galα for all different cosmological models; galβ and galγ show similar results. The four radial density profiles from the dark matter-only simulations (top panel) are almost indistinguishable. This confirms previous findings from N-body simulations (see Section 1), i.e. that dark matter-only simulations on galactic scales weakly depend on the DE model.
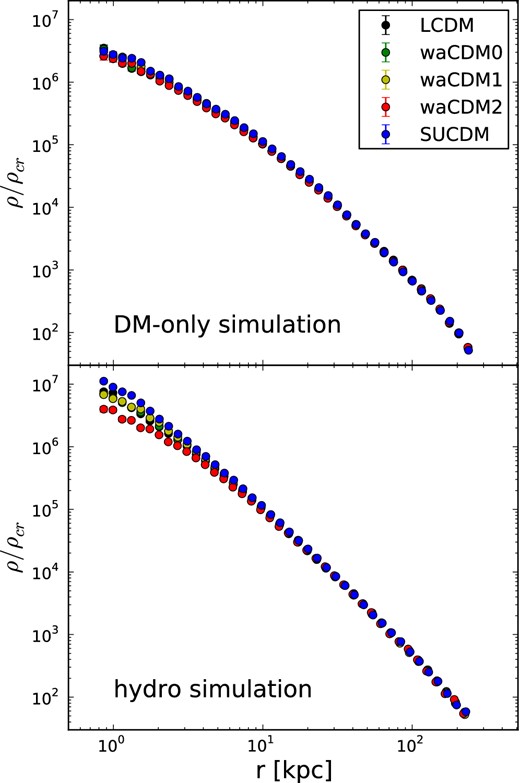
Radial density profile of galα simulated in all five cosmological models, respectively, in a dark matter only (upper panel) and in a hydrodynamical simulation (lower panel). We plot the density in units of critical density, |$\rho _{\rm crit} = \frac{3H_0^2}{8 \pi G}$| with G gravitational constant, as a function of the distance from the centre of mass of the galaxy. Different colours represent different cosmological models.
The lower panel of Fig. 4 shows the radial density profiles of dark matter in hydrodynamical simulations. In contrast to the dark matter-only simulations, the density profiles vary depending on the DE model used.
Fig. 5 sets galα, galβ and galγ in the abundance matching plot at z = 0. The black line represents the prediction obtained by the abundance matching technique (see Moster, Naab & White 2013), and the shaded area represents the errors on the prediction. The abundance matching prediction does not vary from ΛCDM to the other cosmologies since all cosmological models have the same value for σ8 at z = 0. While statistical conclusions are not possible because of the limited sample, the three galaxies show the same trend as a function of cosmology. By simply varying the cosmological model, the change among the three galaxies is of only a few per cent in the dark matter mass, while the stellar mass almost doubles. Galaxies simulated in the waCDM2 cosmology (red symbols) always make the least stars at z = 0, while the galaxies formed in the SUGRA cosmology (blue symbols) always make the most stars. Galaxies formed in a ΛCDM cosmology always lie in the middle. The hierarchy is in agreement with the behaviours of the cosmological background evolutions of these cosmological models (Fig. 2 and Section 1), since we expect more structures to be formed in a cosmological model that begins forming structures earlier.
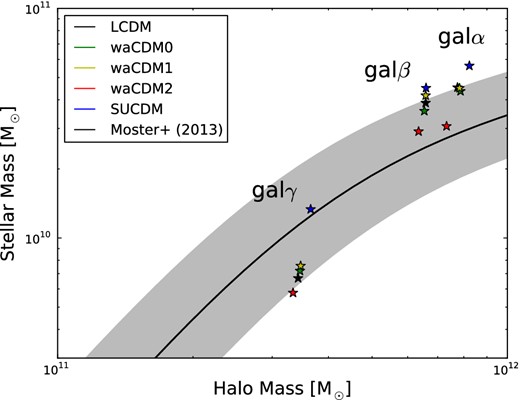
Stellar mass as a function of halo mass at z = 0 for galα, galβ, galγ simulated in all the different cosmologies.
4.2 Evolutions of the M⋆-Mh relationship
Fig. 6 shows how the ratio of stellar mass and total mass evolve with scalefactor a = 1/(z + 1). Each panel relates to a specific galaxy and the different colours describe each galaxy run in a different cosmology. Again, the black solid line represents the expected evolution for a ΛCDM model using the abundance matching technique. The predicted evolutions do change with the change in cosmology, but they all do not distance themselves significantly from the ΛCDM prediction. Hence, out of clarity, we have only plotted the ΛCDM predicted behaviour from abundance matching. As in the z = 0 case, the M⋆-Mh trends for the galaxies simulated in different cosmologies are in agreement with the evolution of their cosmological backgrounds. In the SUCDM cosmology, we expect higher density perturbations to compensate for the faster expansion of the Universe. These higher density perturbations trigger a more efficient star formation (blue lines in Fig. 6). This is in agreement with previous works on SUGRA cosmology (e.g. White 1976; Zhan & Knox 2004; Puchwein et al. 2005; Jing et al. 2006; Maio et al. 2006; Rudd et al. 2008; Casarini et al. 2011b, 2012; De Boni et al. 2011; van Daalen et al. 2011; Fedeli et al. 2012). On the contrary, the waCDM2 galaxy (red lines) always makes less stars throughout its evolution. The cosmological models waCDM0 and waCDM1 are not far apart from the ΛCDM model, in the wa-w0 plane, thus, we would expect galaxies that live in those models not to differ greatly from galaxies that live in the ΛCDM universe. This expectation is nicely reproduced for all three haloes.
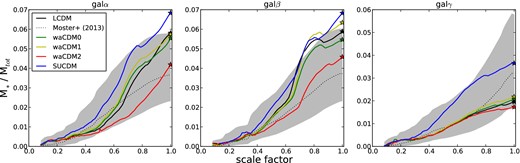
Evolutions of the stellar–halo mass relation as a function of scalefactor for galα, galβ and galγ.
As shown in Fig. 6, it is noticeable how both galα and galβ undergo a significant merger around a = 0.8 which raises their star formation efficiency and increases their dark matter mass. The merger is visible also from the dark matter mass of the haloes as a function of the scalefactor. Fig. 7 shows a clear increase in the dark matter mass due to the accretion of a nearby satellite galaxy.
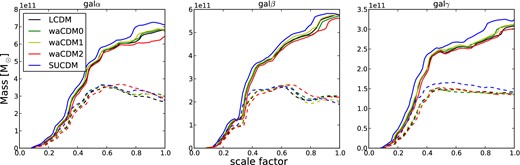
Evolution of the dark matter mass (solid lines) and gas mass (dashed lines) as a function of scalefactor for the for galα, galβ and galγ in all different cosmological models. For an easier comparison, the gas mass was increased of a factor of 5.
4.3 Star formation histories
Fig. 8 shows the SFR as a function of physical time. At z = 0, the different cosmological models show longer or shorter ages of the Universe because how much physical time elapses as the Universe expands depends on the choice of cosmology. The choice of showing the star formation in standard physical units gives more insight.

Star formation histories for galα, galβ and galγ in all the cosmological models.
Fig. 8 shows how DE can suppress and delay star formation. Interestingly, the waCDM2 cosmology (red lines) delays star formation, both in the case of galα and galβ. In all three galaxies, the waCDM2 cosmology drastically suppresses star formation until recent times.
As pointed out in Section 4.2, both galα and galβ undergo a merger. The merger event is clearly marked by the presence of a peak in the SFRs between 7 and 10 Gyr (notice how the peak shifts in time according to the cosmological model). After the star formation burst due to the merger, both galaxies decrease their star formation activity due to the decrease in the amount of available cold gas. This is shown in Fig. 7, where we plot the evolution of the dark matter mass and the cool gas mass (T < 105 K).
In order to compare the effects of dDE on galaxies with different masses, in Fig. 9 we show for each galaxy the ratio of the SFR in a given cosmology and the SFR in ΛCDM (SFR/SFRΛ) for all cosmological models as a function of scalefactor to more easily compare with Fontanot et al. (2012). Fontanot et al. (2012) find a larger difference between cosmological models at high redshifts. In our case, the contribution of cosmology seems not to change significantly with redshifts. The reason for this apparent inconsistency is that, while we are looking at the evolution of an individual object, Fontanot et al. (2012) looked at the evolution of an entire population of galaxies. Clearly, the effect of DE on a single halo has to be convolved with the evolution of the mass function itself. Convolving the two components explains the stronger redshift evolution seen in Fontanot et al. (2012). Furthermore, we note that, given our limited sample, the effect of DE seems not to have a trend with the mass of the galaxy (taken into account cosmic variance).
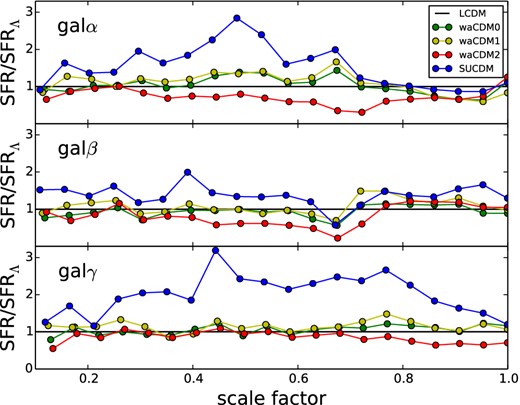
For each galaxy, we show the ratio of SFR/SFRΛ for all cosmological models as a function of scalefactor. The top panel shows galα, the middle panel galβ and the bottom panel galγ.
4.4 Rotation curves
Different star formation histories reflect different matter distributions among the galaxy, as the rotation curves in Fig. 10 show. Galaxies with delayed star formation (waCDM2 cosmology, red lines in Fig. 8) have flatter rotation curves than galaxies where star formation started earlier (SUCDM cosmology, blue lines), see Stinson et al. (2013a). Thus, a galaxy can have a flat or centrally peaked rotation curve based simply on the background cosmology in which it forms.
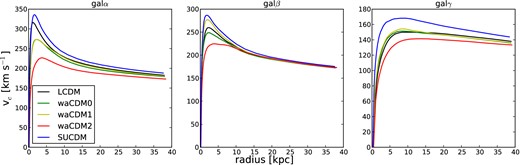
Rotation curves for galα, galβ and galγ in all the cosmological models.
Centrally peaked rotation curves have long been the prime symptom of the overcooling problem in disc galaxy formation simulations, see Scannapieco et al. (2012). In the centres of haloes, the gas density becomes high enough that hot gas starts radiating and consequently cools. In such environments, the cooling process is unstable because, once the hot gas has cooled, it no longer pressure supports the surrounding gas, which then becomes denser and cools. Stars then form in excess and primarily in the central concentration, and they produce peaked rotation curves.
Most solutions have focused on adding energy from stars or AGN (Scannapieco et al. 2012). Stinson et al. (2013a) showed one solution based on stellar winds from massive stars (i.e. ‘ESF’). Our results show that also cosmology can have a considerable effect on flattening rotation curves.
This work shows that simply changing the evolutions of the DE equation of state flattens rotation curves of a considerable and definitely observable amount (i.e. more than 100 km s−1 in both galα and galβ). Fig. 11 compares rotation curves for galα in dark matter-only simulations (upper panel) and in SPH simulations (lower panel) for each cosmological model. The change is striking. While in the dark matter-only case the cosmological models are almost indistinguishable, they become clearly distinguishable in the hydrodynamical simulations.
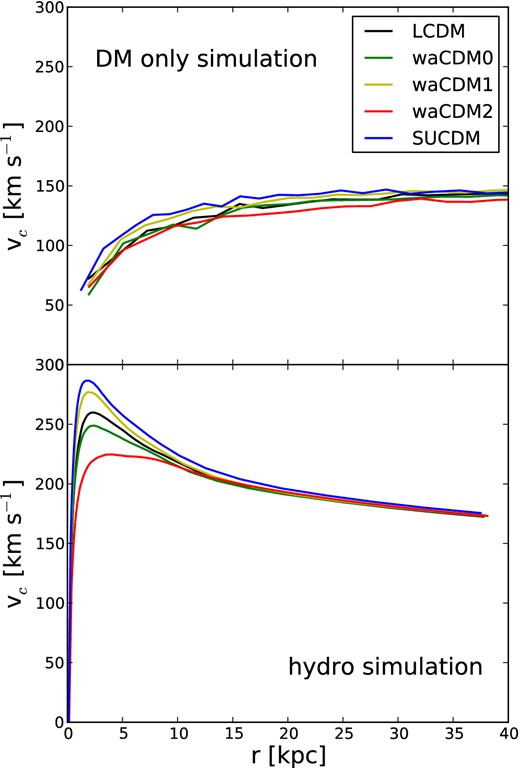
Rotation curve for galα in all different cosmological models, respectively, in a dark matter-only simulation (upper panel) and in a hydrodynamical simulation (lower panel).
Stinson et al. (2013a) show that ESF is a key ingredient to simulate realistic disc galaxies. In particular, ESF can flatten rotation curves. Unexpectedly, at z = 0 the effect of ESF is comparable with the effect of dDE.
4.5 Disc scalelengths
Differences due to cosmologies are also visible in the surface brightness profiles at z = 0, as Fig. 12 shows. Here, we plotted only the two extreme cosmological models out of clarity. As seen in Section 4.3, waCDM2 cosmology (red lines) is able to suppress and delay star formation until low redshifts, when star formation finally starts to increase. In turn, a suppressed and delayed star formation affects the shapes of the surface brightness profiles, especially in the two most massive galaxies. Galα and galβ show steeper profiles in their inner regions (for further discussion on effects of delayed star formation on surface brightness profiles, see Stinson et al. 2013b).
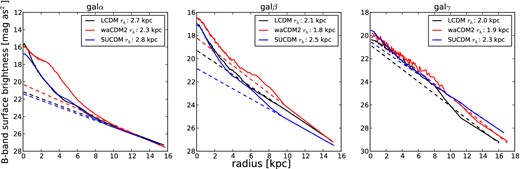
Disc scalelengths for galα, galβ and galγ for ΛCDM , waCDM2 (red lines) and SUGRA (blue lines). For clarity, only these two models are shown.
The rest of the cosmological models do not significantly affect the profiles nor the scalelengths.
4.6 Feedback and cosmology, metallicity interplay
We showed that a model whose universe velocity expansion is slower compared to the one of ΛCDM (e.g. waCDM2, red lines) has a lower star formation till much later times, and on the other hand a model whose universe velocity expansion is faster than ΛCDM (e.g. SUGRA, blue lines) has a higher star formation at all redshifts (see Fig. 8). We can trace back this difference to the fact that all five different cosmological models have the same σ8 today, because, in order for this to happen, structures in a SUGRA model (blue lines) have to start forming earlier. This implies that, at the starting redshift (z = 99 for all simulations), the density perturbations that seeded structure formation had to be slightly bigger in the SUGRA model (blue lines) compared to the initial density perturbations in the waCDM2 model (red lines). Thus, stars will start forming earlier since more gas is accreted and cools.
These differences in the initial perturbations do not significantly affect properties of structures on galactic scales in dark matter-only simulations. On the other hand, the interplay between cooling, metallicity and star formation not only helps differentiating between the cosmological models but also enhances their differences. To highlight the positive feedback star formation has on radiative cooling through metal enrichment, the first three rows of Fig. 13 show the evolution of metallicity as a function of scalefactor for three different regions of galα and galβ, a central 2 kpc sphere (‘bulge’), a disc cylinder with radius 20 and 6 kpc thickness (‘disc’), and a sphere of the size of the Rvir (‘halo’).
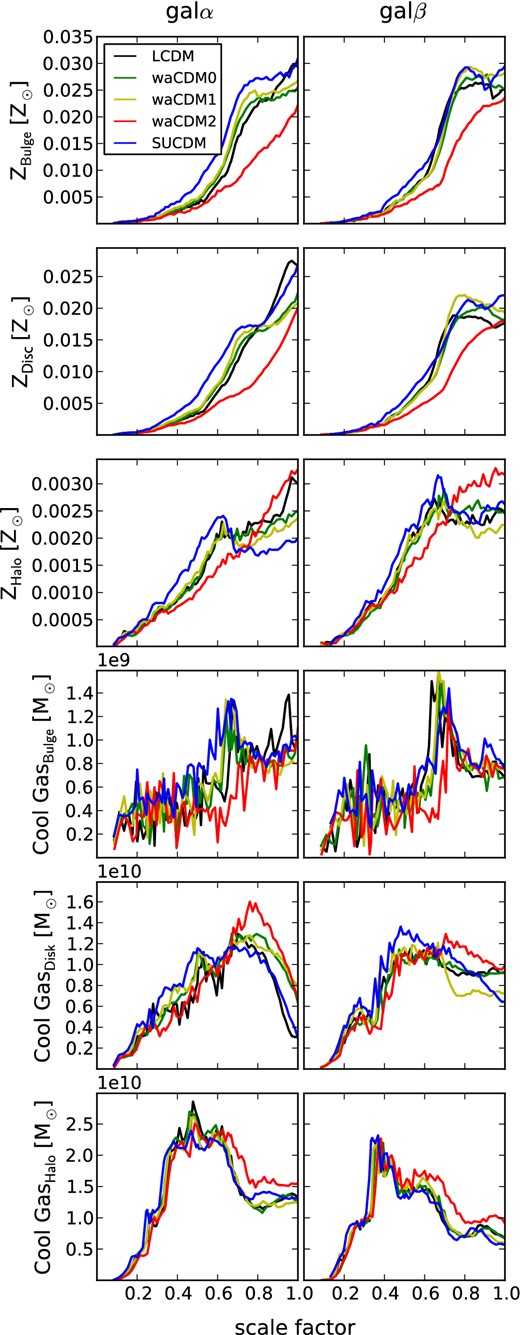
Mean metallicity in solar units and cool gas in solar masses (T < 105 K) for galα and galβ as function of scalefactor in ‘bulge’, ‘disc’ and ‘halo’. Different colours represent different cosmological models.
The waCDM2 model (red) exhibits the lowest metallicity in the bulge and disc throughout its evolution, which reflects its lower SFR and hence lower enrichment rate. The effect of increased metal enrichment is non-linear: the more star formation enriches gas, the faster the gas cools, and the more stars that subsequently form.
The halo metallicity of waCDM2 is also lower throughout most of the galaxy evolution, but becomes higher after a ∼ 0.75, as its mean halo metallicity continues increasing while the metallicity in the other models starts to decrease or flatten out at that time. Both waCDM2 galaxies start to have more metallicity in the halo due to SN explosions being able to move the gas outside from the disc.
Comparing the trends for metallicity, cool gas (Fig. 13) and SFRs (Fig. 8) as functions of scalefactor, we find them in agreement. Because of the lower metallicity, the waCDM2 model (red line) ends up having the least amount of gas that has been able to cool and thus also makes the least amount of stars. Having used up a smaller amount of cold gas at earlier times increases the amount of cold gas left for star formation at late times. The presence of cool gas that has yet not formed stars can be seen in Fig. 13, where after a = 0.7 the disc of the waCDM2 galaxy has the most amount of cool gas compared to the galaxies in the other cosmological models. This is also the case for the galaxy halo, and this is probably due to the cooled gas moved by SN explosions.
4.7 Feedback–DE degeneracy
Along with DE having a profound effect on disc galaxy evolution, galaxy formation strongly depends on how feedback is modelled. The effects of suppressing star formation, and hence flattening rotation curves, can also be obtained by varying the feedback recipes. As shown in Stinson et al. (2013a), pre-SN feedback from massive stars significantly suppresses star formation, which is the same effect seen in the DE model that has the most delayed expansion (waCDM2). For this reason, we wish to explore whether DE or stellar feedback have a greater effect in suppressing star formation and whether their effect changes with redshift.
We select the waCDM2 cosmology (red lines in previous plots), which showed the most star formation suppression and delay, and we resimulate it with a range of stellar feedback strengths. We vary both the SN feedback efficiency and the ESF separately.
First, the ESF is turned from 10 down to 0 per cent efficiency with the standard 1051 erg of SN energy. Then, with 0 ESF, the SN feedback strength is increased to 120 and 150 per cent.
The left-hand panel of Fig. 14 shows each of these variations implemented in the waCDM2 model for galα. The stellar mass evolution shows a strong dependence on the ESF parameter. A decrease from 25 to 7.5 per cent increases the final stellar mass 50 per cent and moves most of the star formation from late to early times. All the simulations with less than 7.5 per cent efficiency, but more than 0 ESF end with nearly the same final stellar mass. What is somewhat surprising is that the simulation with 0 ESF ends with less stellar mass than these intermediate feedback models. Stinson et al. (2013a) also saw this effect and found that it was due to the higher star formation efficiency at early times driving stronger outflows due to the greater SN feedback. Thus, gas was driven to radii where it could not be reaccreted, whereas the ESF does not drive gas so far away.
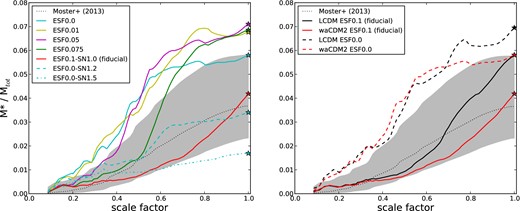
Evolution of stellar–halo mass relation with scalefactor. We are now showing only the case of galα. In the left-hand panel, we have changed the feedback parameters for the waCDM2 run. We have increased the ESF parameter from zero to the fiducial value (see Stinson et al. 2013a) while keeping the SN parameter fixed to the fiducial value of 1.0 (solid lines). We then have changed the SN parameter while keeping the ESF fixed to zero (dashed and dash–dotted cyan lines). The dotted black line is the abundance matching prediction from Moster et al. (2013) and the shaded area its errors. In the right-hand panel, we compare the effect of ESF with the effect of different cosmology, ΛCDM (red and black lines) and waCDM2 (blue and red).
SN feedback unambiguously decreases the amount of stars formed throughout the galaxy's evolution, but can easily push the trends out of the expected behaviours from abundance matching techniques suggesting that SN feedback alone is not enough to reproduce realistic galaxies.
The right-hand panel of Fig. 14 shows a comparison of the stellar mass–halo mass evolution of the waCDM2 model (red lines) with the LCDM model (black lines) for galα. The models separate most notably at late times. The corresponding simulations with no ESF are shown in the dashed lines. They clearly show that both cosmology and pre-SN feedback have a strong effect in suppressing star formation, but while pre-SN feedback has the strongest effect at high redshift, cosmology has the strongest effect more recently (i.e. after a = 0.7).
The degeneracy between feedback and DE parametrizations certainly cannot be disentangled with our limited sample of galaxies, on the other hand Fontanot et al. (2013) pointed out that a possible way to put constraints on dDE models would come from future missions, when we will be able to have more sensitivity at high redshifts.
5 CONCLUSIONS
The intention of this work was to investigate for the first time the effect of DE on galactic scales in SPH simulations. We find that the DE modelling has an unexpected significant effect on disc galaxy formation, on the contrary of what is most commonly believed.
The experiment used a suite of SPH zoom-in cosmological simulations with masses of 3.4 × 10¹¹, 6.6 × 10¹¹ and 7.7 × 10¹¹ M⊙, in four dDE models plus the reference ΛCDM model. The models all employed the same baryonic physics prescription. All dDE models lay in within the 2σ contours given by WMAP7. We examined the dark matter distribution, gas, star and total halo masses, star formation histories, baryonic matter distribution (rotation curves and surface brightness profiles), and the chemical enrichment of the galaxies.
Changing the DE evolution implies changing the expansion rate of the Universe, which in turn affects the accretion history. We show how the same galaxy evolved in different DE cosmologies does not present significant differences in dark matter-only simulations, while in hydrodynamical simulations the galactic properties change greatly.
At z = 0, the stellar mass inside rvir can vary by a factor of 2 depending on cosmology, while the dark matter mass only changes of a few per cent. Thus, baryons amplify differences between DE models, as the evolution of the stellar mass–halo mass ratio shows: by simply changing the DE parametrization, stellar mass either decreases or increase of a factor of 2 throughout the whole galaxy evolution.
The reason why baryons amplify the differences among the various dDE models lies on the non-linear response of the hydrodynamical processes. Once the cosmological model introduces slightly different density perturbations, feedback processes enhances those differences by producing slightly more (or less) stars. More stars introduce more metals in the feedback cycle and more metals decrease the cooling time, which in turn allows gas to cool faster and produce even more stars. Through the highly non-linear response of baryons, DE models that would have been indistinguishable from ΛCDM on galactic scales show distinctive features in SPH simulations.
The distinctive features of dDE become clear when looking at the SFRs. We find that certain DE models are able to both delay and suppress star formation until recent epochs. The delay in star formation is then in turn responsible for the flattening of rotations curves, where we show a change of about 100 km s−1 in the two most massive galaxies we considered. The two most massive galaxies living in a slower expanding universe (waCDM2 model) have steeper surface brightness profiles due to their delayed star formation.
Finally, we compare the effect of dDE with the effect of baryonic feedback. We keep the cosmology fixed (waCDM2) and change the feedback parametrization. Provided that the SN feedback is kept constant, at late times the effect of DE is comparable to the effect of ESF (see Stinson et al. 2013a for details on feedback modelling). Even the degree at which stellar feedback is able to flatten rotation curves is comparable to the effect of DE. We noted, on the other hand, that in order to obtain the behaviour suggested by abundance matching considerations at high redshifts, ESF had to be introduced since at high redshifts it has the most important effect compared to the DE modelling.
Having shown that the DE modelling has an important effect on disc galaxy formation and evolution, we would like to stress on the fact that, especially in the era of high-precision cosmology, the details on DE do matter and certainly need further investigations.
The analysis was performed using the pynbody package (http://code.google.com/p/pynbody), which was written by Andrew Pontzen and Rok Roškar in addition to the authors. LC acknowledges the Brazilian research Institutions FAPES and CNPq for financial support.
The numerical simulations used in this work were performed on the THEO cluster of the Max-Planck-Institut für Astronomie at the Rechenzentrum in Garching. And AM would like to acknowledge the support from the Sonderforschungsbereich SFB 881 ‘the Milky Way System’ of the German Research Foundation (DFG). GS received funding from the European Research Council under the European Union's Seventh Framework Programme (FP 7) ERC Grant Agreement no. [321035].
