


Abstract
An analytical framework is presented to understand the effects of a fluctuating intensity of the cosmic ionizing background on the correlations of the Lyα forest transmission fraction measured in quasar spectra. In the absence of intensity fluctuations, the Lyα power spectrum should have the expected cold dark matter power spectrum with redshift distortions in the linear regime, with a bias factor bδ and a redshift distortion parameter β that depend on redshift but are independent of scale. The intensity fluctuations introduce a scale dependence in both bδ and β, but keeping their product bδβ fixed. Observations of the Lyα correlations and cross-correlations with radiation sources like those being done at present in the Baryon Oscillation Spectroscopic Survey of Sloan Digital Sky Survey third generation have the potential to measure this scale dependence, which reflects the biasing properties of the sources and absorbers of the ionizing background. We also compute a second term affecting the Lyα spectrum, due to shot noise in the sources of radiation. This term is very large if luminous quasars are assumed to produce the ionizing background and to emit isotropically with a constant luminosity, but should be reduced by a contribution from galaxies, and by the finite lifetime and anisotropic emission of quasars.
1 INTRODUCTION
The Lyα forest absorption measured in spectra of high-redshift quasars has now been established as a powerful tracer of large-scale structure. Assuming that the intrinsic continuum spectrum of the observed quasar can be accurately modelled, then the observed flux divided by the fitted continuum yields the transmitted fraction, F = e− τ (where τ is the optical depth), at every wavelength pixel. This one-dimensional map that is obtained from the spectrum of every observed source is related (neglecting the contamination by metal lines) to the gas density, temperature and peculiar velocity of the hydrogen gas in the intergalactic medium that is intercepted by the line of sight.
After the initial measurements of the Lyα power spectrum along the line of sight from individual spectra (Croft et al. 1998, 1999, 2002; McDonald et al. 2000, 2006), the first determination of the power spectrum of the Lyα forest in three-dimensional redshift space came with the Baryon Oscillation Spectroscopic Survey (BOSS) of Sloan Digital Sky Survey third generation (SDSS-III; Eisenstein et al. 2011; Dawson et al. 2013). Analysis of the first 14 000 quasars led to the detection of redshift space distortions (Slosar et al. 2011), as expected in a simple biased linear theory where the Lyα power spectrum follows that of the dark matter with two bias parameters, reflecting the large-scale variation of the mean Lyα transmission with the fluctuation in the mean mass density and peculiar velocity gradient.
However, large-scale fluctuations in the Lyα forest can also be affected by variations in the intensity of the ionizing background radiation, as well as the imprint that reionization may have left on the gas temperature distribution as a function of gas density. These effects have been studied and discussed by several authors in the past. Analytic models of randomly distributed sources were considered by Zuo (1992), and numerical realizations of random sources to compute the fluctuation properties of the ionizing background were used in several subsequent papers (Croft et al. 1999; Croft 2004; Meiksin & White 2004; McDonald et al. 2005; Slosar et al. 2009; White et al. 2010). The impacts of these ionizing background fluctuations on the Lyα forest were found to be generally small compared to the intrinsic Lyα forest fluctuations due to the large-scale structure of the mass distribution. However, as pointed out in the early work of Croft et al. (1999), the long mean free path of ionizing radiation in the intergalactic medium at z ∼ 3 implies that the fluctuations induced by the ionizing background can become relatively more important in the limit of very large scales. These large scales are now becoming highly relevant with the recent detections of the baryon acoustic oscillation (BAO) peak in the Lyα forest (Busca et al. 2013; Slosar et al. 2013; Delubac et al. 2014; Font-Ribera et al. 2014).
In this paper, we reanalyse with an analytic method the impact of large-scale fluctuations in the ionizing radiation intensity and the gas temperature–density relation on the observable redshift space Lyα power spectrum. There are two independent effects on the power spectrum. The first arises from the clustering of sources and absorbers of radiation, which are assumed to trace the large-scale mass density fluctuations, each with their own bias factor. This clustering term is independent of the luminosity function, variability and anisotropic emission of the sources, as well as the size or other geometric properties of the absorbers: it depends only on how the density of sources and absorbers follow the underlying large-scale structure. The second effect is due to the fluctuations in the radiation intensity that arises from shot noise in the number of sources. This second term is independent of the source clustering, but depends on other source characteristics like the luminosity function. An analytical framework to treat these contributions to the Lyα power spectrum is described in Section 2, and results for simple illustrating models are presented in Section 3, with a discussion and conclusions in Section 4. We use a cold dark matter cosmological model with parameter values that are consistent with Ade, Efstathiou, Planck Collaboration (2014): H0 = 67.3 km s−1 Mpc−1, baryon density Ωb h2 = 0.022 05, Ωm = 0.315, ns = 0.96 and σ8 = 0.856.
As this paper was being finalized, we became aware of the work by Pontzen (2014), presenting very similar ideas as here. We mention in Section 4 the similarities and differences between the two papers.
2 ANALYTIC FORMALISM
2.1 Source clustering
We assume that the sources of the ionizing background have a spatial distribution tracing the mass density field, with a bias factor bs, so the mean large-scale overdensity of sources is δs = bsδ. In addition, the ionizing radiation is being absorbed by a population of absorbers, which are Lyman limit systems as well as absorption systems with Lyman continuum optical depths below unity that have a comparable contribution to the overall absorption. This population of absorbers has a large-scale distribution that is affected by both the underlying mass density fluctuations and the radiation intensity fluctuations. So, the absorber density fluctuation can be written as |$\delta _{\rm a} = b_{\rm a}\delta + b_{\rm a}^{\prime }\delta _{\Gamma }$|. We expect these absorbers to increase in high-density regions and decrease in response to an increased ionizing intensity, so ba should be positive and |$b_{\rm a}^{\prime }$| should be negative.
Therefore, the effect of the photoionization rate fluctuations that is induced by the clustering of sources and absorbers is to modify the bias factor and redshift distortion parameter in the power spectrum, replacing them with the effective values |$b_\delta ^{\prime }$| and β′ that are scale dependent, while their product |$b_\delta ^{\prime }\beta ^{\prime }=b_\delta \beta$| remains fixed. At small scales, W is very small and the bias factor has its usual value |$b^{\prime }_{\delta }=b_{\delta }$|. But in the limit of large scales, W approaches unity and |$b_{\delta }^{\prime }$| reaches the asymptotic value of |$b_{\delta }+b_{\Gamma }(b_{\rm s}-b_{\rm a})/(1+b_{\rm a}^{\prime })$|.
We now interpret physically the variation of the effective bias |$b_\delta ^{\prime }$| with the Fourier scale k. We mention first that any realistic model for the absorbers needs to have |$0 > b_{\rm a}^{\prime } > -1$|: the density of absorbers (which we identify with the observed population of Lyman limit systems, as well as lower column density systems that also contribute to the global absorption of ionizing photons) needs to decrease with |$\delta _\Gamma$| as the increased photoionization reduces the size of the absorbing regions, but the relative fluctuation in absorbers cannot be reduced faster than that in the ionizing intensity because this would imply a runaway unstable process where any slight increase in emission leads to an arbitrarily large increase in the mean free path and the ionizing intensity as the absorbers are completely ionized. Moreover, the sign of bδ is negative while that of bΓ is positive, so if bs > ba, the effective bias factor |$b_{\delta }^{\prime }$| decreases in absolute value with scale. The simple interpretation is that on scales larger as compared to the mean free path of ionizing photons, denser regions also have a greater ionizing intensity, and so the corresponding increase of Lyα absorption that is caused by the higher density is reduced. If |$b_\Gamma (b_{\rm s}-b_{\rm a})/(1+b_{\rm a}^{\prime })$| is larger than −bδ, then the value of |$b_\delta ^{\prime }$| is actually positive in the limit of large scales. Ignoring for now the effect of the peculiar velocity gradient (we return to this in Section 3), this means that the effect of the higher ionizing intensity overwhelms that of the higher mass density, causing denser regions to have an increased Lyα transmission (or reduced absorption), opposite to the behaviour on small scales. In this case, there needs to be a critical scale kr where |$b_\delta ^{\prime }$| has a root, and the only surviving term for the power spectrum in equation (11) is |$P_\alpha (k_r)= P_{\rm L}(k_r) (b_\delta \beta \mu _k^2)^2$|. In practice, the power spectrum near μk = 0 can never quite go down to zero owing to the shot noise from individual sources of radiation, as discussed below, as well as non-linear effects from small scales which we are not including here, but a change of sign of |$b_\delta ^{\prime }$| as a function of scale still implies the presence of a dip in the power spectrum at small μk which should be measurable in the observations.
2.2 Shot noise from individual sources
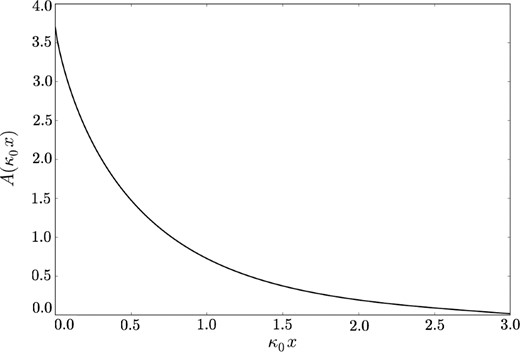
The dimensionless function A defined in equation (19), giving the shape of the intensity correlation function due to a set of randomly distributed, isotropic and constant sources of radiation.
Apart from the effect of galaxies, the amplitude of the intensity correlation function contributed by shot noise from the observed quasars that is obtained from equation (18) ought to be considered as an upper limit only. The reason is that real quasars are likely to emit anisotropically and to be highly variable in their luminosity on the light-crossing time of the cosmological scales at which the correlations are being measured. The effects of the variability and anisotropy of the emission from individual quasars can be highly complex and difficult to model, but an order-of-magnitude estimate can be made by assuming the opposite limit in which quasars emit in very narrow cones and short bursts. If |$f_\Omega$| is the fraction of the solid angle over which the light of a quasar is emitted, ft is the fraction of time during which a quasar is shining and we assume that the quasar luminosity is zero outside of this fraction of solid angle and time, then the correlation function |$\xi _\Gamma$| in equation (18) is reduced by a factor |$f_\Omega f_{\rm t}$|, because assuming that a source is being observed at a point |${\boldsymbol r}=0$|, the probability that it is also observed at a point |${\boldsymbol x}$| with the same luminosity is only |$f_\Omega f_{\rm t}$|.
The total correlation function of the Lyα transmission is equal to the sum of the term due to source clustering, from equation (11), and the shot noise term in equation (18) multiplied by |$b_\Gamma ^2$|.
2.3 Values of the bias parameters
We now discuss how the values of the various bias parameters that have appeared in our derivation of the radiation effects in the Lyα correlation function can be estimated. All the bias factors should generally depend on redshift, and our discussion here will be focused at z = 2.25, the redshift near which the observations of Lyα correlations have so far been done with the BOSS survey.
The values of bδ and bη have to be measured observationally. They are related to the redshift distortion parameter by β = f(Ωm)bη/bδ (Kaiser 1987). Measurements from the Lyα forest correlation in the scale range 10-60 h− 1 Mpc in Slosar et al. (2011) resulted in a good measurement of bδ(1 + β) = −0.336 ± 0.012 at z = 2.25, with a more poorly constrained β ∼ 1. We shall assume β = 1, which is also favoured by the measurement of cross-correlations (see Font-Ribera et al. 2012b, 2013), and bδ = −0.17 (so bη = βbδ/f(Ωm) ≃ −0.17; note that the negative sign of bδ and bη results from the convention that δα is a transmission fluctuation, which is therefore negative when the mass density perturbation is positive). These observational results may change in the future since they were obtained by neglecting the radiation effects that are examined here, and they are subject to other possible systematic errors (e.g. Font-Ribera & Miralda-Escudé 2012a).
For the bias of the sources, quasars have had their bias factor measured from their autocorrelation (White et al. 2012, and references therein) and cross-correlation with the Lyα forest (Font-Ribera et al. 2013), resulting in values in the range 3.5–4. The actual bias of the sources, however, depends also on the contribution that galaxies make to the ionizing background intensity and on the bias factor of these galaxies. If the bias factors of quasars and galaxies are bq and bg, then bs = (ϵqbq + ϵgbg)/(ϵq + ϵg). Galaxies are on average associated with lower mass haloes than quasars, so their bias factor should be smaller and therefore bs should be lower than bq.
The population of absorbers determining the mean free path of the ionizing radiation is dominated by systems that have an optical depth of order unity at the Lyman limit, with column densities ∼ 1.6 × 1017 cm− 2. Note that only systems with column densities above this value are usually referred to as Lyman limit systems, but absorbers of lower column density are about equally important (e.g. Miralda-Escudé & Ostriker 1990; Haardt & Madau 1996). The bias factor has only been measured for systems of higher column densities, the damped Lyα systems (Font-Ribera et al. 2012b), and a value ba ≃ 2 was obtained. Lyman limit systems are of lower column density than the damped systems but they should have a similar bias factor if haloes of all masses give rise to the same distribution of hydrogen column densities, depending on the impact parameter. However, a population of low-mass haloes might exist in which the self-shielded gas does not reach as high column densities as in high-mass haloes, which would then reduce the mean bias factor of the Lyman limit systems. Both bs and ba are therefore rather uncertain. The effective Lyα forest bias depends only on the difference bs − ba (see equation 12), for which we shall assume a fiducial value bs − ba = 1.
Finally, the bias factor controlling the response of the absorbers to changes in the ionizing intensity can be related to the column density distribution of Lyman limit systems, which we model as a power law, |$f(N_{{\rm H\,{\small i}}}) \, {\rm d}N_{{\rm H\,{\small i}}}\propto N_{{\rm H\,{\small i}}}^{-a}\, {\rm d}N_{{\rm H\,{\small i}}}$|. This implies a radial profile of the column density in spherical haloes |$N_{{\rm H\,{\small i}}}\propto r^{2/(1-a)}$|. In photoionization equilibrium, the column density at a fixed radius r outside the region where the gas starts to self-shield will vary in proportion to the inverse of the photoionization rate. The self-shielding radius rs occurs at a fixed column density, and will therefore change as rs∝Γ(1 − a)/2 in response to a change of the external ionizing intensity. The cross-section to produce a Lyman limit system scales as |$r_{\rm s}^2$|, so the number of absorbers that are intercepted per unit length should scale as Γ1 − a. For small changes in Γ, this implies a bias factor |$b_{\rm a}^{\prime }=1-a$|. We shall use here a = 5/3 (the value corresponding to a gas density profile ρg∝r− 2, and |$N_{_{{\rm H\,{\small i}}}}\propto r^{-3}$|), and therefore |$b_{\rm a}^{\prime }=-2/3$|.
With the values we adopt here for the fiducial model, the value of |$b_\delta ^{\prime }(k)$| in equation (12) is plotted in the left-hand panel of Fig. 2 as the solid line. Here and in the rest of the paper, we use a mean free path λ0 = 300 h−1 Mpc as our fiducial value. Observational estimates of the mean free path of an ionizing photon for being absorbed by hydrogen in the intergalactic medium or Lyman limit systems give a value λ0 ≃ 350 h−1 Mpc (Rudie et al. 2013). Our approximate treatment in Section 2.2 neglects the redshift of the photons, which effectively acts in the same way as an additional source of opacity with a comoving mean free path of the order of the horizon, c(1 + z)/H(z) ≃ 3000 h−1 Mpc. The effective overall mean free path is therefore close to our fiducial value of 300 h−1 Mpc.
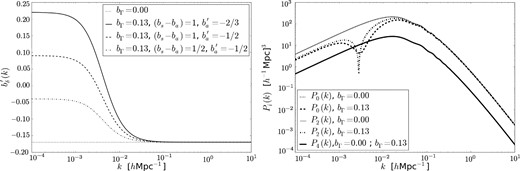
Effective bias (left) and power spectrum (right) of the Lyα forest, for several values of the bias parameters regulating the clustering strength of sources minus absorbers (bs − ba) and the response of the absorbers to the ionizing intensity (|$b_{\rm a}^{\prime }$|). The dotted line is for no radiation effects, and the solid line in the left-hand panel is for our fiducial radiation model. The mean free path is fixed to λ0 = 300 h−1 Mpc. The right-hand panel shows the monopole, quadrupole and hexadecapole of the power spectrum, for the cases of no radiation fluctuations and for our fiducial radiation model.
The two other curves in Fig. 2 are for variations of the bias values that will be used in Section 3. For our fiducial model, |$b_\delta ^{\prime }(k)$| is positive in the limit of large scales and negative at small scales, and therefore changes sign at a critical scale kr. Depending on the uncertain values of all the bias factors we have discussed, this critical scale can have very different values, and is likely to vary substantially with redshift.
2.4 Fluctuations due to helium reionization
In addition to the intensity of the ionizing background, the intergalactic medium may be affected by other physical elements that are correlated over large scales. Here, we consider as another possibility the imprint that may have been left by helium reionization in the temperature of the intergalactic gas. At the mean baryonic density of the universe, the recombination time at z = 2.25 is much longer than the age of the universe, and so is the cooling time of photoionized gas. As helium is doubly ionized for the first time, probably by luminous quasars at z ≃ 3 (Worseck et al. 2011, and references therein), the gas is heated to a spatially variable temperature depending on the spectrum and luminosity of the sources producing the ionization fronts that eventually overlap when reionization ends (e.g. Miralda-Escudé & Rees 1994; McQuinn et al. 2009). The long cooling time then implies that the gas temperature at every spatial location may keep a memory of the time at which helium reionization occurred, or the spectral shape of the sources, or other characteristics that were imprinted at the reionization time. If the temperature fluctuates according to δT = bTδΓe, where δΓe is an intensity fluctuation of the He ii-ionizing radiation that was present at the reionization time arising from sources that may long have been dead, then the observed Lyα transmission in hydrogen would vary as δα = beδΓe owing to the dependence of the recombination coefficient on temperature, which follows the approximate relation αrec(T)∝T− 0.7. Using similar arguments as in Section 2.3 for deriving bΓ, we can infer that |$b_{\rm e} = 0.7 b_\Gamma b_T$|.
3 RESULTS
As shown in the left-hand panel of Fig. 2, the bias factor |$b_\delta ^{\prime }(k)$| in our fiducial radiation model changes sign at a critical scale kr ≃ 0.005 h Mpc−1. The monopole, quadrupole and hexadecapole of the power spectrum are well defined and non-zero at k = kr because |$b_\delta ^{\prime } \beta ^{\prime }$| is constant. At k < kr, the redshift distortion parameter β′(k) is negative. While the monopole is always positive for any value of β′, the quadrupole is zero when β′(k) = −7/3, and becomes negative at small k, when −7/3 < β′ < 0. This is seen in the right-hand panel of Fig. 2, where the monopole, quadrupole and hexadecapole of the power spectrum are shown for the no radiation case, and the case that includes the source clustering effect for our fiducial values of the radiation bias parameters (the power spectrum is computed for the cold dark matter model with the parameters mentioned in the Introduction; all results for power spectra and correlation functions in this paper are shown at z = 2.25). The monopole has a dip near k = kr, and the quadrupole has a root at the slightly smaller value of k where β′ = −7/3. The reason for this behaviour is that when |$b_\delta ^{\prime }$| is negative on large scales, high-density regions produce reduced absorption owing to the larger ionizing intensity that overwhelms the gas density effect, but the gradient of peculiar velocity counteracts that, resulting in a negative quadrupole for the power spectrum.
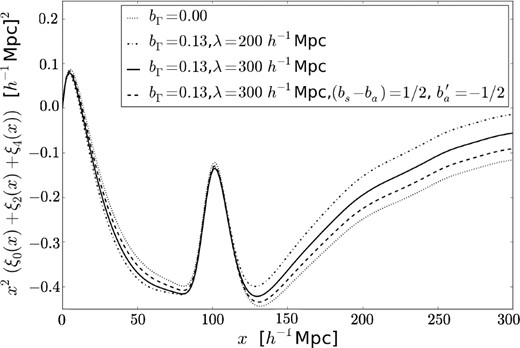
The monopole and quadrupole terms in the Lyα correlation for our fiducial case of the values of the bias parameters discussed in Section 2.3 are shown in the two panels of Fig. 3, multiplied for convenience by x2. The dotted line is for a uniform ionizing background. The well-known BAO peak appears at its characteristic scale of ∼100 h−1 Mpc. The dashed, solid and dash–dotted lines include the source clustering effect, with no shot noise, for three different values of the comoving mean free path: 200, 300 and 400 h−1 Mpc (our fiducial value used in all other figures is λ0 = 300 h−1 Mpc). This mean free path decreases rapidly with redshift, which should change the way that intensity fluctuations modify the correlation function as the redshift increases.
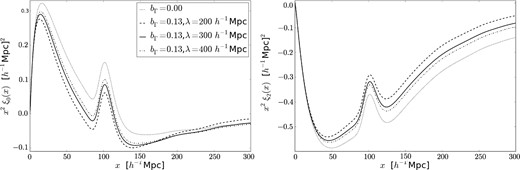
Monopole (ℓ = 0, left) and quadrupole (ℓ = 2, right) of the Lyα autocorrelation function. The dotted line is with no radiation effects, and the other three lines include them with our fiducial value of the bias factors in Section 2.3 and three different values of the mean free path.
The radiation from clustered sources adds a broad-band term that is negative in the monopole and positive in the quadrupole. This is because the absolute value of the bias |$b_\delta ^{\prime }$| in equation (12) is reduced at scales smaller as compared to λ0, as long as bs > ba. The shorter the mean free path, the larger the radiation effects. On scales larger than the mean free path, the impact of the radiation on the monopole becomes positive. The effects are predicted to be relatively large, and they should be measurable as long as the broad-band shape can be retrieved from the data without substantial systematic errors caused by the quasar continuum fitting operation. In the observations reported so far, broad-band terms were marginalized (Busca et al. 2013; Slosar et al. 2013; Font-Ribera et al. 2014) and therefore the effect of the ionizing intensity fluctuations would not have been detected. Note that the position of the BAO peak is practically not affected; even if the peak shifts by a small amount owing to the addition of the radiation effects, any such shift should be further reduced when fitting with a parametrized broad-band term.
Fig. 4 shows how the radiation effects vary with some of the bias parameters (again, with the monopole on the left-hand panel and the quadrupole on the right-hand panel). The dotted line (no radiation effects) and the solid line (for the fiducial values of the bias parameters in Section 2.3) are the same as in Fig. 3. The dashed line shows that the radiation effect is very insensitive to |$b_{\rm a}^{\prime }$| on scales smaller as compared to λ0. The dash–dotted line has a reduced value of bs − ba, and shows that the radiation effect is basically proportional to this bias difference between sources and absorbers.
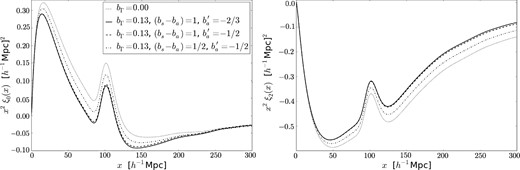
Monopole (left) and quadrupole (right) of the Lyα autocorrelation function, for different values of the bias parameters regulating the clustering strength of sources minus absorbers (bs − ba) and the response of the absorbers to the ionizing intensity (|$b_{\rm a}^{\prime }$|). The dotted line is with no radiation effects. The mean free is fixed to λ0 = 300 h−1 Mpc.
Observations of the correlation function (or one-dimensional power spectrum) can also be done exclusively on the line of sight (McDonald et al. 2006; Palanque-Delabrouille et al. 2013). The correlation function along the line of sight is equal to the sum of all the multipoles. The result is shown in Fig. 5 for some of the same models shown in Figs 3 and 4. This figure shows that the correlation along the line of sight on scales smaller as compared to the mean free path is much less affected by the radiation fluctuations than the three-dimensional correlation.
The sum of the monopole, quadrupole and hexadecapole of the Lyα autocorrelation function. The dotted and solid lines are as in Figs 2 and 3. The dash–dotted line changes the mean free path to 200 h−1 Mpc, and the dashed line shows the effect of changing the bias parameters from our fiducial model to the values indicated in the legend.
A simple model for the possible helium effect on the monopole of the correlation function, computed as explained in Section 2.4, has been included in the dashed line in Fig. 6. We have assumed a mean free path for the helium reionization influence on the gas temperature of |$\lambda _{0{\rm e}}= \kappa _{0{\rm e}}^{-1}=30 \, h^{-1}\, {\rm Mpc}$|, and a relation between the gas temperature fluctuation and helium-ionizing intensity fluctuation of bT = 0.1, implying be = 0.0084 (see Section 2.4). The small value that we estimate for this bias factor means that the effect from the imprint on the gas temperature that may be left from double helium reionization is very small, even with a much smaller mean free path than for the case of hydrogen. However, the effects might be more substantial if different spectra of the ionizing sources in regions of different density gave rise to a larger variation of gas temperature than our assumed value bT = 0.1.
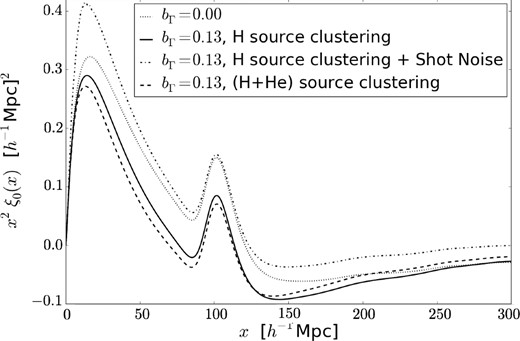
Monopole of the Lyα autocorrelation function. The dotted and solid lines are the same as in Figs 2 and 3. The dashed line includes the effect of helium reionization, assuming an influence on the gas temperature with an effective mean free path λ0e = 30 h− 1 Mpc. The dash–dotted line shows the effect of adding the shot noise from individual sources, multiplied by a reduction factor as explained in the text.
The result in Fig. 6 shows that the shot noise can be a large and highly significant effect. Clearly, the case of constant and isotropic quasars was already ruled out by the observations of Slosar et al. (2011), which showed that the correlation function was well fitted by the linear approximation that generalizes the redshift distortion effects (Kaiser 1987) to the Lyα forest. Even with a large reduction of the shot noise term, the effects are likely to be comparable to the source and absorber clustering term, and this will make the interpretation of any observed differences from linear theory to be complicated. One can hope, nevertheless, that by combining a detailed observation of the monopole and quadrupole terms, and using joint constraints from cross-correlations of the Lyα forest with quasars and other objects in addition to the Lyα autocorrelation, the impact of the biasing of sources and absorbers and the shot noise from a complex population of ionizing sources can be disentangled in the future.
4 DISCUSSION AND CONCLUSIONS
The first observational determination of the large-scale Lyα power spectrum in redshift space by Slosar et al. (2011) showed remarkably good agreement with the simple linear theory of redshift space distortions with the cold dark matter power spectrum. The same conclusion was reached from measurements of the cross-correlations with damped Lyα systems and quasars (Font-Ribera et al. 2012b, 2013). However, the ionizing intensity fluctuations should have an impact on these correlations. We have presented an analytical framework in this paper to model these effects in the Lyα autocorrelation, which can also be easily generalized to the cross-correlation with quasars or other objects, assuming they contribute as sources of the ionizing background. Our conclusion from the results obtained in a few illustrating cases is that both the clustering term that measures how sources and absorbers of the ionizing background trace the mass density fluctuations, and the shot noise term that depends on the luminosity function and other properties of the sources, have an important and measurable effect on the monopole and quadrupole of the Lyα autocorrelation. A substantial broad-band term is added as a contamination to this autocorrelation, which is being marginalized over in present studies that are focused on inferring the scale of the BAO peak (Busca et al. 2013; Slosar et al. 2013). As the modelling of the spectral calibration and quasar continua and the accuracy of the Lyα correlation measurements in BOSS and upcoming surveys improve in the future, we can look forward to a detection of the broad-band terms induced by radiation fluctuations discussed in this paper.
There are several parameters that are important in determining how the Lyα correlation is modified by intensity fluctuations. These are the quantities appearing in equation (12) for the effective Lyα bias factor, and the mean free path of ionizing photons. The additional shot noise term is also dependent on many characteristics of the sources: the luminosity function, luminosity history and emission anisotropy. Disentangling all these effects from a detailed measurement and model fit to the redshift space autocorrelations and cross-correlations will probably be a difficult challenge. However, if the emission properties and typical luminosity histories of quasars can be well understood from an accurate determination of the quasar–Lyα cross-correlation, it should be possible to model the shot noise contribution to the autocorrelation and to infer from the observations some constraints on the biasing terms that affect the source clustering term. It is also worth noting that in the Lyα power spectrum, the term proportional to |$\mu _k^4$| is affected by neither the source clustering nor shot noise effects, and the other two terms proportional to |$\mu _k^2$| and independent of μk can in principle be used to separate the influence of the source clustering and shot noise effects (the term proportional to |$\mu _k^2$| is not affected by shot noise for constant and isotropic sources, but would acquire a contribution for anisotropic and variable sources). The three-dimensional Lyα power spectrum therefore provides a way of separating the radiation influences by separating the multipole terms, which are predicted to have the specific features near the scale of the mean free path shown in Fig. 2 and can then be compared to constraints obtained from cross-correlations.
The conclusions of our work are in agreement with those of Pontzen (2014), who has presented very similar ideas with a somewhat different mathematical treatment. There are a few differences in the way that absorbers are treated, and our incorporation of the redshift distortion effects allows us to predict the different behaviour of the monopole and quadrupole terms in the Lyα power spectrum, but the basic conclusions of the two papers are similar.
While the radiation intensity fluctuations make the large-scale Lyα forest correlations substantially more difficult to interpret as a tracer of the primordial fluctuations in the universe, these complications practically do not affect the measurement of the BAO scale, and they should constitute a new motivation for studying the evolution of the source and absorber population of the ionizing background.
SGG thanks the APC, especially the ‘Cosmology & Gravitation’ group, for their hospitality during part of the time when this work was being carried out. We also thank David Kirkby, Pat McDonald and Andrew Pontzen for stimulating discussions and for sharing their work on this subject. This work is supported in part by Spanish grant AYA-2012-33938.
