


Abstract
Motivated by possible observations of the black hole candidate in the centre of our Galaxy and the galaxy M87, ray-tracing methods are applied to both standard General Relativity (GR) and a recently proposed extension, the pseudo-complex GR (pc-GR). The correction terms due to the investigated pc-GR model lead to slower orbital motions close to massive objects. Also the concept of an innermost stable circular orbit is modified for the pc-GR model, allowing particles to get closer to the central object for most values of the spin parameter a than in GR. Thus, the accretion disc, surrounding a massive object, is brighter in pc-GR than in GR. Iron Kα emission-line profiles are also calculated as those are good observables for regions of strong gravity. Differences between the two theories are pointed out.
1 INTRODUCTION
Taking a picture of a black hole is not possible as long as an ambient light source is missing. However, we can image a black hole and its strong gravitational effects by following light rays coming from a source near the black hole. A powerful standard technique is called ray-tracing. The basic idea is to follow light rays (on null geodesics) in a curved background space–time from their point of emission, e.g. in an accretion disc, around a massive object.1 In this way, one can create an image of the black holes direct neighbourhood. There are numerous groups using ray-tracing for this purpose, see, e.g., Fanton et al. (1997), Müller & Camenzind (2004), Vincent et al. (2011) and Bambi & Malafarina (2013). Aside from an image of the black hole, it is also possible to calculate emission-line profiles using the same technique, but adding in a second step the evaluation of an integral for the spectral flux. This is of particular interest as the emission profile of, e.g., the iron Kα line is one of the few good observables in regions with strong gravitation.
In the near future, it will be possible to resolve the central massive object Sagittarius A* in the centre of our Galaxy (Eisenhauer et al. 2011; Gillessen et al. 2012) and the one in M87 with the planned Event Horizon Telescope (Doeleman et al. 2009; Falcke et al. 2012). This offers a great opportunity to test General Relativity (GR) and its predictions.
Predicting the expected picture from theory gets even more important, noting that during 2013/2014 a gas cloud approaches close to the centre of our Galaxy (Gillessen et al. 2012) and probably a portion of it may become part of an accretion disc. Once formed, we assume it also may exhibit hot spots, seen as quasi-periodic oscillations (QPOs) (Belloni, Méndez & Homan 2005) with the possibility to measure the iron Kα line. This gives the chance to test a theory, measuring the periodicity of the QPO and simultaneously the redshift.
Recently, in Hess & Greiner (2009) and Caspar et al. (2012), a pseudo-complex extension to GR (pc-GR) was proposed, which adds to the usual coupling of mass to the geometry of space as a new ingredient the presence of a dark energy fluid with negative energy density. The resulting changes to Einstein's equations could also be obtained by introducing a non-vanishing energy momentum tensor in standard GR but arise more naturally when using a pc-description. By another group, in Visser (1996), the coupling of the mass to the local quantum property of vacuum fluctuations was investigated, applying semi-classical quantum mechanics, where the decline of the energy density is dominated by a 1/r6 behaviour. However, in Visser (1996), no recoupling to the metric was considered. In pc-GR, the recoupling to the metric is automatically included and the energy density is modelled to decline as 1/r5; however, there is no microscopical description for the dark energy yet. The fall-off of the order of 1/r5 can neither be noted yet by Solar system experiments (Will 2006) nor in systems of two orbiting neutron stars (Hulse & Taylor 1975). A model description of the Hulse–Taylor binary, including pc-GR terms, showed that corrections become significant 12 orders of magnitude beyond current accuracy. Other models concerning the physics of neutron stars are currently prepared for publication (Rodríguez et al. 2014).
The effects of the dark energy become important near the Schwarzschild radius of a compact object towards smaller radial distances. A parameter B = bm3 is introduced, which defines the coupling of the mass with the vacuum fluctuations. In contrast to the work by Visser (1996), the coupling of the mass to vacuum fluctuations on a macroscopical level, described with the parameter B, allows us to include alterations to the metric. A downside is that this modification yet lacks a complete microscopical description; thus, one can see the work by Visser (1996) and pc-GR as complementary. In Caspar et al. (2012), investigations showed that a value of B > (64/27)m3 leads to a metric with no event horizons. Thus, an external observer can in principle still look inside, though a large redshift will make the grey star look like a black hole. In the following, we will use the critical value B = (64/27)m3 if not otherwise stated.
In Schönenbach et al. (2013), several predictions were made, related to the motion of a test particle in a circular orbit around a massive compact object (labelled there as a grey star), which is relevant for the observation of a QPO and the redshift. One distinct feature is that at a certain distance in pc-GR the orbital frequency shows a maximum, from which it decreases again towards lower radii, allowing near the surface of the star a low orbital frequency correlated with a large redshift. This will affect the spectrum as seen by an observer at a large distance. Thus, it is of interest to know how the accretion disc would look like by using pc-GR. In addition to the usual assumptions made for modelling accretion discs, e.g. in Page & Thorne (1974), we assume the coupling of the dark energy to the matter of the disc to be negligible compared to the coupling to the central object. This is justified in the same way as one usually neglects the mass of the disc material in comparison to the central object.
In the following, we will first briefly review the theoretical background on the methods used, where we will also discuss the two models we used to describe accretion discs. After that we will present results obtained with the open-source ray-tracing code gyoto2 (Vincent et al. 2011) for the simulation of disc images and emission-line profiles.
2 THEORETICAL BACKGROUND
Finally, the concept of an innermost stable circular orbit (ISCO) has to be revised, as the pc-equivalent of the Kerr metric only shows an ISCO for some values of the spin parameter a. For values of a greater than 0.416 m and |$B=\frac{64}{27} m^3$|, there is no region of unstable orbits anymore (Schönenbach et al. 2013).
After including all those changes due to correction terms of the pc-equivalent of the Kerr metric one can straightforwardly adapt the calculations done in gyoto. The adapted version will be published online soon.
2.1 Obtaining observables
Equation (22) gives a concise way to write down the flux in the following two regions (rin describes the inner edge of an accretion disc):
|$r_{\omega _{\rm max}} < r_{\rm in} \le r$|: this is also the standard GR case, where ω|r < 0 and the flux in equations (20) and (22) is positive.
|$r_{\rm in} \le r < r_{\omega _{\rm max}}$|: here, ω|r > 0, but the upper integration limit in equation (22) is smaller than the lower one. Thus, there are overall two sign changes and the flux f is positive again.
Thus, if we consider a disc whose inner radius is below |$r_{\omega _{\rm max}}$|, which is the case in the pc-GR model for a > 0.416 m, equation (22) guarantees a positive flux function f.
3 RESULTS
As shown in Schönenbach et al. (2013), the concept of an ISCO is modified in the pc-GR model. For the following results, we used as the inner radius for the discs in the pc-GR case the values depicted in Table 1. Values of rin for a ≤ 0.4 m correspond to the modified last stable orbit. The value of rin for values of a above 0.416 m is chosen slightly above the value r = (4/3) m. For smaller radii, equation (14) has no real solutions anymore in the case of B = (64/27)m3. The same also holds for general (not necessarily geodesic) circular orbits, where the time component |$u^0 = \frac{1}{\sqrt{-g_{00} - 2 \omega g_{03} - \omega ^2 g_{33}}}$| of the particles four-velocity also turns imaginary for radii below r = (4/3) m in the case of B = (64/27)m3.
Values for the inner edge of the discs rin in pc-GR for the parameter B = 64/27m3.
| Spin parameter a (m) | rin (m) |
|---|---|
| 0.0 | 5.243 92 |
| 0.1 | 4.823 65 |
| 0.2 | 4.359 76 |
| 0.3 | 3.815 29 |
| 0.4 | 2.999 11 |
| 0.5 and above | 1.334 |
| Spin parameter a (m) | rin (m) |
|---|---|
| 0.0 | 5.243 92 |
| 0.1 | 4.823 65 |
| 0.2 | 4.359 76 |
| 0.3 | 3.815 29 |
| 0.4 | 2.999 11 |
| 0.5 and above | 1.334 |
We assume that the compact massive object extends up to at least this radius. For all simulations however we did neglect any radiation from the compact object. This is a simplification which will be addressed in future works.
The angular size of the compact object is also modified in the pc-GR case. It is proportional to the radius of the central object (Mueller 2006), which varies in standard GR between 1 and 2 m, leading to angular sizes of approximately 10-20 μas for Sagittarius A*. The size of the central object in pc-GR is fixed at r = (4/3) m in the limiting case for B = (64/27)m3 thus leading to an angular size of approximately 13 μas.
3.1 Images of an accretion disc
In Figs 3 and 4, we show images of infinite geometrically thin accretion discs according to the model of Page & Thorne (1974, see Section 2.1) in certain scenarios. Shown is the bolometric intensity I[erg cm−2 s−1 sr−1] which is given by |$I= \frac{1}{\pi } F$| (Vincent et al. 2011). To make differences comparable, we adjusted the scales for each value of the spin parameter a to match the scale for the pc-GR scenario. The plots of the Schwarzschild object (a = 0.0 m) and the first Kerr object (a = 0.3 m) use a linear scale whereas the plots for the other Kerr objects (a = 0.6 and 0.9 m, respectively) use a log scale for the intensity. This is a compromise between comparability between both theories and visibility in each plot. One has to keep in mind that scales remain constant for a given spin parameter a and change between different values for a.
The overall behaviour is similar in GR and pc-GR. The most prominent difference is that the pc-GR images are brighter. An explanation for this effect is the amount of energy which is released for particles moving to smaller radii. This energy is then transported via stresses to regions with lower angular velocity, thus making the disc overall brighter. In Fig. 1, we show this energy for particles on stable circular orbits.
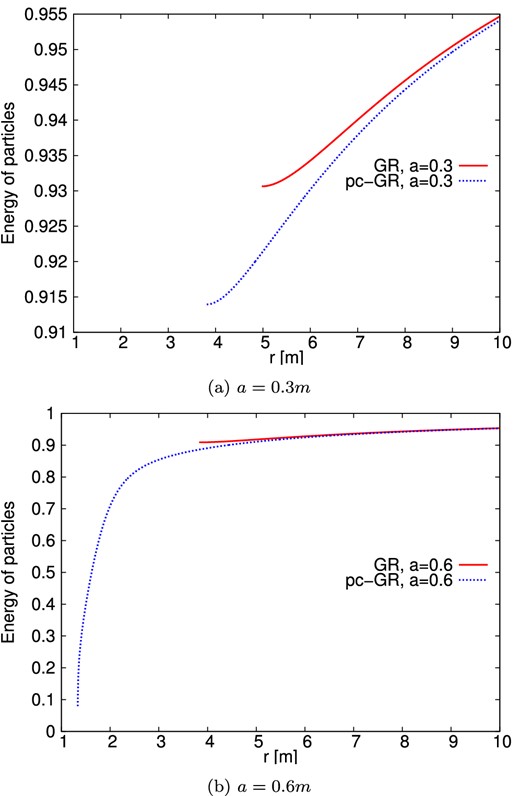
Normalized energy of particles on stable prograde circular orbits. The pc-parameter B is set to the critical value of (64/27)m3. In the pc-GR case, more energy is released as particles move to smaller radii, where the amount of released energy increases significantly in the case where no last stable orbit is present anymore. The lines end at the last stable orbit or at r = 1.334 m, respectively.
At first puzzling might be the fact that the fluxes differ significantly for radii above 10 m, although here the differences between the pc-GR and standard GR metric become negligible. However, the flux f in equation (22) at any given radius r depends on an integral overall radii starting from |$r_{\omega _{\rm max}}$| up to r. Thus, the flux at relatively large radii is dependent on the behaviour of the energy at smaller radii, which differs significantly from standard GR.
It is important to stress that the difference in the flux between the standard GR and pc-GR scenarios is thus also strongly dependent on the inner radius of the disc. This is due to the fact that the values for the energy too are strongly dependent on the radius, see Fig. 1(b). In Fig. 2(b), we compare the pc-GR and GR case for the same inner radius. There is still a significant difference between both curves but not as strongly as in Fig. 2(a).
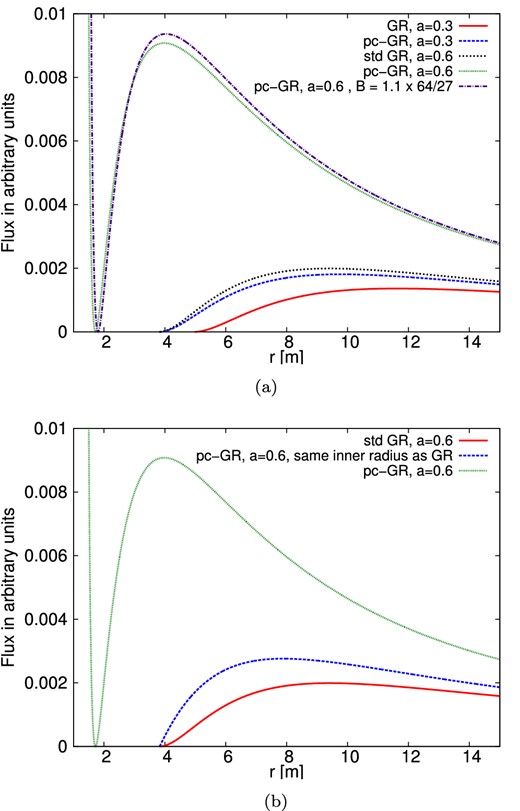
Shown is the flux function f from equations (20) and (22) for different values of a (and B). If not stated otherwise, B = (64/27)m3 is assumed for the pc-GR case. (a) Flux function f for varying spin parameter a and inner edge of the accretion disc. In the standard GR case, the ISCO is taken as inner radius; for the pc-GR case, see Table 1. (b) Dependence of the flux function f on the inner radius of the disc.
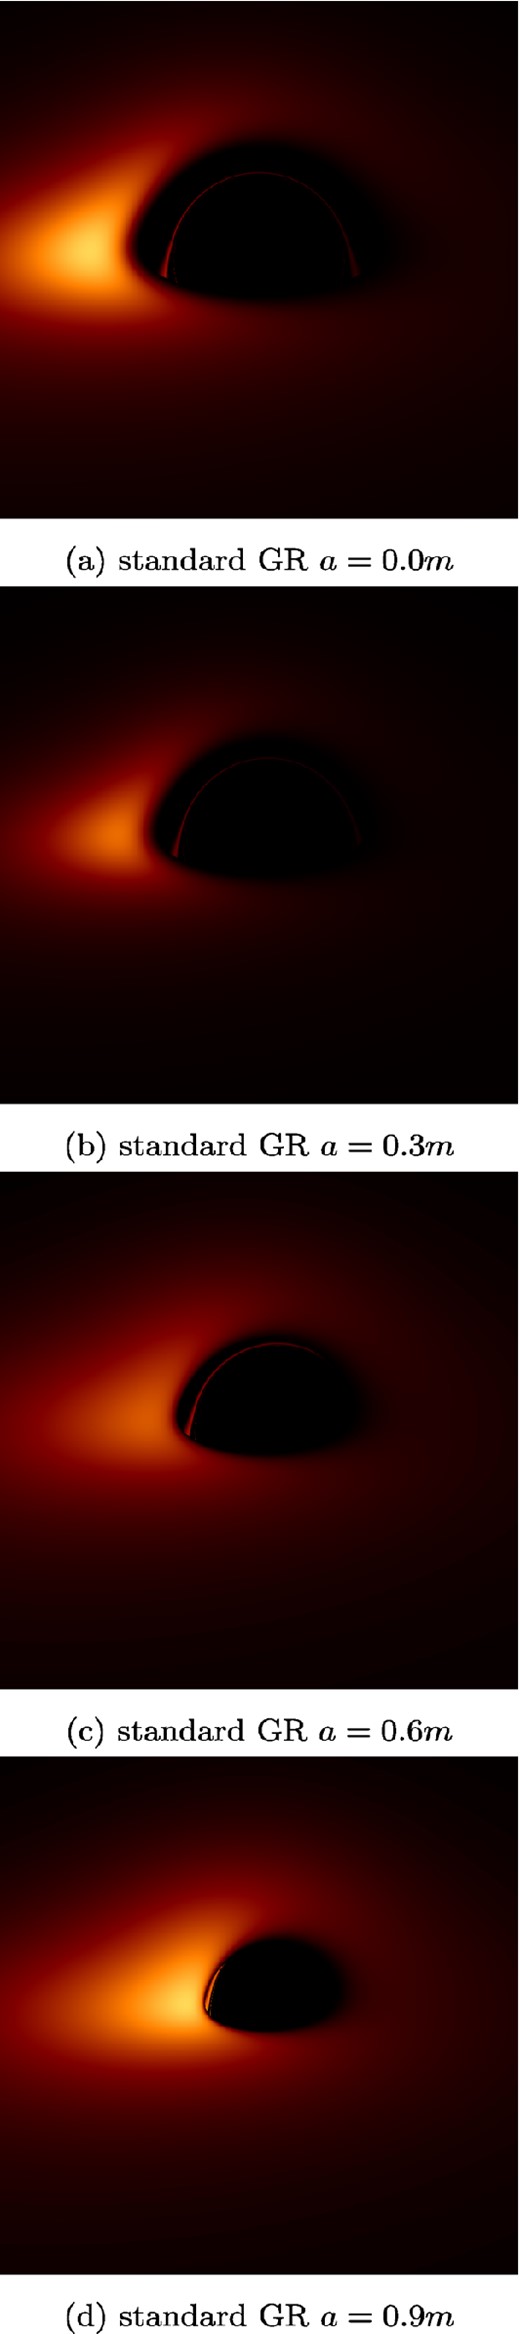
Infinite, counter clockwisely geometrically thin accretion disc around static and rotating compact objects viewed from an inclination of 70°. The disc model was developed originally by Page & Thorne (1974). Scales change between the images. (a) Standard GR a = 0.0 m. (b) Standard GR a = 0.3 m. (c) Standard GR a = 0.6 m. (d) Standard GR a = 0.9 m.
The next significant difference to the standard disc model by Page & Thorne (1974) is the occurrence of a dark ring in the case of a ≥ 0.416. This ring appears in the pc-GR case due to the fact that the angular frequency of particles on stable orbits now has a maximum at |$r = r_{\omega _{\rm max}} \approx 1.72 {\rm \,m}$| (Schönenbach et al. 2013) and the discs extend up to radii below |$r_{\omega _{\rm max}}$|. At this point, the flux function vanishes, see Section 2.1. Going further inside, the flux increases again, which is a new feature of the pc-GR model. This is the reason of the ring-like structure for a > 0.416 m. Note that the bright inner ring may be mistaken for second-order effects although these do not appear as the disc extends up to the central object.
In Fig. 2(a), we show the radial dependence of the flux function, see equations (20) and (22). For small values of a, we still have an ISCO in the pc-GR case and the flux looks similar to the standard GR flux – it is comparable to standard GR with higher values of a. If a increases and we do not have a last stable orbit in the pc-GR case, the flux gets significantly larger and now has a minimum. This minimum can be seen as a dark ring in the accretion discs in Fig. 4.
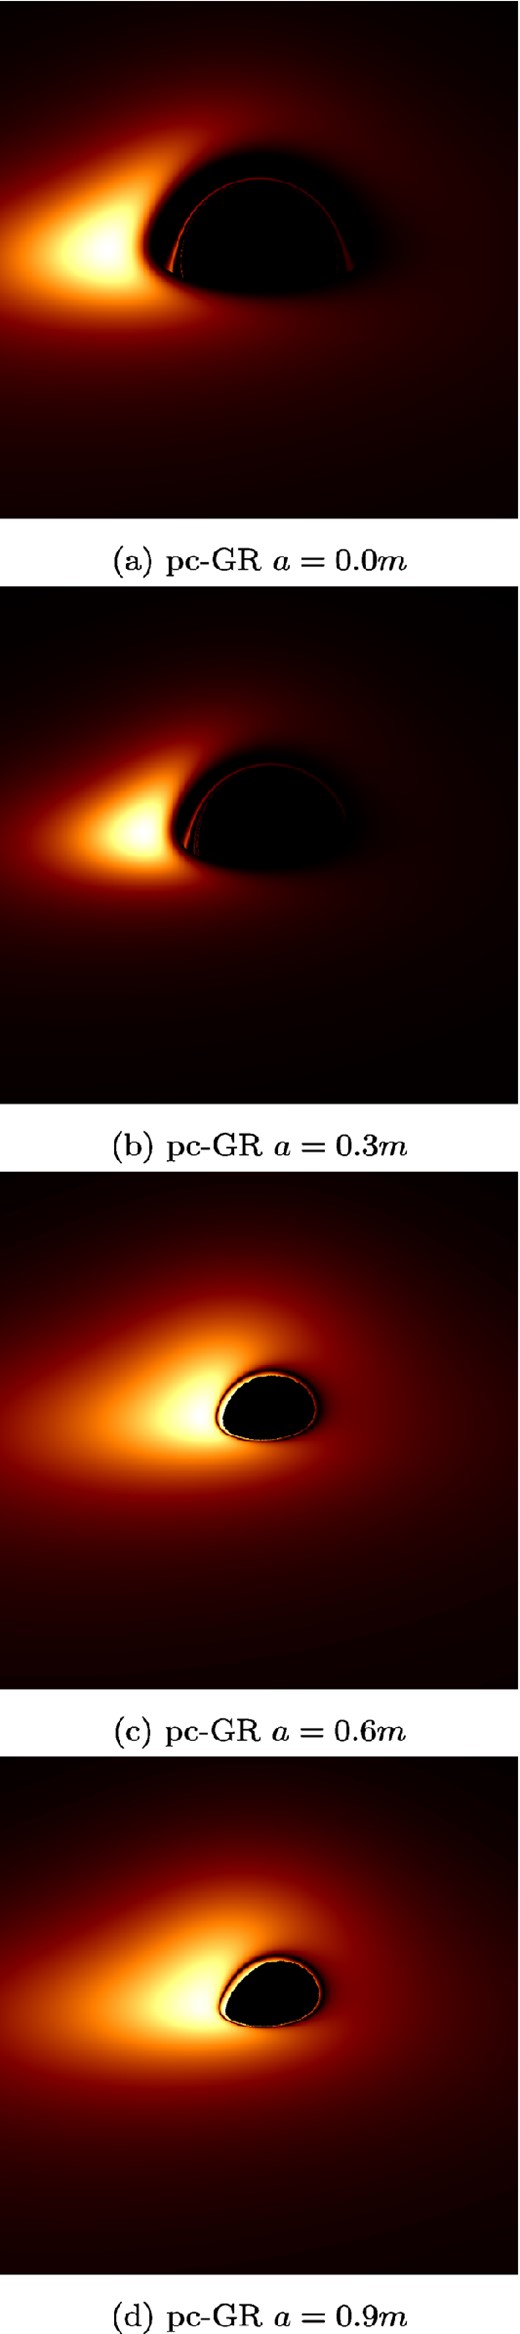
Infinite, counter clockwisely geometrically thin accretion disc around static and rotating compact objects viewed from an inclination of 70°. The disc model has been modified to include pc-GR correction terms as described in Section 2.1. Scales change between the images. (a) pc-GR a = 0.0 m. (b) pc-GR a = 0.3 m. (c) pc-GR a = 0.6 m. (d) pc-GR a = 0.9 m.
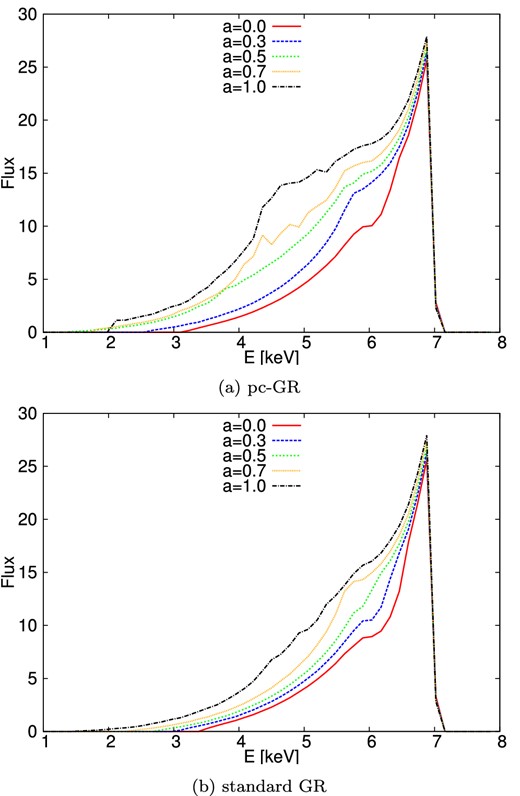
Several line profiles for different values of the spin parameter a. (a) pc-GR. (b) Standard GR.
Another feature is the change of shape of the higher order images. For spin values of a ≥ 0.416 m, the disc extends up to the central object in the pc-GR model, as it is the case for (nearly) extreme spinning objects in standard GR. Therefore, no higher order images can be seen in this case. However, in Figs 3(a)–(d), 4(a) and (b), images of higher order occur. The ring-like shapes in Figs 4(c) and (d) are not images of higher order but still parts of the original disc, as described above. They could be mistaken for images of higher order although they differ significantly on the redshifted side of the disc.
3.2 Emission-line profiles for the iron Kα line
As mentioned earlier, emission-line profiles allow us to investigate regions of strong gravity. All results in this section share the same parameter values for the outer radius of the disc (r = 100 m), the inclination angle (|$\theta = 40\deg$|) and the power-law parameter α = 3 (as suggested for discs first modelled by Shakura & Sunyaev 1973), see equation (19). We use this simpler model to simulate emission lines as it is widely used in the literature and thus results are easily comparable. The angle of |$\theta = 40\deg$| is just an exemplary value and can be adjusted. As rest energy for the iron Kα line, we use 6.4 keV. The inner radius of the discs is determined by the ISCO in GR and by the values in Table 1 for pc-GR, and varies with varying values for a. Shown is the flux in arbitrary units. In Figs 5(a) and (b), we compare the influence of the objects spin on the shape of the emission-line profile in GR and pc-GR separately. Both in GR and pc-GR, we observe the characteristic broad and smeared out low-energy tail, which grows with growing spin. It is more prominent in the case of pc-GR. The overall behaviour is the same in both theories. A closer comparison of both theories and their differences is then done in Figs 6 and 7, where we compare the two theories for different values of the spin parameter a. For slow-rotating objects (Schwarzschild limit), almost no difference is observable. As the spin grows, we observe an increase of the low-energy tail in the pc-GR scenario compared to the GR one. The blueshifted peak however stays nearly the same. If we compare both theories for different values of the spin parameter a, they get almost indistinguishable for certain choices of parameters, see Fig. 8.
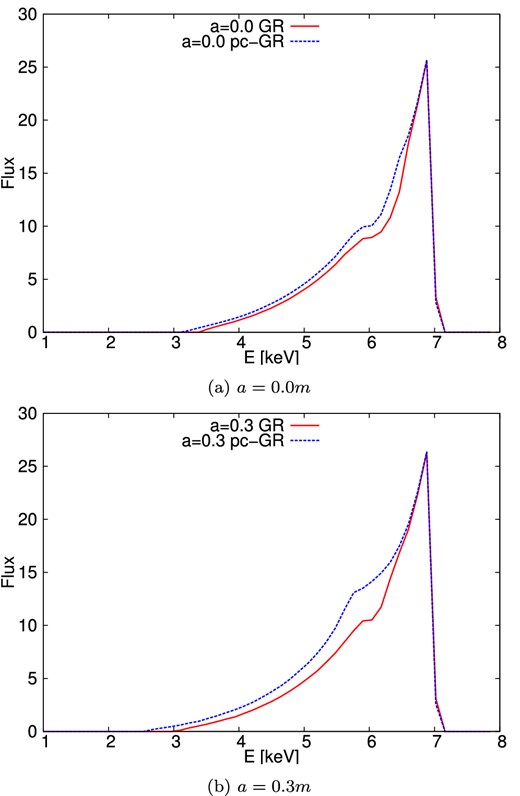
Comparison between theories. The plots are done for parameter values r = 100 m for the outer radius of the disc, |$\theta = 40\deg$| for the inclination angle and α = 3 for the power-law parameter. The inner radius of the discs is determined by the ISCO and thus varies for varying a. (a) a = 0.0 m. (b) a = 0.3 m.

Comparison between theories. The plots are done for parameter values r = 100 m for the outer radius of the disc, |$\theta = 40\deg$| for the inclination angle and α = 3 for the power-law parameter. The inner radius of the discs is determined by the ISCO and thus varies for varying a. (a) a = 0.6 m. (b) a = 0.9 m.
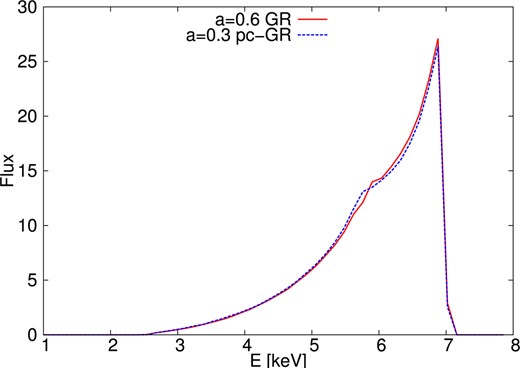
Comparison between theories for different values for the spin parameter. The plot is done for parameter values r = 100 m for the outer radius of the disc, |$\theta = 40\deg$| for the inclination angle and α = 3 for the power-law parameter. The inner radius of the discs is determined by the ISCO.
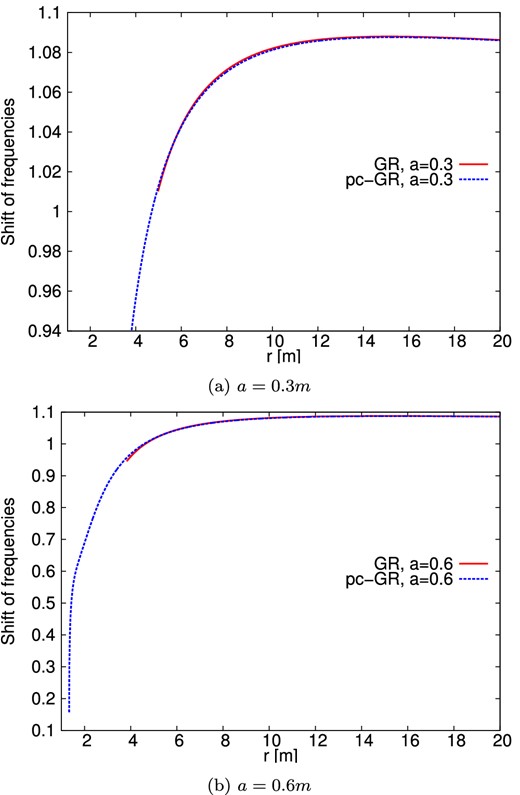
Combined effects of relativistic Doppler blueshift and gravitational redshift as a function of the radius. The inclination is given as |$\theta =40\deg$|. Values greater than 1 represent a blueshift. The plots start at the inner edge of the disc and are done for photons emitted parallel to the direction of movement of the emitter, i.e. where the highest blueshift occurs. (a) a = 0.3 m. (b) a = 0.6 m.
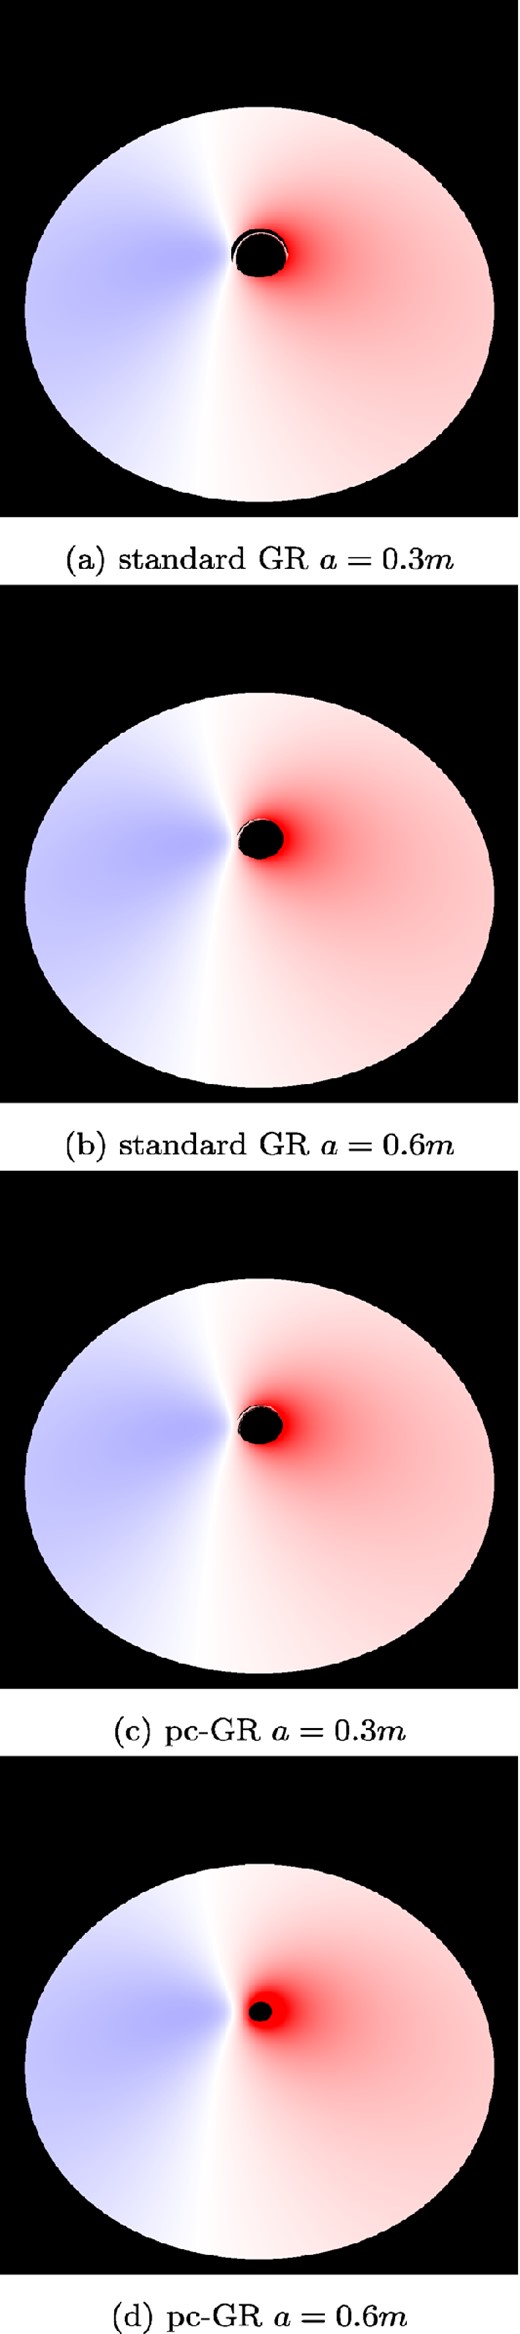
Redshift for a thin accretion disc. The inclination angle is 40°. The outer radius is set to rout = 50 m. The inner radius is set to the ISCO, if exists. For the pc-GR case, see Table 1. The similarity between the pc-GR case for a = 0.3 m and standard GR for a = 0.6 m can also be seen in Fig. 8. (a) Standard GR a = 0.3 m. (b) Standard GR a = 0.6 m. (c) pc-GR a = 0.3 m. (d) pc-GR a = 0.6 m.
4 CONCLUSION
We have adapted two models, which are implemented in gyoto (Vincent et al. 2011) – an infinite, geometrically thin and optically thick accretion disc (Page & Thorne 1974) and the iron Kα emission-line profile of a geometrically thin and optically thick disc (Fanton et al. 1997) – to incorporate correction terms due to a pc-extension of GR. In both models, we can see differences between standard GR and pc-GR. These differences can be attributed to the modification of the last stable orbit in pc-GR and thus discs which extend further in for a big range of spin parameter values of the massive object. In addition, the gravitational redshift and orbital frequencies of test particles have to be modified. Both the accretion disc images and emission-lines profiles show an increase in the amount of outgoing radiation thus turning the massive objects brighter in pc-GR than in GR, assuming that all other parameters are the same. Although the difference in the emission-line profiles is in principle big enough to be used to discriminate between GR and pc-GR, the effects of the pc-correction terms on the results are not as strong as the modifications presented, e.g., in Bambi & Malafarina (2013). Also an uncertainty in, e.g., the spin parameter a can make it very difficult to discriminate between both theories as we have seen in Fig. 8.
The authors want to thank the referee for very detailed and valuable comments on this article. The authors express sincere gratitude for the possibility to work at the Frankfurt Institute of Advanced Studies with the excellent working atmosphere encountered there. The authors also want to thank the creators of gyoto for making the program open-source, especially Frédéric Vincent for supplying them with an at-that-time unpublished version for simulating emission-line profiles. TS expresses his gratitude for the possibility of a work stay at the Instituto de Ciencias Nucleares, UNAM. MS and TS acknowledge support from Stiftung Polytechnische Gesellschaft Frankfurt am Main. POH acknowledges financial support from DGAPA-PAPIIT (IN103212) and CONACyT. GC acknowledges financial support from Frankfurt Institute for Advanced Studies.
Technically, this is not correct. It is computationally less expensive to follow light rays from an observer's screen back to their point of emission.
gyoto is obtainable at http://gyoto.obspm.fr/.
Each occurrence of p0 and p3 here is already replaced by the constants of motion −E and Lz, respectively.
The change of signature and the sign of the spin parameter a have to be kept in mind.
