


Abstract
The γ-ray flare of PKS 1222+216, observed in 2010 June, is interpreted as an outcome of jet dynamics at recollimation zone. We obtained the γ-ray light curves in three different energy bands, namely 100–300 MeV, 300 MeV–1 GeV and 1–3 GeV from observations by the Fermi-LAT (Large Area Telescope). We also use the Swift-XRT (X-Ray Telescope) flux from 0.3–10 keV obtained from archival data. We supplement these with the 0.07–0.4 TeV observations with MAGIC (Major Atmospheric Gamma-ray Imaging Cherenkov) telescope, available in the literature. The detection of source at very high energy (E > 100 GeV) with a differential photon spectral index of 2.7 ± 0.3 and the rapid variability associated with it suggests that the emission arises from a compact region located beyond the broad line emitting region. The plausible γ-ray emission mechanism can then be inverse Compton scattering of IR photons from obscuring torus. Further, the decay time of LAT flare cannot be explained by considering simple radiative loss mechanisms. Hence, to interpret the LAT light curves, we develop a model where the broad-band emission originates from a compact region, arising plausibly from the compression of jet matter at the recollimation zone. The flare is then expressed as an outcome of jet deceleration probably associated with this focusing effect. Based on this model, the rise of the LAT flare is attributed to the opening of emission cone followed by the decay resulting from jet deceleration. The parameters of the model are further constrained by reproducing the broad-band spectral energy distribution of the source obtained during the flare episode. Our study suggests that the particle energy density exceeds magnetic energy density by a large factor which in turn may cause rapid expansion of the emission region. However, near equipartition can be achieved towards the end of LAT flare during which the compact emission region would have expanded to the size of jet cross-section.
1 INTRODUCTION
Flat spectrum radio quasars (FSRQs) are radio loud active galactic nuclei (AGNs) with relativistic jet oriented close to the line of sight of the observer. Under the unification theory, they are classified along with BL Lacs as blazars (Urry & Padovani 1995). Non-thermal emission extending from radio to γ-rays, rapid flux variability and high degree of polarization are some of the common properties observed in blazars (Sambruna 2000; Krawczynski 2004; Fan et al. 2008). Their spectral energy distribution (SED) is characterized by a typical double-humped feature extending from radio to γ-ray energies (Wehrle et al. 1998; Kataoka et al. 1999) and in a few cases, up to very high energies (VHEs, E > 100 GeV) (MAGIC Collaboration et al. 2008; Wagner & H.E.S.S. Collaboration 2010; Aleksić et al. 2011). The observed rapid flux variability suggests the emission to arise from a compact region located close to the central engine and moving down the jet at relativistic speed (Dondi & Ghisellini 1995). The low-energy emission, extending from radio to UV/X-ray, is generally interpreted as synchrotron emission from a non-thermal population of electrons, while the high-energy emission is believed to originate from inverse Compton scattering of low-energy photons. The target photons for inverse Compton scattering can be the synchrotron photons from the jet themselves (SSC; Konigl 1981; Marscher & Gear 1985; Ghisellini & Maraschi 1989) or photons external to the jet (EC; Begelman & Sikora 1987; Melia & Konigl 1989; Dermer, Schlickeiser & Mastichiadis 1992). Simple emission models that consider only synchrotron and SSC processes, cannot explain the γ-ray emission from FSRQs and one needs to invoke EC emission to explain the SED satisfactorily (Hartman et al. 2001; Böttcher, Reimer & Marscher 2009; Sahayanathan & Godambe 2012). A few plausible target photons for the EC process are photons from the accretion disc (Dermer & Schlickeiser 1993; Boettcher, Reuter & Lesch 1997), reprocessed accretion disc photons from the broad line emitting region (BLR; Sikora, Begelman & Rees 1994; Ghisellini & Madau 1996) and/or infrared (IR) photons from the dusty obscuring torus (Sikora et al. 1994; Błażejowski et al. 2000; Ghisellini & Tavecchio 2008).
PKS 1222+216 (z = 0.432) is an FSRQ detected at VHE by the Major Atmospheric Gamma-ray Imaging Cherenkov Telescope (MAGIC; Mose Mariotti 2010; Aleksić et al. 2011). It is the third FSRQ detected at VHE after 3C 279 and PKS 1510−089 (MAGIC Collaboration et al. 2008; Wagner & H.E.S.S. Collaboration 2010). PKS 1222+216 has been active at Large Area Telescope (LAT) energies since 2009 September, undergoing occasional brightness enhancements (Tanaka et al. 2011). Such flaring episodes were also detected in other observatories operating at different/similar wavebands (Bulgarelli et al. 2010; Carrasco et al. 2010). The source underwent two major flares of ∼10−5 ph cm2 s−1 (0.1-300 GeV, >10σ) in 2010 April and June (Tanaka et al. 2011). The second flare in June was associated with a rapid VHE flare observed by the MAGIC telescope (on 2010 June 17), with a flux doubling time-scale of ∼10 min (Mose Mariotti 2010; Aleksić et al. 2011). The Swift-XRT did not cover the peak of the flares in April or June, but followed the source in the decaying part of the June flare (Tavecchio et al. 2011). We have analysed the LAT data of PKS 1222+216 from June 16 to 22 in three different energy bands and obtained the light curves of the flare. We have also analysed the contemporaneous Swift-XRT data to obtain a time-averaged broad-band spectrum (Section 2).
The observed VHE spectrum with a differential photon spectral index of 2.7 ± 0.3, and the rapid variability introduces additional constraint on the location and the size of the emission region (Nalewajko et al. 2012). The observed VHE spectral index suggests that the inverse Compton process happens in the Thomson regime as scattering in Klein–Nishina regime predicts a steeper spectrum (∼4; Dermer & Menon 2009). This constraint rules out the possibility of EC scattering of BLR photons and hence demands the emission region to be located beyond the BLR (Ghisellini & Tavecchio 2009; Nalewajko et al. 2012). On the other hand, the rapid variability time-scale of ∼10 min requires a smaller emission region compared to the jet cross-section at this distance. This led Tavecchio et al. (2011) to propose a blob-in-jet model, where the high-energy emission originates from a compact region buried inside the jet along with the standard emission region covering the whole jet cross-section. They further argued that such a scenario is possible when an expanding jet interacts with the external medium resulting in a recollimation shock, which in turn compresses the matter towards the jet axis, giving rise to a compact emission region. The dynamics of the outflow at the recollimation zone have been studied by Bromberg & Levinson (2009) following a semi-analytical approach and they found that the focusing of jet due to the recollimation shock is also associated with the deceleration of jet flow. Similar result of jet deceleration at recollimation shock has also been seen in high-resolution numerical simulations (Perucho & Martí 2007). Deceleration of jet can be understood as a result of radiative losses (Marscher 1999) and/or due to sweeping up of ambient/jet matter (Chiang & Dermer 1999; Perucho & Martí 2007; Böttcher & Principe 2009). If the jet axis is aligned close to the line of sight of the observer, then deceleration of jet will result in a time-dependent Doppler boosting with an increase in the opening angle of the emission cone.
In this paper, we interpret the γ-ray light curve of PKS 1222+216 during the flare on 2010 June as a result of jet dynamics happening at the recollimation zone. The kinetic equation describing the evolution of electron spectrum in the emission region is solved numerically. The resultant photon spectrum is obtained by convolving the time-dependent electron distribution with single particle emissivity corresponding to various emission processes. The rise of photon flux during the flare results from an increase in the opening angle of the emission cone, while the fall is governed by the effects of jet deceleration.
In the next section, we describe the data analysis procedures, and in Section 3, we describe the constraints derived from the observations and the rationale behind the present model. In Section 4, we present the details of the model and the underlying assumptions. Finally in Section 5, we discuss the results obtained followed by conclusions in Section 6. A cosmology with Ωm = 0.3, |$\Omega _\Lambda = 0.7$| and H0 = 70 km s−1 Mpc−1 is used in this work which corresponds to a luminosity distance dL = 2.37 Gpc for z = 0.432.
2 DATA ANALYSIS
The LAT on board the Fermi Gamma-ray Space Telescope is sensitive to γ-rays from 20 MeV to >300 GeV (Atwood et al. 2009). The entire sky is covered in its normal scanning operation mode in ∼3 h, thereby the time evolution of the γ-ray sources is regularly monitored. Automated follow-ups for Fermi-LAT sources at lower wavelengths are conducted with various instruments and observatories. For example, the Swift-XRT monitors any source that has flared above 10−6 ph cm−2 s−1 in LAT. In this paper, we have used the publicly available γ-ray and X-ray data from LAT and XRT, respectively, during the γ-ray flaring period of PKS 1222+216 (MJD: 55363–55370).
LAT data analysis: LAT data between 2010 June 16 and 22 (MJD: 55363–55370) were analysed using fermi science tool version v9r27p1, which was the latest publicly available release during the time of analysis. Only the events that have energy >100 MeV and zenith angles <100° were considered to avoid calibration uncertainties and earth limb. We selected the events tagged as ‘source class events’ (evclass 2) in the photon data, and good time intervals using the logical expression ‘(DATA_QUAL==1)&&(LAT_CONFIG==1)&&ABS(ROCK_ANGLE)<52’. We followed ‘unbinned likelihood analysis’ (Mattox et al. 1996) (python implementation of gtlike) to model photons from a region of interest (ROI) of 15° centred around the position of the blazar. The exposure map was created for the ROI plus a 10° annulus to take care of photons from outside the ROI possibly entering the region due to the large point spread function (PSF). We used the pass 7 (P7SOURCE_V6) instrument response function along with Galactic diffuse emission model (gal_2yearp7v6_v0.fits) and isotropic background model (iso_p7v6source.txt). Point sources in the region were selected and modelled based on the LAT second-year catalogue (gll_psc_v08.fit; Nolan et al. 2012).1 The typical systematic uncertainties in the flux values are 10 per cent at 100 MeV and 5 per cent between 316 MeV and 10 GeV.
We thus obtained the daily γ-ray light curves in three energy bands (100–300 MeV, 300–1000 MeV and 1000–3000 MeV) following the above procedure and shown in Fig. 1 (filled circles). Point sources with test statistics (TS) values ≤0 were removed from the source model during analysis. Fluxes from a two hour binned LAT data (Fig. 1, inverted triangles) were also obtained around MJD 55364.9, an epoch encompassing the VHE detection by the MAGIC (Fig. 1, solid vertical line) using the best-fitting model parameters obtained for 0.1–300 GeV. A significance criteria of 3σ corresponding to a TS value of ∼10 was used for the source detection.
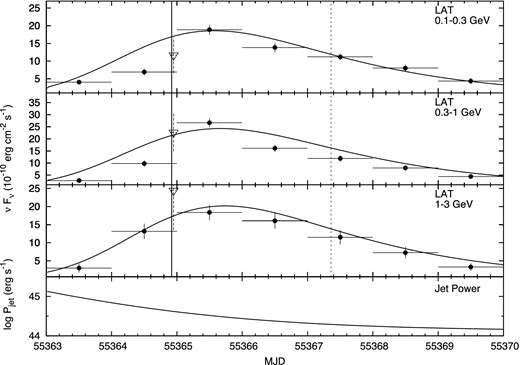
The daily binned Fermi-LAT light curves of PKS 1222+216 in three energy bands obtained during the flare along with the model light curves. The instantaneous jet power (Pjet) is shown in the bottom panel. Error bars are standard 1σ, statistical only. The estimated systematic uncertainties in the fluxes are 10 per cent at 100 MeV, and 5 per cent between 316 MeV and 10 GeV. The solid and dashed vertical line marks the epoch of VHE and XRT observation during the LAT flaring episode. Inverted triangles are LAT fluxes at the time of VHE detection by MAGIC, extracted from a two hour integrated LAT data (see Section 2).
Swift-XRT analysis: We have used XRT data from June 20 (MJD 55367.4), soon after the end of the flare, for creating quasi-simultaneous SEDs as shown in Fig. 2. The XRT observation of the second flare started on June 20, and thus missed the peak of the LAT flare and the epoch of the MAGIC observation. To create the SED, we used the heasoft package (version 6.13) and followed the standard procedure for XRT data analysis by obtaining source spectrum from a region of 90 per cent PSF (∼47 arcsec; Moretti et al. 2005) and a background spectrum from nearby uncontaminated regions. We modelled the spectra as a power law multiplied by an absorber (phabs) in xspec. We fixed the neutral hydrogen column density at the Galactic value of NH = 2.12 × 1020 cm−2 obtained by the LAB Galactic HI survey (Kalberla et al. 2005). The SED points were extracted using the best-fitting model parameters (|$\Gamma _{\rm p} = 1.60\pm 0.11, \rm{d}N/\rm{d}E\sim E^{- \Gamma _{\rm p}}$|) and subsequently corrected for Galactic absorption.
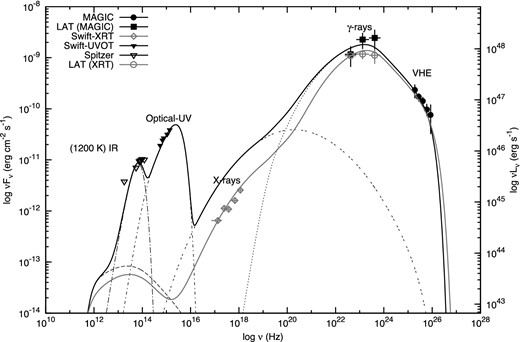
The broad-band spectrum of PKS 1222+216 at MAGIC and XRT observation epoch. The VHE data (black solid circles) are obtained from Aleksić et al. (2011) and the corresponding LAT fluxes are extracted from two hour (black squares) integrated LAT data. The grey data represent the XRT observation with corresponding LAT fluxes from six hour integrated LAT data. The dashed, double dashed and dotted lines represent the synchrotron, SSC and EC spectra at the time of VHE detection by MAGIC. The solid black and grey lines represent the total emission from all spectral components at the two epoch, respectively. The IR–optical–UV data are taken from the literature and are reproduced by the torus emission at 1200 K and multitemperature blackbody emission from accretion disc (see Sections 2 and 5).
Finally, the IR–optical–UV data were obtained from the literature (Carrasco et al. 2010; Malmrose et al. 2011; Tavecchio et al. 2011), and the SED of the source was constructed for two epochs: one for simultaneous LAT-VHE observation and second for simultaneous LAT-XRT observation. Both the SEDs are shown in Fig. 2 (black and grey data points, respectively), and the corresponding epochs are demarcated by vertical lines (solid and dashed, respectively) in Fig. 1. The LAT spectrum of the first SED is extracted using two hours of observed data whereas for the latter, we have used six hours of observed LAT data.
3 OBSERVATIONAL CONSTRAINTS
The γ-ray emission from FSRQs is generally attributed to the EC scattering process. The plausible target photons for the EC scattering are the IR photons from the dusty torus and/or the dominant Lyman α photons from the BLR. However, scattering of BLR photons to VHE will happen in Klein–Nishina regime (Ghisellini & Tavecchio 2009; Aleksić et al. 2011; Nalewajko et al. 2012; Sahayanathan & Godambe 2012) resulting in steeper photon spectra (∼4; Dermer & Menon 2009), in contrast with the observed VHE photon spectral index of 2.7 ± 0.3 (Aleksić et al. 2011). This suggests that the VHE emission is due to EC scattering of IR photons which happens in the Thomson regime. This in turn demands the emission region to be located beyond the BLR and this condition along with the observed rapid variability (doubling time ∼10 min) decides the location and the size of the emission region (Nalewajko et al. 2012). Incidentally, the condition on the target photons for EC scattering to happen in the Thomson regime also assures the transparency of VHE photons against the pair production losses (Ghisellini & Tavecchio 2009; Sahayanathan & Godambe 2012).
4 RECOLLIMATION SCENARIO
5 RESULTS AND DISCUSSION
The one day binned γ-ray light curve of PKS 1222+216 in three different energy bands (Fig. 1), during the flare, are reproduced by considering EC scattering of IR photons and jet deceleration at the recollimation zone. Under this scenario, the observed γ-ray flare can be interpreted in the following manner: if the jet is misaligned with respect to the line of sight of the observer by an angle |$\theta > \Gamma _{{\rm max}}^{-1}$|, then this will cause the observer to lie outside the emission cone initially, resulting in low observed flux. Now, as the jet decelerates and when Γ(t) ≲ θ−1, the emission cone widens up causing increase in the observed flux. However, further deceleration of the jet reduces the relativistic Doppler boosting and hence the target photon energy density, which eventually lead to the decay of the observed flux. We apply this picture to the Fermi γ-ray light curves and the resultant model light curves along with the observed fluxes are shown in Fig. 1. The parameters governing the particle injection spectrum and the evolution of bulk Lorentz factor are given in Table 1.
Model parameters. Columns: (1) and (2) particle spectral indices before and after the break; (3) Lorentz factor of the electron corresponding to break energy; (4) magnetic field (in Gauss); (5) cold proton number density, np = Np/Vp (in cm− 3); (6) terminal bulk Lorentz factor; (7) parameter deciding the maximum bulk Lorentz factor, Γmax = Γ0 + Γ1; (8) emission region size (× 1014 cm); (9) viewing angle (in degree); (10) minimum Lorentz factor of injected electrons; (11) maximum Lorentz factor of injected electrons; (12) decay time-scale of the bulk Lorentz factor (in days); (13) jet cross-section at the location of emission region (× 1016 cm).
| p | q | |$\gamma _{{\rm b}}^\prime$| | B′ | np | Γ0 | Γ1 | R′ | θ | |$\gamma ^{\prime }_{\rm min}$| | |$\gamma ^{\prime }_{\rm max}$| | τ | D |
|---|---|---|---|---|---|---|---|---|---|---|---|---|
| 1.15 | 3.0 | 4.2 × 10³ | 0.10 | 1.2 | 18 | 39 | 3 | 2.5 | 30 | 7 × 10⁴ | 1.3 | 6 |
| p | q | |$\gamma _{{\rm b}}^\prime$| | B′ | np | Γ0 | Γ1 | R′ | θ | |$\gamma ^{\prime }_{\rm min}$| | |$\gamma ^{\prime }_{\rm max}$| | τ | D |
|---|---|---|---|---|---|---|---|---|---|---|---|---|
| 1.15 | 3.0 | 4.2 × 10³ | 0.10 | 1.2 | 18 | 39 | 3 | 2.5 | 30 | 7 × 10⁴ | 1.3 | 6 |
The number of parameters governing the spectral and temporal behaviour of the source are large in comparison with the information available through the LAT light curves in three energy bands and hence may not be well constrained. However, additional constraint on the parameters can be imposed by reproducing the time averaged broad-band spectrum of the source, over the MAGIC and XRT observation epoch (see Section 2). In Fig. 2, we show the resultant spectrum (solid black line) corresponding to the parameters given in Table 1, along with the observed fluxes at the time of MAGIC detection. The model spectrum corresponding to Swift-XRT observation period is shown as grey line in Fig. 2. The optical/UV and IR fluxes are reproduced considering emission from accretion disc and obscuring torus. For disc emission, we adopt a multitemperature blackbody with luminosity LUV ≃ 7 × 1046 erg s−1 peaking at 3 × 10¹⁵ Hz (Frank, King & Raine 2002). The IR emission from torus is approximated as thermal radiation, at a temperature of 1200 K, originating from a spherical shell of radius RIR = 7 × 1018 cm. The highest energy of the electron, |$\gamma ^\prime _{\rm max}$|, injected into the emission region (equation 8), is assumed to be constant in the present work. However, to interpret the VHE light curve and fit SED properly (∼10 min variability) one may need to consider the evolution of |$\gamma ^\prime _{\rm max}$| also (see Fig. 2).
A decelerating jet model was earlier proposed by Georganopoulos & Kazanas (2003), in order to explain the TeV emission from the BL Lac objects Mrk 421 and Mrk 501 with reasonable jet Lorentz factors. They considered the inverse Compton scattering of synchrotron photons from a slower moving part of the jet by the relativistic electrons present in the faster moving part (upstream). In such a situation, the target photons will be beamed in the frame of the faster moving part of the jet and get scattered to VHE by the relativistic electrons. Böttcher & Principe (2009) also proposed a decelerating jet model to explain the decay of the optical light curve of 3C 279 during a flare observed in 2006. Their model is analogous to the relativistic blast-wave model for γ-ray bursts where they considered radiative energy losses and radiative drag being the main reasons for jet deceleration. However, in this work, we perform a detailed study of the evolution of particle distribution under a decelerating jet scenario, involving different loss processes. Temporal behaviour of the spectrum is a reflection of time dependent particle injection rate, resulting from the loss of jet power, and relativistic effects related to jet deceleration. Recently, Potter & Cotter (2013) developed a model where they considered jet acceleration from a Poynting flux dominated region followed by deceleration after attaining the terminal bulk Lorentz factor. Using this model, they explained the broad-band SED of PKS 0227−369. In this work, we have considered emission from a location where jet is already kinetic energy dominated.
Interpretation of blazar flare as a result of difference in bulk Lorentz factor was earlier used by Hartman et al. (2001) to explain the multiwavelength spectra of blazar 3C 279 during γ-ray high state in 1999 and 2000. They fitted the broad-band spectra at different epochs by varying the bulk Lorentz factor of the jet accompanied by a change in the spectral shape of the electron distribution. The emission region was within the BLR clouds and hence significant contribution of the external Compton radiation was obtained by scattering the BLR photons. Here, we model a single γ-ray flare by evolving the jet Lorentz factor gradually. Simultaneous detection of the source at VHE also suggests that the emission region lies outside the BLR clouds and hence the external Compton radiation will be dominated by the scattering of IR photons from the torus. Our model is similar to the blob-in-jet model used by Tavecchio et al. (2011) to explain the broad-band SED of PKS 1222+216. However, in addition to reproducing the broad-band SED, we explain the LAT light curves by considering the jet dynamics at the recollimation zone. Blob-in-jet model, incorporating only SSC process, has also been used to model the VHE γ-ray light curve and SED of TeV BL Lac blazar PKS 2155−304 during a flare in 2006 (H.E.S.S. Collaboration et al. 2012).
6 CONCLUSIONS
Detection of VHE γ-rays with a variability time-scale of ∼10 min suggest a very compact emission region located beyond BLR. Existence of such compact emission region, on parsec scale, requires strong convergence of the jet flow, suggesting recollimation as one of the possible mechanism. In this paper, the variation in the γ-ray spectrum of PKS 1222+216, observed by Fermi-LAT, is explained considering the jet dynamics at recollimation zone. Besides providing a compact emission region due to compression of jet matter by recollimation shock, study of jet dynamics at recollimation zone suggests deceleration of jet flow. We adapt this scenario to reproduce the daily binned γ-ray light curves observed in three different energy bands. The parameters governing the model are further constrained by reproducing the simultaneous/contemporaneous broad-band SED of the source during the flare. The inferred values of the bulk Lorentz factor (Γ) and Doppler factor (δ) are consistent with the ones estimated through radio and γ-ray studies of LAT bright blazars (Homan 2012).
Due to the lack of simultaneous observations at radio/optical (synchrotron) and X-ray (SSC) energies during the flare, the light curves at these energies cannot be compared with the present model. Future simultaneous multiwavelength observations of the source at energies covering from radio-to-γ-ray can verify the present model and can be used to impose more stringent constraints on the parameters involved. The spectral evolution of the source at these energies will also help us in studying the effect of magnetic field and the underlying particle distribution during a flare. For instance, variation of magnetic field in the emission region along with the bulk Lorentz factor during a flare will lead to additional increase/decrease in the synchrotron and SSC fluxes along with a shift in their peak frequencies. Similarly, a change in the spectral index can throw light on the basic particle acceleration mechanism. These in turn will help us in understanding the energetics and dynamics of the AGN jets.
Authors thank the anonymous referees for their useful comments and suggestions. PK thanks K. Nalewajko for clarification on some of the calculations in his paper (Nalewajko et al. 2012). SS acknowledges Ranjeev Misra for useful discussions. This research has made use of data obtained from High Energy Astrophysics Science Archive Research Center (HEASARC), maintained by NASA's Goddard Space Flight Center and NASA/IPAC Extragalactic Database (NED) which is operated by the Jet Propulsion Laboratory, California Institute of Technology, under contract with the NASA.
PKS 1222+216 is fitted with a log parabola model.
Quantities with prime are measured in the rest frame of the emission region.
