-
PDF
- Split View
-
Views
-
Cite
Cite
Long Ji, Shu Zhang, YuPeng Chen, Shuang-Nan Zhang, Diego F. Torres, Peter Kretschmar, Masha Chernyakova, Jian Li, Jian-Min Wang, X-ray bursts as a probe of the corona: the case of XRB 4U 1636−536, Monthly Notices of the Royal Astronomical Society, Volume 432, Issue 4, 11 July 2013, Pages 2773–2778, https://doi.org/10.1093/mnras/stt625
Close - Share Icon Share
Abstract
To investigate the possible cooling of the corona by soft X-rays bursts, we have studied 114 bursts embedded in the known X-ray evolution of 4U 1636−536. We have grouped these bursts according to the ratio of the flux in the 1.5–12 keV band with respect to that in the 15–50 keV band, as monitored by Rossi X-ray Timing Explorer/All Sky Monitor and Swift/Burst Alert Telescope, respectively. We have detected a shortage at hard X-rays while bursting. This provides hints for a corona cooling process driven by soft X-rays fed by the bursts that occurred on the surface of neutron star. The flux shortage at 30–50 keV has a time lag of 2.4 ± 1.5 s with respect to that at 2–10 keV, which is comparable to that of 0.7 ± 0.5 s reported in bursts of IGR 17473−2721. We comment on the possible origin of these phenomena and on the implications for the models on the location of the corona.
INTRODUCTION
In low-mass X-ray binaries (LMXBs), a neutron star (NS) or a black hole (BH) accretes matter from a Roche lobe-filled donor star and releases the gravitational potential-energy mostly in X-rays, either persistently, or violently in form of the outbursts (examples of outbursts have been shown in lower panel of Fig. 1). The outbursts usually last from a few days to several months due to a sudden increase in accretion rate and vary in intensity by a factor of ≥ 100 (Galloway et al. 2008). During the evolution of an outburst, the system usually experiences a sequence of spectral states, which can be simplified into a high/soft state (HSS) and a low/hard state (LHS). For some X-ray binaries (XRBs), during the decay of the outburst the spectrum becomes hard again at a lower luminosity level, forming a so-called hysteresis characterized with a lagging LHS. Such hysteresis was so far observed in an NS XRB only for IGR J17473−2721 (Zhang et al. 2009). The persistent emission of the outbursts in NS LMXBs was described by the sum of a blackbody component plus a thermal Comptonization spectrum (Titarchuk 1994). The blackbody component (at several keV) was attributed to the emission from the NS surface and the innermost accretion disc. The Comptonized component (at tens to hundreds of keV) was thought to originate from a hot corona. However, the location and formation process of the latter is still poorly known. According to the proposed corona location, models for NS XRBs are divided into the eastern model, for which the corona is in the vicinity of the NS surface (Mitsuda et al. 1989), and the western model, for which the corona surrounds the disc (White, Stella & Parmar 1988). Regarding the corona formation, evaporation (Meyer & Meyer-Hofmeister 1994; Esin, McClintock & Narayan 1997; Frank, King & Raine 2002; Liu, Taam & Meyer-Hofmeister 2007) and magnetic re-connection models (Zhang et al. 2000; Mayer & Pringle 2007; Zhang 2007) have been put forward.
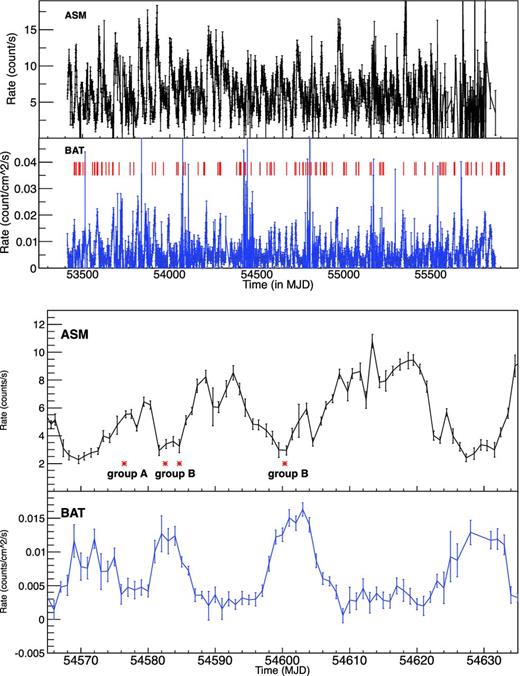
Upper panel: the long-term monitoring of 4U 1636−536 at soft X-rays (1.5–12 keV) by ASM (black) and at hard X-rays (15–50 keV) by BAT (blue). The red lines represent the type-I bursts occurred during the evolution of the source. Lower panel: example of the outbursts recorded by ASM (black) and BAT (blue). The locations of the bursts are symbolized by asterisks and classified into groups A and B.
Type I X-ray bursts are thermonuclear explosions on the surface of NSs other than releasing the gravitational potential-energy. They manifest as a rapid increase in X-ray intensity, many times brighter than the persistent emissions, followed by distinct spectral softening during bursts decay, which is the result of the cooling of the NS photospheres. Unlike the time-scale of days to months of the outbursts, the time-scale of typical type-I bursts is tens to hundreds of seconds. Type-I X-ray bursts, unique to NS XRBs, can be used to probe the corona. For instance, Chen et al. (2012) observed IGR J17473−2721 during the 2008 outburst.1 They found that for bursts embedded in the preceding LHS, the 2–10 keV and 30–50 keV fluxes are anticorrelated, and that there is an apparent time lag of about 0.7 ± 0.5 s present in the latter (Chen et al. 2012).
Here, we report on LMXB 4U 1636−536 (also known as V801 Ara), discovered with the 8th Orbiting Solar Observatory (OSO-8; Swank et al. 1976), and subsequently studied with SAS-3, Hakucho, Tenma, EXOSAT and Rossi X-ray Timing Explorer (RXTE; Lewin et al. 1987). The spectral classification with the colour–color diagram (CCD) has been reported by Hasinger & van der Klis (1989) and Schulz, Hasinger & Truemper (1989). In the X-ray CCD or hardness–intensity diagram (HID), 4U 1636−536 traces a U-shape or C-shape as a typical atoll source [detailed CCD and HID were shown in Zhang, Méndez & Altamirano (2011)]. [The type-I bursts in Z-sources are relatively rare compared to those in atoll sources due to large accretion rate and the presence of a strong magnetic field (Lewin, van Paradijs & Taam 1993; Galloway et al. 2008).] The orbit and spin periods of 4U 1636−536 are about 3.8 h (van Paradijs et al. 1990) and 581 Hz (Strohmayer et al. 1998a,b), respectively. Its distance was estimated as ∼6 kpc (Galloway et al. 2006) during the type-I bursts with photospheric radius expansion (PRE).
The rest of this work is organized as follows. Section 2 introduces the data and the observations. Section 3 describes the findings of additional hints for an anticorrelation between soft and hard X-rays in bursts. Under these findings, Section 4 describes the possible constraints upon the disc/corona configuration during state transitions. A discussion on the implications of these results is given in Section 5.
OBSERVATIONS AND DATA ANALYSIS
4U 1636−536 has been monitored by the All Sky Monitor (ASM) of Rossi X-ray Timing Explorer (RXTE) at 1.5–12 keV since 1996. Here, we consider the RXTE observations in MJD 534 52–558 47, during which monitoring at 15–50 keV is also available from the Burst Alert Telescope (BAT) of Swift (see Fig. 1).2 On top of Fig. 1, we mark 126 type-I bursts embedded in the evolution of the source. Among them, 12 PRE bursts are not included in the following analysis since their flat top peaks make it difficult to co-align the individual burst according to the flux evolution. For the remaining sample of 114 burst events, we extracted their light curve from the proportional counter array (PCA) data (Jahoda et al. 1996). We utilize the best-calibrated Proportional Counter Unit (PCU) 2 only. The analysis of the PCA data is performed using heasoft V. 6.12. Light curves in bins of 1 s are extracted from the science event data of E_125u_64M_1_s. The persistent emission is taken at a window of 30 s prior to each burst, and subtracted off to have the net burst light curve. The dead-time correction is made under the canonical criterion described at the HEASARC website3, with the standard 1b data as a reference. Light curves for the bursts are co-aligned and combined according to the peak flux of each burst in the 2–10 keV band.
RESULTS
The 4U 1636−536 outbursts adopted in our analysis are shown in Fig. 1. The average peak fluxes of the outbursts are derived as 12 ct s−1 at 1.2–12 keV from the total ASM light curve, and 0.015 ct cm−2 s−1 at 15–50 keV from the total BAT light curve.
A zoom-in view of a few outbursts is shown in the bottom panel of Fig. 1. The spectrum evolves from the LSS to the HSS during an outburst (Lewin et al. 1993; Galloway et al. 2008). Therefore, the alternately hard/soft state can be regarded as numerous separated outbursts, in which the hard X-ray peaks lead the soft X-ray ones. We subdivided the ASM and BAT light curves into 30-d segments, covering in each both the individual hard and lagging soft states, and calculated the cross-correlation between them4 and then utilized a throwing-dot method, further described below, to determine the time lag and its error. The distribution of the time lag for the outbursts is shown in Fig. 2, presenting an average of about 12.7 ± 0.2 d. This time lag is far beyond zero which means the hard/soft states can be distinguished clearly, and hence the type-I bursts can be well classified accordingly.
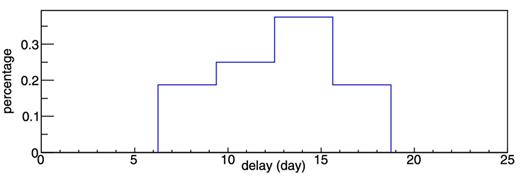
The time-delay distribution for the outbursts of 4U 1636−536. The time delay refers to the time in which the soft X-ray peak (monitored by ASM) lags the hard X-ray one (monitored by BAT).
We subdivided the bursts into two groups. Group A is composed of 78 bursts, which are located around the outburst peaks in the ASM light curve and the each valley of the BAT light curve. Group B encloses 36 bursts embedded in the preceding LHS, with a relatively high persistent hard X-ray flux, and hence occurring in hard states of the persistent emission. The average hardness ratios (BAT flux/ASM flux) turn out to be (0.4 ± 0.1) × 10−3 and (1.4 ± 0.4) × 10−3 for groups A and B, respectively. Such a classification allows investigating the possibly different outburst evolution.
We combined the 2–10 keV and the 30–50 keV light curves for group A and averaged them in each time bin, taking the 2–10 keV peak time of each burst as reference. The resulting averaged light curves are produced in bins of 1 s at 2–10 keV and 8 s at 30–50 keV. The results are shown in Fig. 3. We notice that the 30–50 keV flux close to zero of the time axis shows a weak (statistically non-significant) excess co-aligned with the soft peak at 2–10 keV. If it is not a statistical fluctuation, this excess may come from the reprocessing of the burst seed photons by the corona.
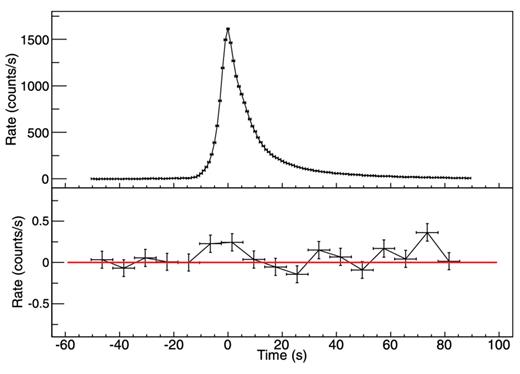
Light curves derived from PCA for bursts combined in group A: 1-s-bin light curve at 2–10 keV (top panel), 8-s-bin light curve at 30–50 keV (bottom panel).
We have obtained the averaged light curves at 2–10 keV and 30–50 keV for group B as well (see the top and middle panels of Fig. 4). There exists a clear shortage in the 30–50 keV flux, a phenomenon similar to that discovered in the preceding LHS of the 2008 outburst of IGR J17473−2721 (Chen et al. 2012). A constant fit to this light curve results in a χ2 of 49.40 under 25 degrees of freedom (d.o.f.), suggesting a significance of 3σ for the shortage.5
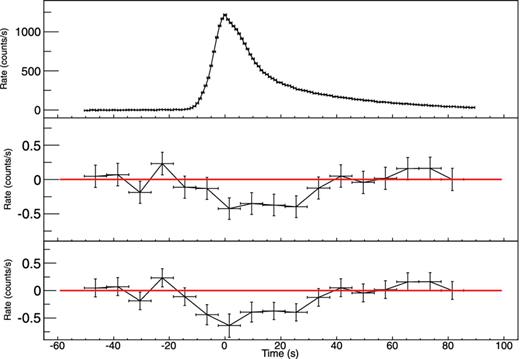
Light curves derived from PCA for bursts combined in group B: 1-s-bin light curve at 2–10 keV (top panel), 8-s-bin light curve (middle panel) and revised light curve (bottom panel) at 30–50 keV.
With the 2–10 keV and the 30–50 keV light curves for group B, we investigated the correlation along the burst evolution between the hard and soft X-rays (Fig. 4). Light curves in both energy bands, which corresponds to the upper and lower panel of Fig. 4, were produced with 8-s bins; the corresponding fluxes are plotted in Fig. 5. A linear fit to this flux–flux diagram gives a slope of −(7.3 ± 1.6) × 10−4 under a reduced χ2 of 0.7 (15 d.o.f.), and a correlation coefficient of −0.8. The possible time delay between the two energy bands was investigated with 1-s-bin light curves as well.6 We utilized a cross-correlation and a throwing-dot method to estimate the time lag and its error, and derived a value of 2.4 ± 1.5 s (shown in Fig. 6). In practice, the throwing-dot method is that for bursts in group B we combined the 1-s-bin light curves at 2–10 keV and 30–50 keV, respectively, and conservatively subtracted off the excess in the 30–50 keV band, although it has little influence on the time delay. Then, we sampled the light curve by assuming that the flux for each bin has a Gaussian distribution, and estimated the time delay with a cross-correlation method. By sampling the light curve a thousands times, the distribution of the resulted time delay was fitted with a Gaussian for inferring the error.
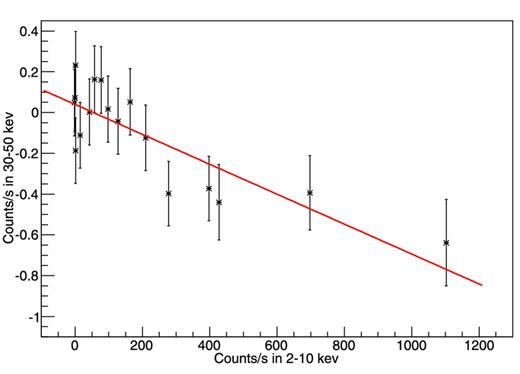
Evolution for the average burst fluxes in the 2–10 keV band against the ones at the 30–50 keV band. The 8-s-bin average burst fluxes are derived from combining the bursts enclosed in group B, which corresponds to the top and bottom panel in Fig. 4. The line shows a linear fit to the data.

The cross-correlation between fluxes of 2–10 keV and 30–50 keV for bursts combined in group B. The fluxes are derived in bins of 1 s. The curve shows a Gaussian fit to the data for estimating the time lag in these two energy bands. The y-axis denotes the cross-correlation factor derived between the light curves in the 2–10 keV and 30–50 keV bands.
STATE TRANSITION
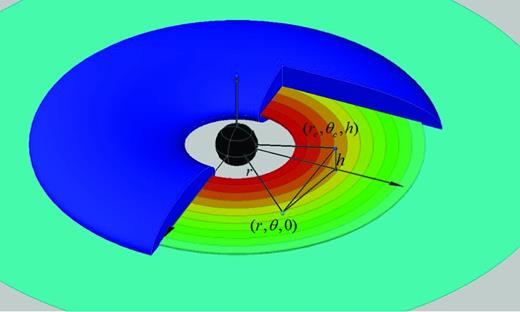
The NS–disc–corona system adopted in our analysis. The blue pancake represents the corona (in order to look at it more clearly, we cut a cross-section). The colours in the annular rings show a cooling accretion disc at larger radii.
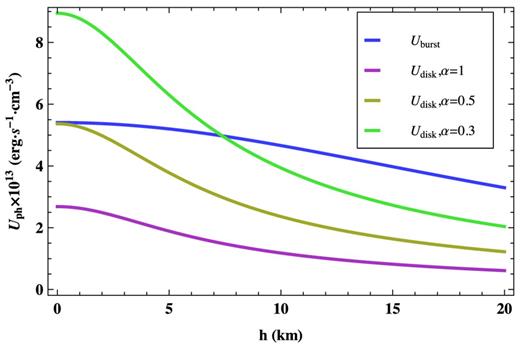
Evolution of Uburst (Udisc/α) as a function of the corona height with respect to the disc under different values of α, where Uburst and Udisc are the energy densities of the seed photons derived from the bursts and the disc, respectively. The intersection shows the possible height of the corona when r is fixed at 25 km.
To further investigate the possible location of the corona while transferring into an HSS, we plot in Fig. 9 the evolution of the corona height as a function of the inner disc radius, under the condition that Uburst and Udisc are equal. In this figure, we take an inversely proportional correlation between Rin and Tin, with a coefficient of 14.36 derived from the data in Weng & Zhang (2011). The correlation was derived in a form of Tin = 14.36/Rin + 0.22. Here, α is set to 1, and a constant of 0.22 is added to have Tin ∼ 0.7 keV at Rin ∼ 30 km, consistent with the parameter considerations of Fig. 8. Fig. 9 may be regarded as a possible upper limit of the vertical height with respect to the underlying disc, beyond of which the corona would not be efficiently cooled by the disc soft X-rays. Theoretically, a corona could be held up stably on top of the disc due to the pressure balance from gravity, magnet and gas. Here, we follow Narayan & Yi (1995) for estimating the possible corona/disc relationship. By assuming a standard viscosity parameter α ∼ 0.01, 80 per cent energy releasing in the disc propagation to the hot flow, and a ratio of gas pressure to magnetic pressure ∼2 (weak magnetic field), a ratio of corona vertical height to the radial distance (h/r) can be approximately estimated as 0.8 (Narayan & Yi 1995). Alternatively, a ratio of about 0.3 was derived for Sgr A in numerical calculation performed by Manmoto, Mineshige & Kusunose (1997). Therefore, as seen in Fig. 9, an h/r value of around 0.3–0.8 would lead to a readily cooled corona at a region near the compact object but not once further away. We see in Fig. 9 that the disc emission is sufficient for cooling the corona once the latter is located in the vicinity of the disc. The corona is more likely cooled by disc emission at small inner radii. This is consistent with what is detected in outburst of XRBs: changes into an HSS while the disc moves towards the compact star. At a larger inner disc radius, the evolution shown in Fig. 9 is smoother; in the LHS, the corona can be effectively cooled by disc emissions only if located in the vicinity of the disc. Those failed outburst as detected in the XRB H1743−322 (Chen et al. 2010) may have kept their corona at least a few km away from the disc during the entire outbursts to prevent an effective corona cooling.
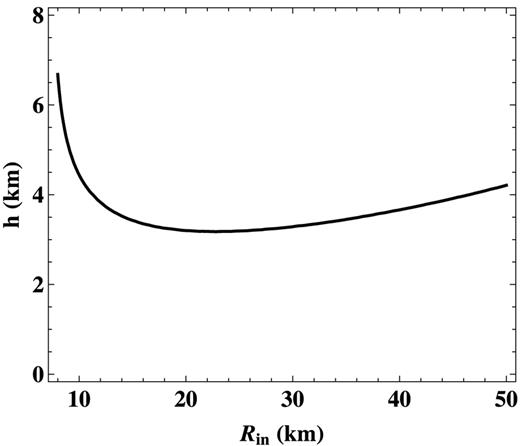
The possible height of the corona with respect to the disc when Uburst and Udisc are equal. The vertical axis shows the corona height, and the horizontal axis represents the innermost radius of the disc during outbursts.
DISCUSSION AND SUMMARY
The shortage of hard X-ray during bursts might be a probe of evolution of an XRB outburst. In the LHS of an XRB, the hard X-rays can come from a hot corona or a jet. A jet would usually show well in the radio band. Quantitatively, the BH binaries are ∼30 times louder in radio than atoll sources at similar Eddington luminosity (Migliari et al. 2004). The correlation between LJ and LX (the luminosity in radio and X-rays, respectively) is quite different between NS and BH XRBs: LJ ∝ LX in NSs, while |$L_{\rm J} \propto L_{\rm X}^{0.5}$| in BHs. This difference likely indicates that BHs are jet dominated while NSs are not (Migliari & Fender 2006; Migliari et al. 2010). As one example, Migliari et al. (2010) concluded that synchrotron self-Compton emission alone, from the post-shock jet particles, is not a viable mechanism to explain the observed hard X-ray tail of NS 4U 0614+091. This result indicates that hot plasma exists close to the NS in the form of a corona, where the hard X-ray emission is associated with the accretion disc boundary layers. We thus discuss our results mainly in a context of a dominant corona–disc radiation.
To investigate the possible cooling of the corona by soft X-ray bursts, we studied 114 bursts embedded in the X-ray evolution of 4U 1636−536. We subdivided these bursts in two groups, according to the hardness ratio as monitored by RXTE/ASM and Swift/BAT. We found that in group B, when the source had harder spectrum and therefore higher flux at hard X-rays, there is a hint for an anticorrelation between the hard and the soft X-rays, similar to what was found for IGR 17473−2721. During the bursts, the flux at 30–50 keV decreased by roughly 40 per cent, likely indicating that the corona was only partially cooled by the additional soft X-rays showers fed by the bursts. As discussed in Chen et al. (2012), this may suggest that the corona is not fully covering the surface of NS, but that it is perhaps located over the disc.
The hard X-ray shortage lags that of the soft X-rays by 2.4 ± 1.5 s. Such a time lag is comparable to the one found in IGR J17473−2721, and can be regarded as a time-scale for cooling and recovering of the corona. It is hard to explain a corona evolution on a second time-scale within a traditional disc evaporation theory (Meyer & Meyer-Hofmeister 1994; Esin et al. 1997; Frank et al. 2002; Liu et al. 2007). In these models, the corona is thought to be a result of the disc viscosity, and therefore its formation has a typical time-scale of a few days. As discussed in Chen et al. (2012), an alternative model that allows such a fast evolution is magnetic field re-connection, which Zhang et al. (2000), Zhang (2007) and Mayer & Pringle (2007) argued for the corona formation in the solar atmosphere. The magnetic field in the inner accretion disc region can be estimated as 108 G (Zhang et al. 2000), consistent with that inferred from the propeller effect (Weng & Zhang 2011). However, no characteristic magnetic field – essential for re-connection in the disc – is indicated in current models, and the disc magnetic field remains unknown.
We acknowledge support from 973 programme 2009CB824800 and the National Natural Science Foundation of China via NSFC 11073021, 11133002, 11103020 and XTP project XDA04060604. DFT's work is done in the framework of the grants AYA2009-07391, AYA2012-39303, SGR2009- 811 and iLINK2011-0303. DFT was additionally supported by a Friedrich Wilhelm Bessel Award of the Alexander von Humboldt Foundation.
NOTE ADDED IN PRESS
After this manuscript was accepted for publication, we became aware of a previous work in which a reduction of the hard X-ray flux during a type I burst of Aql X-1 was found at a significance of about 2 sigma (Maccarone & Coppi 2003).
The outburst in IGR J17473−2721 had a long-lived preceding LSS (lasting about two months), this stable plateau represents a significant difference in comparison to the sharp peak usually seen in atoll sources, like Aql X-1 (Zhang et al. 2009).
For more information about ASM and BAT, see: http://heasarc.gsfc.nasa.gov/xte_weather/ and http://swift.gsfc.nasa.gov/docs/swift/results/transients/.
Please see the website: http://heasarc.nasa.gov/docs/xte/recipes/pca_deadtime.html.
The cross-correlation was calculated with the software crosscro, and detailed information is available at http://heasarc.gsfc.nasa.gov/ftools/fhelp/crosscor.txt.
If we assume the excess observed in Group A is real, it can be subtracted off in the 30–50 keV flux of bursts in group B by scaling the excess derived in group A according to the difference in burst peak fluxes averaged over group A and B at 2–10 keV band. We therefore subtracted this excess off the 30–50 keV fluxes for group B and derived a revised hard X-ray light curve in the lowest panel of Fig. 4.
We used 1-s-bin light curves because for a smaller time interval, e.g. 0.5 s, the statistics are insufficient to estimate time lags.


