


Abstract
Glucagon, secreted by the pancreatic α-cells, stimulates insulin secretion from neighboring β-cells by cAMP- and protein kinase A (PKA)-dependent mechanisms, but it is not known whether glucagon also modulates its own secretion. We have addressed this issue by combining recordings of membrane capacitance (to monitor exocytosis) in individual α-cells with biochemical assays of glucagon secretion and cAMP content in intact pancreatic islets, as well as analyses of glucagon receptor expression in pure α-cell fractions by RT-PCR. Glucagon stimulated cAMP generation and exocytosis dose dependently with an EC50 of 1.6–1.7 nm. The stimulation of both parameters plateaued at concentrations beyond 10 nm of glucagon where a more than 3-fold enhancement was observed. The actions of glucagon were unaffected by the GLP-1 receptor antagonist exendin-(9-39) but abolished by des-His1-[Glu9]-glucagon-amide, a specific blocker of the glucagon receptor. The effects of glucagon on α-cell exocytosis were mimicked by forskolin and the stimulatory actions of glucagon and forskolin on exocytosis were both reproduced by intracellular application of 0.1 mm cAMP. cAMP-potentiated exocytosis involved both PKA-dependent and -independent (resistant to Rp-cAMPS, an Rp-isomer of cAMP) mechanisms. The presence of the cAMP-binding protein cAMP-guanidine nucleotide exchange factor II in α-cells was documented by a combination of immunocytochemistry and RT-PCR and 8-(4-chloro-phenylthio)-2′-O-methyl-cAMP, a cAMP-guanidine nucleotide exchange factor II-selective agonist, mimicked the effect of cAMP and augmented rapid exocytosis in a PKA-independent manner. We conclude that glucagon released from the α-cells, in addition to its well-documented systemic effects and paracrine actions within the islet, also represents an autocrine regulator of α-cell function.
GLUCAGON IS A 29-amino acid peptide produced from proglucagon in pancreatic α-cells. The main physiological action of glucagon is to stimulate the hepatic glucose production by promoting breakdown of liver glycogen (1). Glucagon is released from the pancreatic α-cells through Ca2+-dependent exocytosis (2). This process is regulated by metabolic and hormonal/neuronal signals. Examples of the latter include epinephrine (2), glucagon-like peptide 1 (GLP-1), glucose-dependent insulinotropic polypeptide (GIP) (3), and somatostatin (4). Epinephrine binds to the β-adrenergic receptor of the α-cell (5). This is followed by increase of cAMP and protein kinase A (PKA)-dependent enhancement of the exocytotic response (4). The incretin hormones GLP-1 and GIP likewise stimulate exocytosis in the α-cell in a PKA-dependent fashion (3). Several mechanisms are affected by cAMP in α-cells. These include mobilization of Ca2+ from intracellular stores (6), stimulation of Ca2+ influx through voltage-dependent Ca2+ channels (2, 7) and a direct effect on exocytosis manifested as increased release competence of the secretory granules (3).
In pancreatic β-cells, cAMP stimulates exocytosis by both PKA-dependent and -independent mechanisms (8–10). The PKA-independent stimulation of the exocytotic machinery in the β-cell involves cAMP-guanidine nucleotide exchange factor II (GEFII) (8, 11). cAMP-GEFII interacts with the Rab-interacting molecule Rim2 (11), which has been implicated in vesicle priming (12). However, Rim2 not only interacts with Rab proteins but also with the soluble N-ethylmaleimide sensitive factor-attachment protein receptor proteins SNAP-25 (synaptosomal protein of 25 kDa) and synaptobrevin (13), suggesting that it may also influence the exocytotic process itself.
The biological effects of glucagon are exerted via binding to a seven-transmembrane G protein-coupled receptor (14), which results in the activation of adenylate cyclase and generation of cAMP. The glucagon receptor is expressed in many tissues including pancreas (15). In the insulin-secreting β-cells, capacitance measurements have revealed that GLP-1 and glucagon stimulates insulin secretion by binding to different receptors (16). However, the effects of glucagon on glucagon secretion remain obscure and are difficult to evaluate using traditional biochemical technology. Here we have applied measurements of membrane capacitance to explore the possibility that glucagon regulates exocytosis in the glucagon-secreting α-cells. Such a regulation is suggested by analogy to the situation in the pancreatic β-cell where insulin has been found to modulate its own secretion (17, 18). We demonstrate that glucagon does indeed modulate α-cell exocytosis, raising the possibility that glucagon represents an autocrine regulator of its own release.
RESULTS
Glucagon Stimulates Exocytosis in Mouse and Rat α-Cells
We have previously reported that agents increasing the intracellular cAMP level, such as GLP-1 and GIP, stimulate exocytosis in isolated rat α-cells (3). Here we extend these observations by examining possible effects of the α-cell hormone glucagon on α-cell exocytosis. Exocytosis was monitored as increases in cell capacitance. This technique monitors the increase in α-cell surface area that occurs when the glucagon-containing secretory granules fuse with the plasma membrane. Ultrastructural evidence suggests that the exocytotic fusion of one glucagon-containing secretory granule leads to a capacitance increase of 2 fF (19). Figure 1A illustrates the exocytotic responses (measured as increases in cell capacitance) elicited by a train of ten 500-msec voltage-clamp depolarizations from −70 mV to zero mV in a mouse α-cell under control conditions, after addition of 10 nm glucagon and in the simultaneous presence of glucagon and 10 μm of the PKA inhibitor Rp-cAMPS (adenosine-3′,5′-cyclic monophosphorothioate, Rp-isomer). Under control conditions, the capacitance increases elicited by the first depolarization and the entire train averaged 45 ± 9 fF and 179 ± 30 fF (n = 5), respectively. After addition of glucagon, the amplitude of the capacitance increase elicited by the first pulse increased approximately 4-fold and averaged 184 ± 45 fF (n = 6; P < 0.02). The total increase during the entire train increased 2.5-fold and amounted to 440 ± 85 fF (n = 6; P < 0.02). The stimulatory effect of glucagon could be antagonized by Rp-cAMPS and in the simultaneous presence of glucagon and Rp-cAMPS, the capacitance increases evoked by the first depolarization and the entire train were reduced to 63±19 fF and 172 ± 60 fF, respectively (n = 4; both values statistically different at P < 0.05 from those observed in the presence of glucagon alone). These data suggest that the stimulatory action of glucagon on α-cell exocytosis, at least at the concentration used, is mediated by activation of PKA.
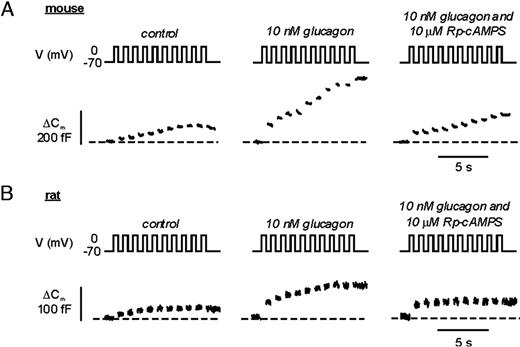
Glucagon Potentiates Exocytosis in Pancreatic α-Cells A, Increases in membrane capacitance in single mouse α-cells. Exocytosis was evoked by a train of ten 500-msec depolarizations from −70 mV to 0 mV applied at 1 Hz and performed using the perforated patch technique under control conditions, in the presence of 10 nm glucagon and in the simultaneous presence of glucagon and 10 μm Rp-8-Br-cAMPS. B, Same as in A but the experiments were conducted using rat α-cells. Traces shown in A and B represent continuous recordings from the same mouse or rat α-cell, respectively.
We next performed similar experiments in rat α-cells (Fig. 1B). The exocytotic responses in rat α-cells were somewhat smaller than in mouse α-cells. Under control conditions, the increase in membrane capacitance during the first depolarization was 17 ± 3 fF (n = 6) and the total increase elicited by the entire train amounted to 47 ± 7 fF (n = 6). These values increased to 63 ± 8 fF and 132 ± 11 fF (n = 6; both values statistically different from controls at P < 0.001) after application of 10 nm glucagon. In the simultaneous presence of both glucagon and Rp-cAMPS, the increase in membrane capacitance evoked by the first depolarization and the entire train amounted 56 ± 10 fF (n = 6; P < 0.01 vs. control) and 77 ± 11 fF (n = 6, P < 0.01 vs. in the presence of glucagon alone), respectively.
Glucagon Stimulation of Exocytosis Echoes Enhancement of cAMP Generation
Glucagon produces a dose-dependent stimulation of cAMP production in pure α-cell fractions (Fig. 2A). No stimulation was observed at 0.3 nm or less, but higher concentrations elicited a dose-dependent enhancement of secretion. EC50 was observed at a concentration of 1.7 nm. Maximal stimulation of cAMP production was seen at concentrations of glucagon exceeding 10 nm, at which cytoplasmic cAMP levels were increased 320% (P < 0.01; n = 5) over the control, from a basal value of 8 amol/cell to more than 30 amol/cell. A similar dose-response relationship was observed for the stimulatory action of glucagon on exocytosis, which exhibited an EC50 of 1.6 nm. Maximally effective concentrations of glucagon (≥10 nm) stimulated exocytosis by 230% (P < 0.01; n = 5; Fig. 2B).
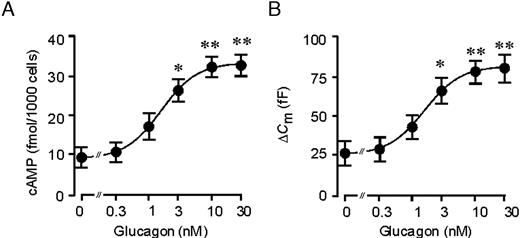
Dose-Dependent Stimulation of cAMP Production and Exocytosis by Glucagon A, Batches of rat α-cells (2000 cells/well) were incubated in 1 mm glucose with 0–30 nm glucagon. In all experiments, 0.5 mm of the phosphodiesterase inhibitor IBMX was included in the incubation medium. Cellular cAMP content was determined after 15 min incubation. Data are mean values ± sem of five to seven experiments. The curve represents a least-squares fit of the mean data points to the Hill equation. B, Dose-response relationship for glucagon-induced stimulation of exocytosis. The line is the best fit of the average data to the Hill equation. Data are mean values ± sem of five to seven experiments.
Glucagon Increases a Rapid Component of Exocytosis in Pancreatic α-Cells
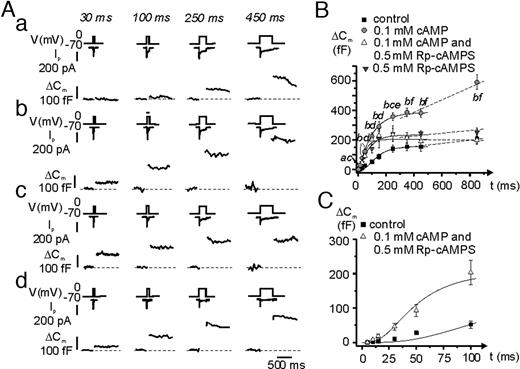
Secretory granules in hormone-releasing cells, including pancreatic α-cells (19), can be classified according to their release competence (20). A limited pool of vesicles is immediately available for release and undergoes rapid exocytosis upon stimulation (the readily releasable pool; RRP). Once this pool of granules has been released, exocytosis proceeds at a slower rate, which is determined by the speed at which new granules become available for release. To dissect the mechanisms controlled by glucagon, we applied progressively longer (5–850 msec) depolarizations from −70 to zero mV to single mouse α-cells using the perforated patch configuration under control conditions (Fig. 3A-a), after addition of 10 nm glucagon (Fig. 3A-b) and in the simultaneous presence of 10 nm glucagon plus 10 μm of the PKA-inhibitor Rp-cAMPS (Fig. 3A-c). The interval between two successive stimulations was 15 sec for the shorter and 30 sec for the longer (≥100 msec) depolarizations. The data are summarized in Fig. 3B, where the capacitance increases (ΔCm) are displayed against the duration of the stimulating pulses (t). The curves thus obtained depict the time course of exocytosis during the first 850 msec of depolarization. Under control conditions, the exocytotic response reached a plateau of approximately 50 fF within approximately 200 msec. Glucagon had no statistically significant effect during depolarizations of 50 msec or less, but the responses to the longer pulses were approximately 2-fold larger than those observed under control conditions. This stimulatory effect was abolished in the presence of Rp-cAMPS, and in the combined presence of glucagon and Rp-cAMPS the data points superimposed.

PKA-Dependent and -Independent Stimulation of Depolarization-Evoked Exocytosis in α-Cells A, Depolarizations from −70 mV to 0 mV lasting 5–850 msec were applied to single mouse α-cells under control conditions (a); in the presence of 10 nm glucagon extracellular (b); and in the simultaneous presence of glucagon and 10 μm Rp-8-Br-cAMPS (c). The experiments were performed using the perforated patch configuration of the patch-clamp technique. For clarity only the Ca2+ currents and the increases in membrane capacitance evoked by the 30 msec, 100 msec, 250 msec, and 450 msec depolarization are shown for each of the three different conditions. The traces shown were obtained in the same α-cell. B, Relationship between pulse duration (t) and increase in membrane capacitance (ΔCm) under control conditions (black squares), in the presence of glucagon (gray circles) and in the presence of both glucagon and Rp-cAMPS (white triangle). The curves were derived by fitting equation 1 to the mean values of the data points for t values of 450 msec or less. The dotted lines were achieved by linear approximation between the ΔCm value at t = 350 msec to the ΔCm value at t = 850 msec. Data are mean values of 13–25 experiments. a, P < 0.05; b, P < 0.01; and c, P < 0.001 for comparison between glucagon and control; d, P < 0.05 for comparison between glucagon alone with the combination of glucagon and Rp-cAMPS.
By fitting the solution of equation 1 (see Materials and Methods) to the data points, the initial size of RRP could be estimated. Table 1 summarizes how RRP varies under different experimental conditions. It can be seen that glucagon doubles the size of RRP and that the effect was reversed by application of Rp-cAMPS. Also shown in Table 1 are the mean rates of refilling (ΔCm350–850/Δt). Although glucagon tended to increase the ΔCm350–850/Δt value, the effect did not reach statistical significance.
Summary of the Effects of Glucagon, cAMP, PKA Inhibitors, and cAMP-GEFII Agonists on Exocytosis in Wild-type and SUR1−/− α-Cells
| Line | Condition | RRP (fF) | ΔCm/Δt350–850 (fFs−1) | n | |
|---|---|---|---|---|---|
| Wild-type perforated patch | 1 | Control | 71 ± 17 | 32 ± 14 | 19 |
| 2 | 10 nm glucagon | 150 ± 23a | 47 ± 22 | 25 | |
| 3 | 10 nm glucagon and 10 μm Rp-Br-cAMP | 64 ± 12b | 15 ± 19 | 13 | |
| Wild-type standard whole cell | 4 | Control | 198 ± 29 | 87 ± 48 | 24 |
| 5 | 0.1 mm cAMP | 405 ± 28c | 414 ± 78d | 27 | |
| 6 | 0.1 mm cAMP and 0.5 mm Rp-cAMPS | 230 ± 34e | −27 ± 49 | 14 | |
| 7 | 0.5 mm Rp-cAMPS | 272 ± 30 | 73 ± 53 | 4 | |
| 8 | 0.1 mm 8CPT-2Me-cAMP | 306 ± 40f | N.D. | 9 | |
| 9 | 0.1 mm 8CPT-2Me-cAMP and 0.5 mm Rp-cAMPS | 266 ± 48 | N.D. | 7 | |
| SUR1−/− standard whole cell | 10 | Control | 25 ± 6 | 19 ± 12 | 4 |
| 11 | 0.1 mm cAMP | 113 ± 18g | 156 ± 49 | 7 | |
| 12 | 0.1 mm cAMP and 0.5 mm Rp-cAMPS | 48 ± 15h | 5 ± 9 | 6 |
The initial size of RRP was derived by fitting the solution of equation 1 to the data points in Figs. 3B, 5B, and 7B. ΔCm/Δt350–850 is the measured rate of capacitance increase occurring between 350 msec and 850 msec. Data are presented as mean values ± sem. Statistical significances refer to comparisons within the same column.
P < 0.05 vs. line 1;
P < 0.05 vs. line 2;
P < 0.001 vs. line 4;
P < 0.01 vs. line 4;
P < 0.001 vs. line 5;
P < 0.05 vs. line 4;
P < 0.01 vs. line 10; and
P < 0.05 vs. line 11. N.D., Not possible to determine.
cAMP Potentiates Depolarization-Evoked Exocytosis in Mouse Pancreatic α-Cells A, Depolarizations from −70 mV to 0 mV lasting 5–850 msec were applied to single mouse α-cells under control conditions (a); after inclusion of 0.1 mm cAMP in the intracellular medium (b); in the simultaneous presence of 0.1 mm cAMP and 0.5 mm Rp-cAMPS (c); and in the presence of 0.5 mm Rp-cAMPS alone (d). The experiments were performed using the standard whole-cell configuration of the patch-clamp technique. For clarity only the Ca2+ currents and the increases in membrane capacitance evoked by the 30-, 100-, 250-, and 450-msec depolarization are shown for each of the three different conditions. Different cells were used in traces a–d, but any series of recordings were made on the same cell. B, Relationship between pulse duration (t) and increase in membrane capacitance (ΔCm) under control conditions (black squares), in the presence of 0.1 mm cAMP (gray circles), in the presence of both 0.1 mm cAMP and 0.5 mm Rp-cAMPS (white triangles) and in the presence of Rp-cAMPS alone (gray triangles). The curves were derived by fitting equation 1 to the mean values of the data points for t ≤ 450 ms. The dotted lines were achieved by linear approximation between the ΔCm value at t = 350 msec to the ΔCm value at t = 850 msec. Data are mean values of 24, 27, 14, and 4 experiments under control conditions, in presence of cAMP, in the simultaneous presence of cAMP and Rp-cAMPS and in the presence of Rp-cAMPs alone, respectively. a, P < 0.05; b, P < 0.001 for comparisons between cAMP and control. c, P < 0.05 and d, P < 0.001 for comparisons between the combination of cAMP and Rp-cAMPS and control. e, P < 0.05; and f, P < 0.001 for comparisons between cAMP and the combination of cAMP and Rp-cAMPS. C, Same as in B but highlighting the Rp-cAMPS-resistant component by showing data obtained under control conditions (absence of cAMP) and in the simultaneous presence of cAMP and 0.5 mm Rp-cAMPS using an expanded horizontal axis.
A cAMP-GEFII Agonist Stimulates Exocytosis in α-Cells A, Depolarizations (5–250 msec) from −70 mV to 0 mV were applied to single mouse α-cells (only 50 msec and a 250-msec shown for clarity) under control conditions (a); in the presence of 100 μm 8CPT-2Me-cAMP (b); and in the simultaneous presence of 8CPT-2Me-cAMP and 0.5 mm Rp-cAMPS (c). B, Relationship between pulse duration (t) and increase in membrane capacitance (ΔCm) under control conditions (black squares), in the presence of 100 μm 8CPT-2Me-cAMP (gray circles) and in the simultaneous presence of 8CPT-2Me-cAMP and 0.5 mm Rp-cAMPS (white triangles). Data are mean values ± sem of seven to 24 experiments. a, P < 0.05; b, P < 0.01; and c, P < 0.001 for comparison between 8CPT-2Me-cAMP and control; d, P < 0.05; and e, P < 0.01 for comparison of the combination of 8CPT-2Me-cAMP and Rp-cAMPS with control.
Glucagon Stimulates Exocytosis in α-Cells by Binding to Glucagon Receptors
The identity of the membrane receptor mediating the effects of glucagon on the α-cells is debated, and it has been suggested that glucagon acts by binding to the GLP-1 receptors (21). We approached this problem by performing capacitance measurements before and after addition of glucagon in the presence of either a glucagon or a GLP-1 receptor antagonist. As shown in Fig. 4, A and B, glucagon remained capable of stimulating exocytosis in α-cells exposed to the GLP-1 receptor antagonist exendin-(9–39). As expected, GLP-1 was unable to stimulate exocytosis under these conditions. In a series of six experiments, glucagon stimulated exocytosis in the presence of exendin-(9–39) by 163 ± 38%, and no further stimulation was obtained after addition of GLP-1. We conclude that the effects of glucagon are not mediated by binding to the GLP-1 receptor.
![Glucagon Signals via the Glucagon Receptor and Not via the GLP-1 Receptor A, Exocytotic responses elicited by 500-msec depolarizations from −70 mV to 0 mV in the continuous presence of 1 μm of the GLP-1 receptor antagonist exendin(9–39). The measurements were carried out on single mouse α-cells using the perforated patch technique and in the same cell in the presence of the antagonist alone, 2 min after application of 10 nm glucagon and 2 min after the application of 10 nm GLP-1. B, Summary of the experiments in A. Data are mean values ± sem of six experiments. **, P < 0.01. C, Same as in A but measurements were performed under control conditions, 2 min after the application of 1 μm of the glucagon receptor antagonist des-His1-[Glu9]-glucagon-amide and 2 min after the addition of glucagon in the continuous presence of the antagonist. Similar result was observed in rat α-cells and in a series of five experiments it was proved that glucagon was unable to increase the exocytotic response in the presence of des-His(1)-[Glu9]-glucagon-amide (data not shown). D, Summary of data in C. Data are mean values ± sem of seven experiments. E, Same as in C but instead applying GLP-1. F, Summary of the experiments in E. Data are mean values ± sem of six experiments. G, RT-PCR analyses of glucagon receptor expression in rat islets (isl) and FACS purified rat α- and β-cells as indicated. In the negative control reactions (−), reverse transcriptase was omitted. Bands of the predicted size (447 bp; arrow) were obtained after 36 amplification cycles. A molecular weight standard is shown to the right.](https://oup.silverchair-cdn.com/oup/backfile/Content_public/Journal/mend/19/1/10.1210_me.2004-0059/2/m_zmg0010514380004.jpeg?Expires=1750597242&Signature=Zhe-yHru1o5nUWrFDlLP4u1~lQlsNeZMuSC8S1~tFLczN6ke4eVRK9zltLocB-XcEbwNo6RNC0XK6eQoAbKK7DkGNdWslBgg7YtSkY0V2c8pDVXEhfmywRBSDHFF~6xSK71SmLZh5zfvqbnIKbBC7~yjJiztPtMqdamQXsGAiVlenaWnOWdueSK9c6qtifj1ddDInlW8D0RQHgTSPtODs5s6h8aVOAEX2a251f-REGcImJHGikqMFuLycikx1oQuCpLn5CKA4nf0NrBSnHVX8HDxW0boXr6duG0~LEnDVRx42kr2l3uUwXbfbJR1QR1Cq3duR4Q31GX~DzbMuIR4~g__&Key-Pair-Id=APKAIE5G5CRDK6RD3PGA)
Glucagon Signals via the Glucagon Receptor and Not via the GLP-1 Receptor A, Exocytotic responses elicited by 500-msec depolarizations from −70 mV to 0 mV in the continuous presence of 1 μm of the GLP-1 receptor antagonist exendin(9–39). The measurements were carried out on single mouse α-cells using the perforated patch technique and in the same cell in the presence of the antagonist alone, 2 min after application of 10 nm glucagon and 2 min after the application of 10 nm GLP-1. B, Summary of the experiments in A. Data are mean values ± sem of six experiments. **, P < 0.01. C, Same as in A but measurements were performed under control conditions, 2 min after the application of 1 μm of the glucagon receptor antagonist des-His1-[Glu9]-glucagon-amide and 2 min after the addition of glucagon in the continuous presence of the antagonist. Similar result was observed in rat α-cells and in a series of five experiments it was proved that glucagon was unable to increase the exocytotic response in the presence of des-His(1)-[Glu9]-glucagon-amide (data not shown). D, Summary of data in C. Data are mean values ± sem of seven experiments. E, Same as in C but instead applying GLP-1. F, Summary of the experiments in E. Data are mean values ± sem of six experiments. G, RT-PCR analyses of glucagon receptor expression in rat islets (isl) and FACS purified rat α- and β-cells as indicated. In the negative control reactions (−), reverse transcriptase was omitted. Bands of the predicted size (447 bp; arrow) were obtained after 36 amplification cycles. A molecular weight standard is shown to the right.
We next performed similar experiments in the presence of the glucagon receptor antagonist des-His1-[Glu9]-glucagon-amide (Fig. 4, C and D). Under these conditions, glucagon failed to stimulate exocytosis and the amplitude of the capacitance increases elicited by 500-msec depolarizations from −70 mV to zero mV measured in the presence of the hormone averaged 116 ± 10% (n = 8) of that observed under control conditions (glucagon antagonist alone). The latter value is not statistically different from the control. It was ascertained that the glucagon antagonist itself had no effect on exocytosis (not shown). By contrast, GLP-1 remained capable of stimulating exocytosis when applied in the presence of des-His1, [Glu9)]-glucagon-amide and the increase in membrane capacitance rose by 420 ± 67% (n = 5, P < 0.01; Fig. 4, E and F). This stimulation is comparable to that we have reported previously (3). Measurements of cAMP production (Table 2) revealed that neither of the antagonists affected basal cAMP production but that des-His1-[Glu9]-glucagon-amide abolished the ability of glucagon to elevate the α-cell cAMP content. Finally, the ability of a maximally effective concentration of glucagon (10 nm) to elevate cAMP was compared with that of GLP-1 and the adenylate cyclase activator forskolin. The stimulation of cAMP content elicited by glucagon was similar to that of GLP-1 but only 29% of that produced by forskolin.
Effects of Glucagon, Forskolin, GLP-1, and GLP-1 and Glucagon Receptor Antagonists on cAMP Production in Rat α-Cells
| Condition | Line | cAMP Production (fmol/1000 cells) |
|---|---|---|
| Control | 1 | 9.1 ± 2.7 |
| 10 nm Glucagon | 2 | 32.0 ± 3.3a |
| 10 nm Glucagon and 1 μm [desHis,des-phe,Glu]glucagon-NH2 | 3 | 11.2 ± 2.1b |
| 1 μm des-His1,[Glu9]-glucagon amide | 4 | 10.2 ± 4.1 |
| 1 μm Exendin 9–39 | 5 | 9.7 ± 2.4 |
| 10 nm Glucagon and 1 μm Exendin 9–39 | 6 | 31.0 ± 3.4a |
| 10 μm Forskolin | 7 | 112 ± 6c |
| 10 nm GLP-1 | 8 | 27.6 ± 3.4 |
Data are presented as mean values ± sem of indicated number of five to six experiments.
P < 0.05 vs. control;
P < 0.05 vs. glucagon; and
P < 0.001 vs. control.
Pancreatic α-Cells Express Glucagon Receptors
Using glucagon receptor-specific primers and RT-PCR, an mRNA fragment with the expected size (447 bp) was detected in whole rat islets as well as in pure α- and β-cell fractions obtained by fluorescence-activated cell sorting (FACS) (Fig. 4G). The identity of the band was confirmed by sequencing. The most prominent PCR product in the α-cell fraction was of longer size (930 bp). This band was also detected in rat islets and β-cells, and sequencing revealed that this band corresponds to unspliced or incompletely spliced glucagon receptor mRNA. The fact that it was not observed in the negative control reactions makes it unlikely it was attributable to genomic DNA contamination. Similar observations have previously been made in both rat hepatocytes and cardiomyocytes (22).
cAMP Mimics the Effects of Glucagon on Exocytosis in Mouse Pancreatic α-Cells
The effects of glucagon on cAMP content and exocytosis showed the same concentration dependence (Fig. 2). We therefore investigated whether the effects of glucagon on exocytosis in α-cells are mimicked by intracellular cAMP application. Figure 5A shows examples of exocytotic responses evoked by voltage-clamp depolarizations of increasing duration under control conditions (a); in the presence of 0.1 mm cAMP 2 (b); in the simultaneous presence of 0.1 mm cAMP and 0.5 mm Rp-cAMPS (c); and in the presence of Rp-cAMPS alone (d). These data were analyzed as described for Fig. 3 and the results are summarized in Fig. 5B and Table 1. Under control conditions, RRP was estimated to be approximately 200 fF (100 granules). This was doubled after inclusion of 0.1 mm cAMP in the intracellular solution, an effect that was abolished by Rp-cAMPS (Table 1, lines 4–6). Rp-cAMPS was without effect when applied on its own (i.e. in the absence of cAMP, line 7). However, comparing the responses obtained with a combination of cAMP and Rp-cAMPS with the control data (no cAMP; Fig. 5C) revealed an early (during pulses ≤150 msec) apparently PKA-independent component of exocytosis. During longer depolarizations, an additional linear component of capacitance increase was observed in the presence of cAMP (Fig. 5B) and there was a 5-fold increase in the ΔCm/Δt350–850 value. The latter component was completely suppressed in the presence of Rp-cAMPS (Fig. 5B and Table 1).
cAMP Stimulates Exocytosis in α-Cells via cAMP-GEFII
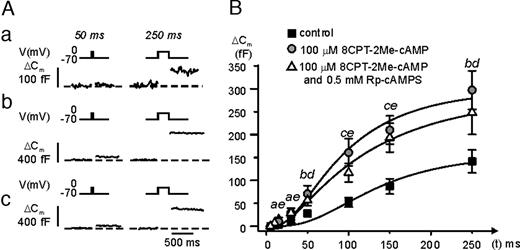
In pancreatic β-cells, cAMP stimulates exocytosis by both PKA-independent and PKA-dependent pathways (8, 10); the latter mechanism being mediated by the cAMP-sensing protein cAMP-GEFII. Does this also apply to glucagon-releasing α-cells? Using confocal immunocytochemistry, we first demonstrated the presence of strong cAMP-GEFII immunoreactivity in mouse and rat α-cells (Fig. 6A). Expression of cAMP-GEFII was also detected using RT-PCR in rat α-cells, as well as in rat β-cells and intact islets (Fig. 6B). Thus, cAMP-GEFII may be involved in the regulation of α-cell exocytosis by cAMP. We explored this possibility by inclusion of the specific cAMP-GEFII-agonist 8-(4-chloro-phenylthio)-2′-O-methyl-cAMP (8CPT-2Me-cAMP) in the pipette solution dialyzing the cell interior during standard whole cell recordings. The α-cells were stimulated by progressively longer voltage-clamp depolarizations from −70 mV to zero mV (cf.Figs. 3 and 5). Figure 7A shows the responses under control conditions (a); after addition of 0.1 mm 8CPT-2Me-cAMP (b); and in the simultaneous presence of 0.1 mm 8CPT-2Me-cAMP and 0.5 mm Rp-cAMPS (c). It is clear that 8CPT-2Me-cAMP strongly stimulated exocytosis and that the effect was resistant to PKA inhibition. These results are summarized in Fig. 7B and Table 1 (lines 8 and 9). The cAMP-GEFII agonist produced a statistically significant stimulation of exocytosis already during a 15-msec depolarization exocytosis. The relative stimulation was greatest during pulses lasting 100 msec, where 8CPT-2Me-cAMP increased exocytosis 3.1-fold. A stimulatory action of 8CPT-2Me-cAMP on exocytosis was also detectable in rat α-cells; cAMP-GEFII enhanced exocytosis elicited by a 500-msec depolarization 3-fold, from 24±7 fF (n = 4) under control conditions to 75 ± 10 fF (n = 5; P < 0.01) in the presence of 8CPT-2Me-cAMP (not shown).
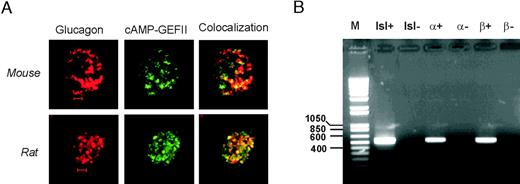
cAMP-GEFII Is Expressed in Both Mouse and Rat α-Cells A, Distribution of glucagon (red, left) and cAMP-GEFII (EPAC) immunoreactivity (green, middle) and colocalization of the two (yellow, right) in a mouse (upper) and a rat α-cell (lower). Scale bars: 2 μm. B, RT-PCR analyses of cAMP-GEFII expression in rat islets (isl) and FACS purified rat α- and β-cells as indicated. In the negative control reactions (−), reverse transcriptase was omitted. PCR products were analyzed on 1% agarose gels and bands of the predicted size (554 bp) were obtained after 36 amplification cycles. A molecular weight standard (M) is shown to the left.
PKA-Independent Component of Glucagon Secretion in Rat α-Cells
The involvement of both PKA and cAMP-GEFII in the stimulation of exocytosis was confirmed by measurements of glucagon release from intact rat islets using forskolin, which like glucagon increases intracellular cAMP, albeit more potently (Table 2, compare lines 2 and 7). Table 3 demonstrates that forskolin (10 μm) stimulated glucagon release 3.2-fold, an effect that was reduced by 42% in the presence of Rp-cAMPS. Interestingly, 100 μm 8CPT-2Me-cAMP stimulated glucagon to an extent similar to that observed in the presence of forskolin and Rp-cAMPS (Table 3, line 4). These findings corroborate the observations made with the capacitance measurements (Fig. 5 and 7 and Table 1) and suggest that in α-cells, the PKA-dependent and -independent pathways of cAMP-induced exocytosis each contribute approximately 50% of the total stimulatory action.
PKA-Independent and PKA-Dependent Stimulation of Glucagon Secretion
| Condition | Glucagon (pg/islet·h) | n |
|---|---|---|
| Control | 28.4 ± 3.7 | 10 |
| 10 μm Forskolin | 91.5 ± 5.6a | 10 |
| 10 μm Forskolin and 100 μm 8 Br-Rp-cAMPS | 64.7 ± 4.6b | 10 |
| 100 μm 8CPT-2Me-cAMP | 66.1 ± 5.4a | 10 |
| Condition | Glucagon (pg/islet·h) | n |
|---|---|---|
| Control | 28.4 ± 3.7 | 10 |
| 10 μm Forskolin | 91.5 ± 5.6a | 10 |
| 10 μm Forskolin and 100 μm 8 Br-Rp-cAMPS | 64.7 ± 4.6b | 10 |
| 100 μm 8CPT-2Me-cAMP | 66.1 ± 5.4a | 10 |
Glucagon secretion was measured from groups of 10 intact rat islets under the conditions indicated to the left. The islets were incubated in 1 mm glucose and stimulated with forskolin (± the PKA inhibitor 8-Br-Rp-cAMPS) or 8CPT-2Me-cAMP as indicated. Data are presented as mean values ± sem of indicated number of experiments.
P < 0.05 vs. control;
P < 0.05 vs. forskolin.
PKA-Independent Component of Exocytosis in α-Cells Requires the Sulfonylurea Receptor Protein 1 (SUR1)
Our previous work has indicated that SUR1, which is part of the ATP-sensitive potassium (KATP) channel, somehow is required for the PKA-independent action of cAMP on β-cell exocytosis (8, 23). Pancreatic α-cells express SUR1 and to examine whether this protein is also involved in the regulation of exocytosis in glucagon-releasing α-cells, capacitance measurements were applied to α-cells from SUR1−/− mice. Exocytosis was elicited by progressively longer membrane depolarizations from −70 mV to zero mV (cf.Figs. 3 and 5). Figure 8A shows the exocytotic responses under control conditions (a); in the presence of 0.1 mm cAMP (b); and in the simultaneous presence of both 0.1 mm cAMP and 0.5 mm Rp-cAMPS (c). The data were analyzed in the same way as described for wild-type α-cells (Fig. 5) and the data are summarized in Fig. 8B and Table 1 (lines 10–12). In the absence of intracellular cAMP, the exocytotic responses were very small and the estimated size of RRP was approximately 25 fF. Introducing cAMP into the cell interior (by inclusion in the pipette solution dialyzing the cell interior) resulted in a robust 4.5-fold increase in RRP, an effect that was completely inhibited by Rp-cAMPS. Importantly, and unlike what was observed in wild-type α-cells (Fig. 5B), the rapid (<150 msec) Rp-cAMPS-resistant component of exocytosis was not observed in SUR1−/− α-cells. cAMP also elicited a late component of exocytosis and the ΔCm/Δt350–850 value rose 8-fold, an effect that was likewise abolished by Rp-cAMPS.

Loss of PKA-Independent Component of Exocytosis SUR1−/− α-Cells A, Same as Fig. 5A but using SUR1−/− mouse α-cells. B, Summary of data obtained in experiments of the type displayed in A under control conditions (black squares), in the presence of 0.1 mm cAMP (gray circles) and in the simultaneous presence of cAMP and 0.5 mm Rp-cAMPS (white triangles). The data are mean values ± sem of five to eight experiments. a, P < 0.05 and b, P < 0.01 for comparison between cAMP and control; c, P < 0.05 and d, P < 0.01 for comparison between cAMP and the combination of cAMP and Rp-cAMPS.
DISCUSSION
Glucagon secretion is released from the pancreatic α-cells by Ca2+-dependent exocytosis in a process modulated by agents elevating intracellular cAMP such as β-adrenergic agonists, GLP-1 and GIP (2, 3, 24). In this study, we show that the α-cell contains glucagon receptors and that exposure of α-cells to glucagon leads to a concentration-dependent increase in intracellular cAMP and stimulation of exocytosis. Here we discuss the cellular mechanisms involved and the possible functional implications.
Glucagon Stimulates Single-Cell Exocytosis by Binding to the Glucagon Receptor
Exposure of single α-cells to glucagon resulted in a dose-dependent stimulation of exocytosis. The effect became apparent at concentrations greater than 0.3 nm. For comparison, mouse plasma glucagon levels range between a basal 100 pg/ml to 800 pg/ml (25). These levels correspond to 0.03–0.3 nm. For obvious reasons, it is not straight forward to document effects of glucagon on glucagon release using traditional biochemical assays. The rate of glucagon secretion measured at 1 mm glucose (28 pg/islet·h or approximately 10 fmol/islet·h; Table 3) only increases the concentration of the hormone in the incubation medium (0.2 ml) by 50 pm. Using groups of five to 10 islets, the net increase in glucagon concentration due to α-cell exocytosis would be limited to 0.25–0.5 nm. This is only 15–30% of the concentration required even to attain the EC50. These considerations illustrate the usefulness of using capacitance measurements where a change in a biophysical property of the α-cell is used to monitor exocytosis.
The identity of the membrane receptor mediating the effects of glucagon on the α-cells is debated, and it has been suggested that glucagon acts by binding to the GLP-1 receptors (21). Two pieces of evidence argue that the effects are indeed mediated by glucagon receptors. First, pure α-cells express the glucagon receptor gene (Fig. 4G). Second, glucagon remained capable of stimulating exocytosis in the presence of concentrations of the GLP-1 receptor antagonist exendin-(9–39) that abolished the stimulatory effect of GLP-1 itself, whereas the stimulatory effect was abolished in the presence of the glucagon receptor antagonist des-His1-[Glu9]-glucagon-amide (Fig. 4). Further evidence that the actions of glucagon are secondary to its binding to glucagon receptors comes from the measurements of cAMP, which revealed that the ability of the hormone to elevate cAMP was abolished in the presence of the glucagon receptor antagonist (Table 2).
PKA-Independent and PKA-Dependent Stimulation of Glucagon Secretion
Previous experiments have revealed that the stimulation of exocytosis in α-cells produced by epinephrine, GLP-1 and GIP is mediated via activation of PKA (2, 3). Here we demonstrate that the stimulatory effect of glucagon likewise involves activation of PKA and that exocytosis in the presence of glucagon and the PKA-inhibitor Rp-cAMPS was as low as in the complete absence of the hormone (Fig. 3). The results were rather different when glucagon release was stimulated with forskolin (Table 2) or when the intracellular cAMP concentration was clamped to 0.1 mm cAMP during standard whole cell recordings (Fig. 5). Under these circumstances, both PKA-dependent (sensitive to Rp-cAMPS) and PKA-independent (resistant to Rp-cAMPS) components of secretion/exocytosis became detectable. In pancreatic β-cells, the PKA-independent pathway requires a 5-fold higher concentration of cAMP than the PKA-dependent (8). Thus, it seems likely that our failure to detect any Rp-cAMPS-resistant component of secretion in response to the physiological agonists in mouse α-cells is because they, at least under the experimental conditions used, do not elevate cytoplasmic cAMP levels to sufficiently high concentrations to activate cAMP-GEFII. By contrast, a PKA-resistant component of glucagon secretion and exocytosis was observed in rat α-cells (Fig. 1B and Table 3). Collectively, these observations suggest that intracellular cAMP levels might be higher in rat than in mouse α-cells.
The PKA-Independent Action of cAMP Is Mediated by cAMP-GEFII
In mouse pancreatic β-cells, the PKA-independent action of cAMP on exocytosis involves the cAMP-binding protein cAMP-GEFII (8, 11). Here we demonstrate that cAMP-GEFII is expressed in both mouse and rat α-cells (Fig. 6). The cAMP-GEFII agonist 8CPT-2Me-cAMP mimicked some of the effects of cAMP and forskolin on exocytosis (Fig. 7) and glucagon secretion (Table 3). Somewhat surprisingly, recent reports indicate that the KATP channel subunit SUR1 is somehow involved in PKA-independent stimulation of insulin secretion (8, 11, 23). We have proposed that the action of cAMP-GEFII on exocytosis in β-cells involves interaction with SUR1 and a rapid PKA-independent component of exocytosis was lost in SUR1−/− β-cells (8). SUR1 is also present in the pancreatic α-cells (26, 27), and we now demonstrate that this protein is also required for the PKA-independent cAMP-induced component of exocytosis in α-cells (Fig. 8). Apparently, the role of SUR1 extends beyond being a subunit of the KATP channels, and it might therefore be worthwhile to investigate the involvement of SUR1 in hormone/neurotransmitter release from other (nonpancreatic) endocrine cells expressing this protein.
In α-cells, the PKA-independent and cAMP-GEFII-dependent component of secretion accounts for a rapid component of exocytosis completed within a few hundred milliseconds of depolarization (Figs. 1B; 5, B and C, and 7). Although being of short duration, it is not quantitatively insignificant and glucagon release measurements from rat islets (Table 3) indicate that it accounts for approximately 50% of forskolin-stimulated glucagon release.
High Exocytotic Capacity of the Pancreatic α-Cell
Mouse α-cells exhibit large exocytotic responses already under basal conditions and the size of the readily releasable pool amounted to 200 fF even in the absence of cAMP. This is 20-fold larger than the corresponding value in mouse β-cells (8). The fact that exocytosis measured in the standard whole cell configuration is more than 3-fold higher than that observed during perforated patch recordings might be attributable to stronger intracellular Ca2+-buffering or the cytoplasmic ATP/ADP ratio being lower in intact cells than the pipette solution dialyzing the cell interior. In addition to the different magnitude of the exocytotic responses observed in α-cells than in β-cells under basal conditions, there was a dramatic difference in the stimulatory effect of cAMP on exocytosis. Thus, the stimulatory effect of cAMP on the estimated size of RRP was limited to 50% in α-cells, whereas it exceeded more than 1400% in β-cells. It is unlikely that the high rate of exocytosis in α-cells is attributable to a high-background activity of adenylate cyclase leading to the generation of sufficient cAMP to stimulate recruitment of granules into the RRP. This is suggested by the finding that the rate of exocytosis remained the same in the presence of Rp-cAMPS, an inhibitor of cAMP-dependent activation of PKA (Fig. 5 and Table 1). Clearly, tonic background activity of PKA itself or other kinases is also possible. In this context, protein kinase C (PKC) should perhaps be considered in the first place. It is well-established that PKC activators lead to strong stimulation of glucagon secretion (28, 29). PKC has also been shown to represent an important determinant of Ca2+-dependent exocytosis in chromaffin cells, which like α-cells exhibit large exocytotic responses already in the absence of a kinase activator (30, 31). In chromaffin cells, Ca2+ influx leads to phosphorylation of the exocytotic protein SNAP-25 (32). A similar regulation of exocytosis in α- and chromaffin cells is attractive to postulate given that epinephrine and glucagon both play prominent roles in the metabolic adjustment that occur during the physiological fight-or-flight response. We have demonstrated previously that sulfonylureas stimulate exocytosis in both α- and β-cells by a PKC-dependent mechanism (8, 33, 34), but the molecular processes involved remain to be determined. In this context it might therefore be of relevance that depolarization-evoked cAMP-independent exocytosis in SUR1−/− α-cells is reduced by 85% relative that observed in wild-type α-cells (Table 1, lines 4 and 10).
Can Increased Exocytotic Capacity Be Equated to Enhanced Glucagon Secretion?
We show here that glucagon stimulates exocytosis in isolated α-cells. This effect shows a strong resemblance to what we have previously shown for GLP-1, GIP, and epinephrine (2, 3). However, an enhanced exocytotic capacity documented by capacitance measurements cannot automatically be equated to stimulation of glucagon secretion. Indeed, substances that have the same effect on exocytosis determined by capacitance measurements might in fact have opposite effects in biochemical assays of glucagon secretion. Consider the effects of forskolin and GLP-1. Although both compounds stimulate exocytosis (monitored as increases in cell capacitance) to the same extent (Ref. 2 and Fig. 4E), GLP-1 in fact inhibits glucagon secretion (35), whereas forskolin stimulate secretion (Table 3 and Ref. 24).
To explain this paradox, it is important to emphasize that glucagon secretion represents a complex interplay between several processes operating in parallel. Pancreatic α-cells are electrically active and Ca2+-influx during action potential firing provides the stimulus that triggers exocytosis of the secretory granules (2, 19). Accordingly, an increased exocytotic capacity may not result in stimulation of glucagon secretion unless electrical activity is also maintained. In the case of GLP-1, this requirement is apparently not met, and the net response is therefore a suppression of glucagon secretion. This action is presumably mediated by a reduction in electrical activity. The latter may either result from a direct effect on the α-cell itself (such as closure of KATP channels and depolarization-induced inactivation of the ion channels involved in action potential firing; see Ref. 35) or be secondary to paracrine inhibition of the α-cell (for example, via GLP-1-induced stimulation of somatostatin release, which inhibits α-cell electrical activity; see Refs. 36 and 37). A depolarizing effect of GLP-1 on the α-cell membrane potential is suggested by analogy to the situation in mouse β-cells where the incretin results in PKA-dependent closure of KATP channels and membrane depolarization (16). Why then do not forskolin mimic the effect of GLP-1? A number of considerations indicate that the divergent effects of the two agents are attributable to the ability of forskolin, but not GLP-1, to elicit PKA-independent exocytosis in mouse α-cells. First, forskolin increases cellular cAMP 5-fold more than glucagon or GLP-1 (Table 2). Second, application of 0.1 mm intracellular cAMP gives rise to a prominent PKA-independent component of exocytosis (Fig. 5). Third, the PKA-independent pathway requires higher cAMP levels (8). The intracellular volume of an α-cell can be estimated to be approximately 0.7 pl based on a cell diameter of 11 μm and assuming spherical geometry. The cAMP content measured in the presence of forskolin (∼100 fmol/1000 cells) accordingly corresponds to an average intracellular cAMP concentration of approximately 150 μm. However, this probably represents an upper estimate of the concentrations attained in the electrophysiological experiments because the cAMP measurements, unlike the recordings of exocytosis, were performed in the presence of the phosphodiesterase inhibitor 3-isobutyl-1-methylxanthine (IBMX). For comparison, the PKA-independent component of exocytosis in mouse β-cells exhibits a Kd of 32 μm (8). Thus, forskolin is likely to elevate cAMP levels in α-cells sufficiently to maximally activate cAMP-GEFII. This does not appear to be the case for glucagon and GLP-1 because the stimulatory effect on exocytosis of either of these hormones is abolished by Rp-cAMPS (Fig. 3 and Ref. 3). In this context, it is also of interest that cAMP-GEFII via Rim2 has recently been shown to interact with the L-type Ca2+ channel subunit α11.2 (38). It is possible that the interaction of cAMP-GEFII/Rim2 with the Ca2+ channel promotes their association with the secretory granules. Such a concept would be in agreement with the finding that forskolin-induced exocytosis in rat α-cells principally depends on Ca2+-influx through L-type Ca2+-channels (2). Preliminary experiments indicate that this is also the case in mouse α-cells and that forskolin shifts the voltage dependence of exocytosis in these cells by approximately 10 mV toward more repolarized membrane potentials. This would allow significant exocytosis to proceed even after membrane depolarization and voltage-dependent inactivation of the membrane conductances normally involved in exocytosis. In conclusion, the net effect of agents increasing intracellular cAMP on glucagon secretion will depend on the intracellular concentration of the nucleotide attained. At low cAMP levels, the inhibitory (PKA-dependent action) mediated by reduction in electrical activity may prevail, whereas the stimulatory (PKA independent) mechanism, in part resulting from a shift in the voltage dependence of exocytosis, predominates at high cAMP levels. The fact that GLP-1 inhibits, whereas forskolin stimulates glucagon secretion from intact islets can be explained by the above model because GLP-1 has much weaker effects on the α-cell cAMP content (Table 2). Measured cAMP levels indicate that glucagon is more similar to GLP-1 than forskolin. Thus, we predict that glucagon will exert a GLP-1-like inhibitory action. Indeed, the report that a glucagon receptor knockout (GcgR−/−) mouse exhibits hyperglucagonemia and α-cell hyperplasia (39) provides some evidence that the physiological response to glucagon receptor activation in the α-cell is a reduction in glucagon secretion.
Autocrine and Paracrine Regulation of Islet Hormone Secretion
It has been recognized for a long time that the architecture of the pancreatic islets allows an extensive network of paracrine signaling. Insulin (or another secreted β-cell product such as GABA; see Refs. 40 and 41) has accordingly been postulated to be a negative regulator of glucagon and insulin secretion. Conversely, glucagon released from the α-cell is a strong stimulus of both glucose-induced insulin and somatostatin secretion (42, 43). Finally, somatostatin secreted by the δ-cells inhibits both insulin and glucagon secretion (24). In addition to the paracrine regulation of islet cell function, a growing body of evidence suggests the importance of autocrine mechanisms. Thus, insulin itself is being able to modulate β-cell electrical activity (18) and secretion (17). Here we demonstrate that acute application of glucagon paradoxically stimulates Ca2+-dependent exocytosis in α-cells. Although it is not, as discussed above in this Discussion, possible at this stage to determine unequivocally whether the net effect of glucagon receptor signaling in the α-cell results in stimulation or inhibition of glucagon secretion, autocrine inhibition of the α-cell can clearly contribute to the fact that α-cells exhibit oscillatory changes in the cytoplasmic Ca2+ concentration (44–49), which in turn may underlie pulsatile glucagon release in vivo (50).
MATERIALS AND METHODS
Cells
Cells were isolated from NMRI mice or Sprague Dawley rats (Bomholtgaard, Ry, Denmark). Mice lacking the SUR1 receptor (SUR1−/− mice; 6–12 months of age) used in this study were obtained from Dr. M. Magnusson (51) and bred at the Karolinska Institute in Stockholm. The mice were killed by cervical dislocation, the pancreas was quickly removed and isolation of the islets was performed by collagenase digestion. The procedures for sacrificing the animals were approved by the ethical committee in Lund and by local authorities in Hamburg and Copenhagen. Islets were dissociated into single cells in a Ca2+-free solution and the resultant islet suspension was plated on plastic petri dishes or glass coverslips (for immunocytochemistry) and maintained in tissue culture for 1–2 d before the experiments. The α-cells were distinguished from the β-cells by differences in electrophysiological properties as previously described (19, 52). For some experiments (Figs. 1B, 2, 4G, and 6B), rat islet fractions (α- or β-cells as indicated) were used. These were obtained by FACS as described elsewhere (2). The purity of the α-cell fraction was 97% (53). The tissue culture media consisted of RPMI 1640 supplemented with 10% fetal calf serum, 100 IU/ml penicillin, and 10 μg/ml streptomycin.
Immunocytochemistry
Rat and mouse islet cells were cultured for 15–24 h, fixed for 5 min in 3% paraformaldehyde in K-PIPES (Sigma, Stockholm, Sweden) and subsequently incubated for 10 min in 3% paraformaldehyde supplemented with 100 mm NaB4O7. Finally, they were permeabilized using 0.1% Triton X-100 for 30 min. After blocking unspecific binding by incubating for 15 min with 5% donkey serum, the cells were incubated for 2 h in presence of a rabbit antiglucagon (1:500, Eurodiagnostica, Arnhem, The Netherlands) and goat anti-cAMP GEFII (1:50 Santa Cruz Biotechnology, Inc., Santa Cruz, CA) Cy3- and Cy5-conjugated donkey antigoat and donkey antirabbit (Jackson ImmunoResearch, West Grove, PA) were used to label the detected sites. Excitation of Cy-3 and Cy-5 was performed using the 543 nm and 633 nm line of a Zeiss LSM Pascal confocal microscope (Carl Zeiss, Jena, Germany), respectively. Emitted light passed through a LP560 filter (Cy-3) or a LP650 filter (Cy-5) and was visualized using a ×63/1.3NA oil objective. The samples were scanned sequentially with the appropriate settings for each label to minimize cross talk. It was ascertained that unspecific binding of the secondary antibodies did not occur.
Electrophysiology
Patch-clamp electrodes were pulled from borosilicate capillaries, coated with Sylgard and fire-polished. The pipette-resistance was between 3–6 mΩ, when filled with pipette-solutions as specified below. Whole-cell currents were recorded using an EPC-9 amplifier and the software pulse (version 8.31; Heka Elektronik, Lamprecht/Pfalz, Germany). Exocytosis was detected as changes in membrane capacitance using a software-based lock-in application of the amplifier using 500-1000 Hz sine wave (40 mV peak to peak) to the holding potential. Exocytosis was elicited by application of voltage-clamp depolarizations of indicated durations from −70 mV to zero mV.
The standard extracellular solution consisted of (in mm) 118 NaCl, 20 tetraethylammonium-chloride (to block voltage-gated K+ currents), 5.6 KCl, 2.6 CaCl2, 1.2 MgCl2, 5 glucose and 5 HEPES (pH 7.4 using NaOH). Glucagon (Sigma), GLP-1 (Bachem, Peninsula Laboratories, Merseyside, UK), Rp-Br-cAMPS (Biologic, Bremen, Germany), the glucagon receptor antagonist des-His1-[Glu9]-glucagon-amide (Sigma; Ref. 54) or the GLP-1 receptor antagonist exendin-(9–39) (Bachem, Peninsula Laboratories) were added to the extracellular solution as indicated in the legends to the figures and tables.
In the standard whole cell patch-clamp experiments, the pipette solution contained (in mm) 125 Cs-glutamate, 10 NaCl, 10 CsCl, 1 MgCl2, 0.05 EGTA, 3 Mg-ATP, and 10 HEPES (pH 7.15 using CsOH). cAMP or the selective cAMP-GEFII agonist 8-(4-chloro-phenylthio)-2′-O-methyladenosine-3′-5′-cyclic monophosphate (8CPT-2Me-cAMP; Ref. 55) and/or Rp-cAMPS (Biologic, Bremen, Germany) was included in the pipette solutions as indicated in the figure legends. In a few experiments (Figs. 1, 2B, and 4, A–F), the perforated patch-configuration was used. In these experiments the pipette-solution consisted of (in mm) 76 Cs2SO4, 10 NaCl, 10 KCl, 1 MgCl2 and 5 HEPES (pH = 7.35 with CsOH). The solution was supplemented with amphotericin B (final concentration 0.24 mg/ml) to establish electrical contact.
Measurements of cAMP
Batches of purified rat α-cells (2000 cells/well) were preincubated at 37 C in Krebs-Ringer bicarbonate buffer containing (in mm) 115 NaCl, 4.7 KCl, 2.6 CaCl2, 1.2 KH2PO4, 1.2 MgSO4, 20 NaHCO3, 1 glucose, 0.5 IBMX, 16 HEPES, and 2 mg/ml BSA for 1 h and incubated for another 15 min in the same buffer supplemented or not with glucagon. The reaction was stopped by addition of 50 mm HCl and neutralized with NaOH. The cAMP concentration was determined by a cAMP [125I] scintillation proximity assay (Amersham Biosciences, Amersham, Buckinghamshire, UK).
PCR
Total RNA from rat islets and from FACS purified rat α- and β-cells was isolated using RNeasy Mini Kit (QIAGEN, Hilden, Germany). One microgram of total RNA was used for reverse transcription using random hexamer primers and Superscript II (Invitrogen Life Technologies, Karlsruhe, Germany). In a negative control, Superscipt II was omitted from the reaction. Purity of α- and β-cell preparations was checked by insulin and glucagon RT-PCR. No insulin transcripts were detected in the α-cell fraction (56). Glucagon receptor and cAMP-GEFII PCR were performed under the following conditions: 2 min 94 C followed by 36 cycles of 60 sec 94 C, 60 sec 58 C and 60 sec 72 C. Primers were rGlucR ex10_s: GCATCATTCATCTTCTTGTGG, rGlucR ex13_as: GCCAATGAGGTCTTCGCAG (expected fragment 447 bp) and cAMP-GEFII_s: GGAGGAGAAAAGGTGGTGCT, cAMP-GEFII_as: CTCTCAAACTCCGCATAGAAC (expected fragment 554 bp). Products were analyzed on a 1% agarose gel and by sequencing.
Glucagon Measurements
Glucagon release was measured in groups of 10 size-matched islets preincubated for 30 min in 200 μl extracellular solution and 1 mm D-glucose in 96-well Durapore membrane plates (Millipore, Molsheim, France). The preincubation medium was aspirated using a vacuum control pump (Millipore) and discarded. The islets were then resuspended in 200 μl of extracellular solution in the absence and presence of test compounds. At the end of the test incubation (1 h), the medium was aspirated and assayed for glucagon using commercial assays (Linco Research, St. Charles, MO).
Data Analysis
Depolarization-evoked exocytotic responses are expressed as the net change in whole cell capacitance (ΔCm). Data are presented as mean values ± sem of indicated experiments (n). Statistical significances were assessed using Student’s t test.
Acknowledgments
This work was supported by the Juvenile Diabetes Research Foundation, the Swedish Strategic Foundation, the Swedish Diabetes Association, the Swedish Research Council (Grants 8647 and 13147), the Göran Gustafsson Foundation of Natural Sciences and Medicine, the Novo Nordisk Foundation, the Albert Påhlssons stiftelse, the Crafoordska stiftelsen, and the Royal Physiografic Society in Lund.
We thank Kristina Borglid and Britt-Marie Nilsson for skilled technical assistance and Dr. Mark Magnusson for generating the SUR−/− mice.
Abbreviations:
- 8CPT-2ME-cAMP,
(8-4-Chloro-phenylthio)-2′-O-methyl-cAMP;
- FACS,
fluorescence-activated cell sorting;
- GEFII,
guanidine nucleotide exchange factor II;
- GIP,
glucose-dependent insulinotropic polypeptide;
- GLP,
glucagon-like peptide 1;
- IBMX,
3-isobutyl-1-methylxanthine;
- KATP-channel,
ATP-sensitive potassium channel;
- RRP,
readily releasable pool;
- Rp-cAMPS,
adenosine-3′,5′-cyclic monophosphorothioate, RP-isomer;
- SNAP-25,
synaptosomal protein of 25 kDa;
- SUR1,
sulfonylurea receptor protein 1;
- PKA,
protein kinase A;
- PKC,
protein kinase C.
References
Jiang G, Zhang BB 2003 Glucagon and regulation of glucose metabolism. Am J Physiol Endocrinol Metab 284:E671–E678
