


Abstract
Somatostatin (SRIF) regulates pancreatic insulin and glucagon secretion. In the present study we describe the generation of SRIF receptor subtype 5 knockout (sst5 KO) mice to examine the role of SRIF receptor subtypes (sst) in regulating insulin secretion and glucose homeostasis. Mice deficient in sst5 were viable, fertile, appeared healthy, and displayed no obvious phenotypic abnormalities. Pancreatic islets isolated from sst5 KO mice displayed increased total insulin content as compared with islets obtained from wild-type (WT) mice. Somatostatin-28 (SRIF-28) and the sst5/sst1-selective agonist compound 5/1 potently inhibited glucose-stimulated insulin secretion from WT islets. SRIF-28 inhibited insulin secretion from sst5 KO islets with 16-fold less potency while the maximal effect of compound 5/1 was markedly diminished when compared with its effects in WT islets. sst5 KO mice exhibited decreased blood glucose and plasma insulin levels and increased leptin and glucagon concentrations compared with WT mice. Furthermore, sst5 KO mice displayed decreased susceptibility to high fat diet-induced insulin resistance. The results of these studies suggest sst5 mediates SRIF inhibition of pancreatic insulin secretion and contributes to the regulation of glucose homeostasis and insulin sensitivity. Our findings suggest a potential beneficial role of sst5 antagonists for alleviating metabolic abnormalities associated with obesity and insulin resistance.
SOMATOSTATIN (SRIF) is a peptide hormone initially isolated from hypothalamic tissue as a suppressor of GH secretion (1). SRIF and its receptors play an important role in the detection and therapy of neuroendocrine disorders including GH-secreting pituitary adenomas, and gastro-entero-pancreatic tumors such as carcinoids, vasoactive intestinal peptidomas, gastrinomas, insulinomas, and glucagonomas (2–5). In rodents, SRIF receptors inhibit secretion of GH, TSH, prolactin, and ACTH, regulate gastrointestinal motility, gastric acid flow, and exocrine pancreas secretion and play a role in neurotransmission (6–13).
The effects of SRIF are mediated via five somatostatin receptor subtypes (sst1–sst5), which belong to the superfamily of G protein-coupled receptors. Murine somatostatin receptors are encoded by five genes located on separate chromosomes (14). Genes encoding SRIF receptor subtypes 1, 3, 4, and 5 are intronless, whereas sst2 exists in two alternatively spliced isoforms (sst2a and sst2b), which diverge in their C-terminal sequences (15, 16). SRIF receptors are heterogeneously distributed in various tissues including brain, gastrointestinal tract, pancreas, and pituitary gland (17–19).
There are two major physiological SRIF ligands, SRIF-14 and SRIF-28, which consist of 14 and 28 amino acids, respectively (1, 20, 21). Radioligand binding studies on cells expressing individual SRIF receptor subtypes have demonstrated that SRIF-14 and SRIF-28 interact with sst1–sst4 with similar affinity while sst5 displays up to a 10-fold higher affinity for SRIF-28 (22–24). Both forms of somatostatin exert biological effects in a tissue-specific manner. In the pancreas SRIF-14 is a more potent inhibitor of glucagon secretion from the pancreatic α-cells, whereas SRIF-28 preferentially inhibits insulin secretion from the β-cells (25). Because SRIF-14 and SRIF-28 inhibit insulin and glucagon release with different potencies from pancreatic α- and β-cells, it has been postulated that each cell type expresses different SRIF receptor subtypes (26).
Immunohistochemical studies on rodent endocrine pancreas demonstrated expression of sst2 on α- and sst5 on β-cells (27, 28), supporting the hypothesis that different SRIF receptor subtypes could mediate the effects of somatostatin on insulin and glucagon secretion. Quantitative RT-PCR has identified all five SRIF receptor subtypes in isolated rat islets (29). Based on immunohistochemical analysis, all five subtypes are present in human pancreatic islets (30, 31). At the cellular level sst2 colocalizes strongly with glucagon while sst5 and sst1 quantitatively predominate in insulin cells as detected by peptide-derived antibodies in human endocrine pancreas (30).
Endogenous SRIF ligands bind to all known SRIF receptor subtypes and most tissues express multiple receptor subtypes; it is difficult to assign a specific biological function to an individual sst. Synthetic SRIF ligands with improved selectivity for SRIF receptor subtypes were developed (32, 33) and used in the functional characterization of SRIF receptors. In vitro experiments using isolated pancreatic islets have suggested a role for sst5 in regulating insulin secretion (34). The limited selectivity of peptidyl SRIF agonists, as well as the lack of sst-selective antagonists, made it difficult to clearly define the physiological role of the individual receptor subtypes. The recent generation of nonpeptidyl, subtype-selective SRIF agonists (35) provided a milestone for the pharmacological and functional exploration of SRIF receptor subtypes. These agents, when used in conjunction with the recently developed transgenic mice lacking individual SRIF receptors (36, 37), permit assignation of specific functions to particular receptor subtypes. Recently, we have used the combination of sst2 receptor knock out mice and receptor subtype-selective SRIF agonists to demonstrate that sst2 is a critical regulator of glucagon secretion (38). In the current study, we examine the role of SRIF receptors in regulating insulin secretion and glucose homeostasis by using sst5 knockout mice and subtype-selective SRIF agonists.
RESULTS
Generation of sst5 KO Mice
The generation of sst5 KO mice involved cloning of a 12-kb fragment of mouse genomic DNA containing the entire coding region of the sst5 gene. This genomic clone was then used for construction of a targeting vector. Generation of the targeting vector involved replacement of the single coding exon for sst5 with a neomycin resistance gene and a lacZ gene in the same orientation as the sst5 exon (Fig. 1, a–c). Insertion of the neomycin resistance gene permitted selection of embryonic stem cell clones which contained the targeting vector. Introduction of a novel EcoRI restriction site within the lacZ gene enabled the identification of targeted embryonic stem cell clones (Fig. 1c). Introduction of the bacterial enzyme β-galactosidase encoding lacZ gene allowed analysis of the sst5 gene expression pattern.
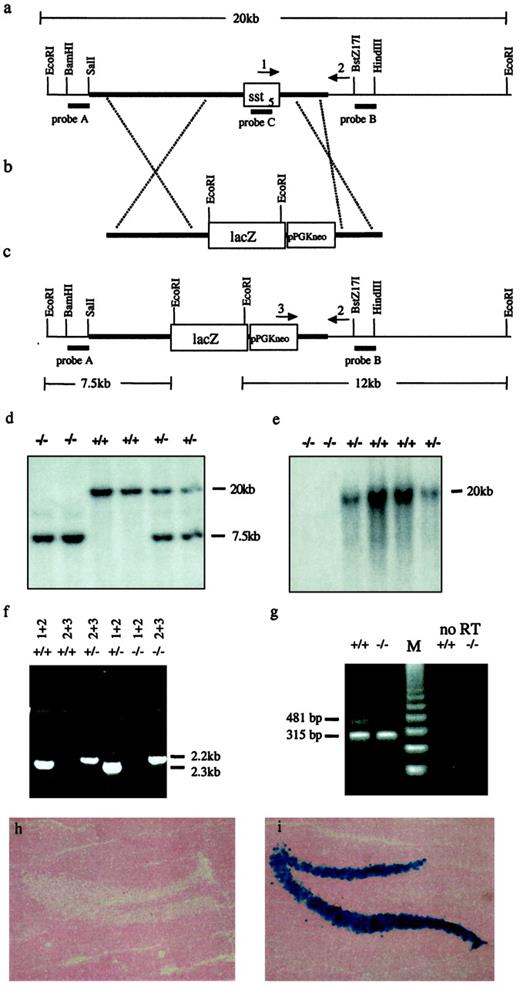
Targeted Disruption of the Murine sst5 Gene and Identification of sst5 KO Mice a, Structure of the WT mouse sst5 gene. b, Targeting vector. c, Predicted targeted gene structure. The targeting vector contains a neomycin resistance (PGKneo) gene and a lacZ gene that replace the murine sst5 exon. Probes A, B, and C show location of the primers used for Southern blot analysis. Arrows 1, 2, and 3 show location of the primers used for PCR analysis. Thick horizontal lines represent genomic sequences in targeting clone. Thin horizontal lines indicate genomic sequence outside of the targeting clone. White squares indicate coding regions. d, Southern blot analysis of EcoRI-digested genomic DNA isolated from mouse tails and hybridized with probe A. Two homozygous animals are shown that contain only the 7.5-kb fragment in the disrupted sst5 allele. Genotype is indicated above the lanes. e, Southern blot analysis of EcoRI-digested genomic DNA isolated from mouse tails and hybridized with probe C. No signal is detected in sst5 KO mice. Genotype is indicated above the lanes. f, PCR analysis of DNA isolated from WT and sst5 KO mice using primers 1 and 2 to identify the WT sst5 allele (2.2 kb) and primers 2 and 3 to identify the neomycin resistance gene (2.3 kb). Genotype and primer pairs are indicated above the lanes. g, RT-PCR analysis of RNA isolated from pancreas of WT and sst5 KO mice. Sense and antisense primers were used to identify the sst5 mRNA (see Materials and Methods). The sst5-specific product is 481 bp, and the 18S-specific product is 315 bp. Genotype is indicated above the lanes. M, DNA standard; +/+, WT sst5; +/−, heterozygous sst5; −/−, homozygous sst5 KO. h, Brain section from an adult 12-wk-old WT mouse. i, Brain section from an adult male 12-wk-old sst5 KO mouse. Staining in the granular layer of the dentate gyrus is visible in the sst5 KO mouse.
Approximately 600 G418-resistant embryonic stem cell clones were analyzed by Southern blots, using probes flanking both sides of the homologous sequences. Five independent clones that contained the recombined sst5 KO construct were identified (data not shown). Embryonic stem cells obtained from two independently generated clones were injected into blastocysts that were implanted into C57BL/6J foster mice. Chimeric mice from both embryonic stem cell clones underwent successful germline transmission. Approximately 50% of agouti pups carried the sst5 KO allele.
Heterozygous sst5 KO mice were indistinguishable from their wild-type (WT) littermates. Homozygous F2 sst5 KO mice were generated by cross-mating between heterozygous F1 sst5 KO mice. Southern blot and PCR analysis of the F2 generation distinguished WT and sst5 KO mice (Fig. 1, d–f). RT-PCR analysis of RNA isolated from mouse pancreas, endocrine islets, brain, and adipose tissue identified a 481-bp sst5 DNA fragment in WT samples, which was absent in RNA samples obtained from sst5 KO samples (Fig. 1g; data not shown). Sequencing of the RT-PCR product confirmed the identity of the 481-bp fragment as mouse sst5. The expression of β-galactosidase was detected by staining of brain sections isolated from mice carrying a targeted sst5 allele; no signal was observed in brains from WT mice (Fig. 1, h and i).
sst5 KO Mice Are Viable and Display Normal Gross Morphology
Cross-matings between heterozygous sst5 KO mice resulted in the generation of homozygous sst5 KO mice. The resulting sst5 KO mice showed a normal 1:2:1 Mendelian inheritance ratio of the targeted allele, indicating that deletion of sst5 does not produce a deleterious effect on embryogenesis (data not shown). The homozygous mutant mice are phenotypically indistinguishable from their WT counterparts throughout their life. sst5 KO mice are viable, fertile, appear healthy, give birth to a comparable number of progeny, have a life span of at least 14 months, and consume similar amounts of food and water as their WT counterparts (data not shown). Adult male sst5 KO mice have total adipose tissue content, wet weight of liver, heart, kidney, spleen, and perigonadal white adipose tissue comparable to that measured in wild type control mice (data not shown) and there is no difference in their growth rate (Fig. 2). Careful histological analysis of pancreatic sections from 12-wk-old male mice revealed no difference in the number, size, or distribution of islets within the pancreas of KO vs. WT mice (data not shown).
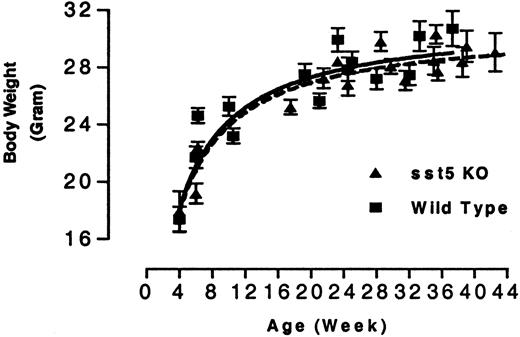
Growth Curve of WT and sst5 KO Mice Male WT and sst5 KO mice (5–10 per cage) were fed chow diet ad libitum. Each data point represents average body weight in grams (±sem) of 10–20 animals at each time point.
Deletion of sst5 Alters Insulin Secretion
The effects of the sst5 deletion on insulin and glucagon secretion from islets isolated from WT and sst5 KO mice were investigated. Pancreatic islets isolated from sst5 KO and from WT mice showed comparable morphology as judged by stereomicroscopic examination (data not shown). The insulin content of pancreatic islets isolated from sst5 KO mice was increased as compared with that detected in WT islets (Fig. 3A). Incubation of isolated islets with 20 mmd-glucose for 2 h resulted in a 9- to 10-fold stimulation of insulin secretion from both sst5 KO and WT islets (Fig. 3B). Basal and glucose-stimulated insulin secretion rates from sst5 KO islets were significantly increased as compared with WT islets; however, both types of islets responded to glucose with a similar fold increase in insulin secretion. Pancreatic islets isolated from WT and from sst5 KO mice showed comparable basal glucagon secretion rates and glucagon content (data not shown). Thus, deletion of sst5 results in changes in insulin secretion rates and in insulin content without affecting parameters of α-cell function.
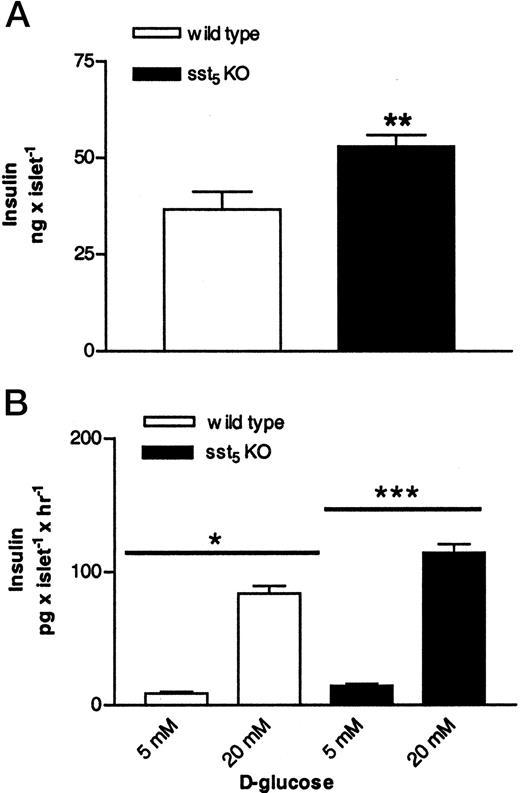
Effects of sst5 Deletion on Insulin Content and Insulin Secretion from Pancreatic Islets A, Insulin content of islets isolated from 2- to 3-month-old male WT and sst5 KO mice. Insulin content is expressed as nanograms per islet. Data are expressed as mean of 16–24 experiments (±sem); **, P < 0.01. B, Basal (5 mm) and 20 mm d-glucose-stimulated insulin secretion from pancreatic islets isolated from WT and from sst5 KO mice. Supernatant from cultured islets was assayed for insulin content by a rat RIA. Insulin content is expressed as picograms per islet per hour. Data are expressed as mean of 10–14 experiments (±sem); *, P < 0.05; **, P < 0.001; ***, P < 0.001.
Deletion of sst5 Results in Alteration of SRIF-28 and Compound 5/1-Induced Inhibition of Insulin Secretion
The recently described nonpeptidyl SRIF receptor-selective agonists (35) were used to assess the role of sst5 in regulating murine insulin secretion in vitro. The SRIF agonists were originally characterized using the five cloned human SRIF receptor subtypes, and the pharmacological properties of these ligands with respect to murine SRIF receptors have not been reported. The SRIF agonist compound 5/1 inhibits cAMP accumulation in Chinese hamster ovary (CHO)-K1 cells transfected with human sst5 with an IC50 value of 1.3 nm (35). In CHO-K1 cells transfected with mouse sst5, SRIF-28 inhibited forskolin-stimulated cAMP accumulation with an IC50 value of 0.36 nm, and compound 5/1 inhibited forskolin-stimulated cAMP accumulation with an IC50 value of 0.93 nm (Fig. 4). Compound 1 and compound 2 were inactive in this assay up to a concentration of 100 nm (Fig. 4). Thus, msst5 specifically mediates effects of compound 5/1 in a similar fashion to its human counterpart.
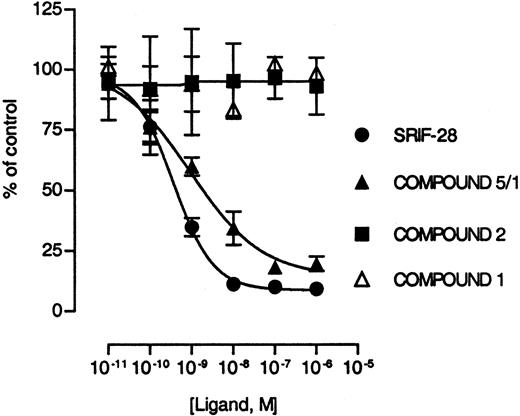
Effects of SRIF-28, Compound 1, Compound 2, and Compound 5/1 on Forskolin-Stimulated Intracellular cAMP Accumulation CHO-K1 cells stably transfected with mouse sst5 were tested for the effects of different compounds on forskolin-stimulated adenylate cyclase activity. Data are expressed in percent of control (±sem), defined as intracellular cAMP levels in the presence of 10 μm forskolin and represent three independent experiments.
SRIF-28 and SRIF receptor subtype-selective SRIF agonists did not influence basal insulin secretion from pancreatic islets isolated from adult male WT and sst5 KO mice (data not shown); therefore, the effects of SRIF and SRIF agonists on glucose-stimulated insulin secretion were investigated. Incubation of pancreatic islets isolated from WT mice with SRIF-28 led to a concentration-dependent inhibition of glucose-stimulated insulin secretion (IC50: 0.55 nm, Fig. 5A). SRIF-28 was approximately 16-fold less potent in inhibiting glucose-stimulated insulin from pancreatic islets isolated from sst5 KO mice (IC50: 8.1 nm, Fig. 5A). Compound 5/1 potently inhibited insulin secretion from WT islets with an IC50 value of 0.18 nm (Fig. 5B). However, compound 5/1 inhibited insulin secretion from sst5 KO islets only at the highest tested concentration of 100 nm (Fig. 5B). These data support the hypothesis that sst5 is involved in regulating insulin secretion from murine pancreatic islets.
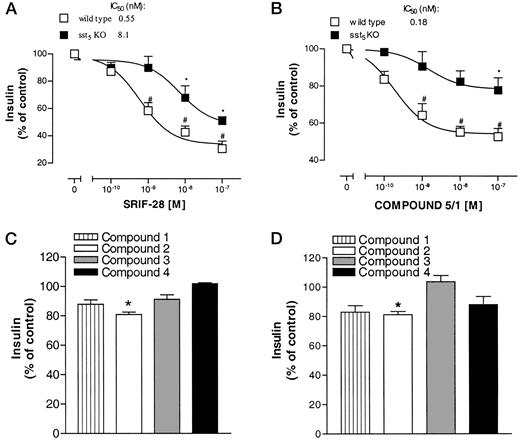
Effects of SRIF-28 and SRIF-Receptor-Selective Compounds on 20 mm d-Glucose-Stimulated Insulin Secretion from WT and sst5 KO Islets Isolated pancreatic islets from WT and sst5 KO animals were tested for the effects of different compounds on 20 mmd-glucose-stimulated insulin secretion. A, Dose response of SRIF-28. B, Dose response of compound 5/1. C, Effect of compounds 1, 2, 3, and 4 at 100 nm on glucose-stimulated insulin secretion from WT animals. D, Effect of compounds 1, 2, 3, and 4 at 100 nm on glucose-stimulated insulin secretion from sst5 KO animals. All data points represent average (±sem) of three independent experiments and are expressed as percent of control, defined as the amount of secreted insulin in the presence of 20 mmd-glucose. *, P < 0.05 vs. control; #, P < 0.05 vs. sst5 KO.
Inhibition of insulin secretion by SRIF-28 from sst5 KO islets suggests that other SRIF receptor subtypes regulate murine β-cell secretion. To prove this hypothesis the effects of SRIF agonists with selectivity for sst1–sst4 on glucose-stimulated insulin secretion were studied (Fig. 5, C and D). Compound 2 inhibited insulin secretion from both WT and from sst5 KO islets at the maximal tested concentration of 100 nm (WT: 82% ± 3, P < 0.05 vs. untreated WT controls, sst5 KO: 78% ± 4, P < 0.05 vs. untreated sst5 KO controls). The sst1-, sst3-, and sst4-selective agonists, compounds 1, 3, and 4, did not significantly affect insulin secretion from WT or from sst5 KO islets (Fig. 5, C and D). These data demonstrate that sst5 is the predominant receptor involved in the regulation of insulin-secretory activity of β-cells in the mouse pancreas by SRIF.
Sst5 KO Mice Display Improved Insulin Sensitivity
The consequences of sst5 deletion on glucose homeostasis were investigated (Table 1). sst5 KO mice fed a chow diet displayed lower postprandial and fasting blood glucose levels as compared with WT mice. sst5 KO mice also displayed lower fasting and postprandial insulin levels than WT mice, indicating improved insulin sensitivity. sst5 null mice showed significantly increased fasting and postprandial glucagon levels as compared with their WT counterparts. In addition, sst5 KO mice had a 2.6-fold increase in fasting plasma leptin levels when compared with WT mice; however, no differences in the postprandial leptin levels were observed.
Baseline Metabolic Parameters of WT (+/+) and sst5 KO (−/−) Mice
| +/+ | −/− | |
|---|---|---|
| Blood glucose (mg/dl) | ||
| Fasted | 102 ± 10 (19) | 91 ± 15 (19)a |
| Fed | 145 ± 18 (21) | 103 ± 10 (27) |
| Insulin (ng/ml) | ||
| Fasted | 1.8 ± 1.2 (19) | 1.1 ± 0.6 (32)b |
| Fed | 2.4 ± 1.5 (19) | 1.3 ± 0.8 (32)b |
| Glucagon (pg/ml) | ||
| Fasted | 41 ± 12 (18) | 62 ± 15 (19) |
| Fed | 75 ± 39 (21) | 130 ± 64 (33)b |
| Leptin (ng/ml) | ||
| Fasted | 1.7 ± 1.0 (19) | 4.4 ± 2.6 (37) |
| Fed | 4.4 ± 2.1 (19) | 5.2 ± 2.4 (37) |
| Cholesterol (mg/dl) | ||
| Fasted | 147 ± 28 (44) | 140 ± 33 (41) |
| Fed | ND | ND |
| Triglycerides (mg/dl) | ||
| Fasted | 133 ± 25 (19) | 153 ± 47 (25) |
| Fed | 190 ± 42 (34) | 205 ± 51 (66) |
| Free fatty acids (mmol/liter) | ||
| Fasted | 0.9 ± 0.4 (19) | 1.2 ± 0.3 (19) |
| Fed | 1.7 ± 0.3 (24) | 2.0 ± 0.5 (43) |
Animals were age-matched males 3–6 months old fed ad libitum or fasted for 12–16 h. Values represent mean ± sd. Numbers in parentheses indicate number of animals tested. ND, not done.
P < 0.05;
P < 0.01.
Insulin is involved in the regulation of lipid metabolism; several parameters of lipid metabolism (triglycerides, free fatty acids, and cholesterol) were measured. sst5 KO mice displayed comparable levels of fasting and postprandial triglycerides, free fatty acids, and cholesterol to those observed in WT animals (Table 1). Thus, the sst5 null mice experience changes in insulin, glucagon, leptin, and glucose levels.
Deletion of sst5 Attenuates High Fat Diet-Induced Insulin Resistance
The effect of sst5 deletion on insulin sensitivity was further studied by challenging animals with a diet containing high fat (36% wt/wt, 58.4 kcal %). High-fat diet administration resulted in body weight gain in both sst5 KO and WT mice (Fig. 6). A transient delay in body weight gain was observed in sst5 KO mice as compared with WT animals.
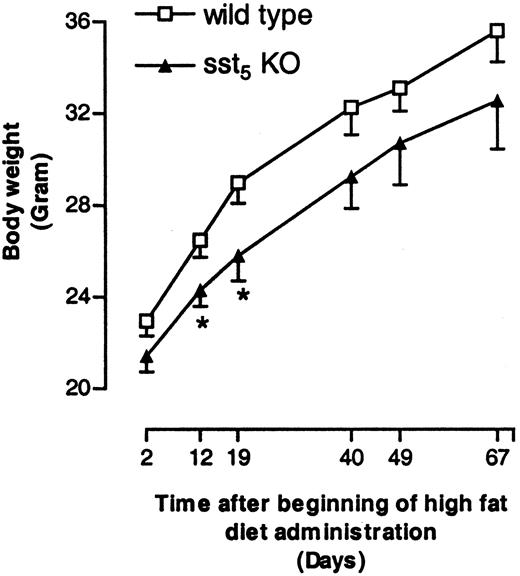
Body Weight Changes in WT and sst5 KO Mice Fed a High-Fat Diet Male WT and sst5 KO mice (six to seven per cage) were fed high-fat diet (36% wt/wt, 58.4% kcal %) ad libitum for a period of 10 wk, and body weight changes were monitored. Each data point represents average body weight in grams (±sem) of 17–27 animals at each time point. *, P < 0.05.
Glucose and insulin plasma levels were examined over the course of high-fat diet administration. At the beginning of high-fat diet feeding (d 0) sst5 KO mice displayed lower postprandial blood glucose and plasma insulin levels than WT mice (Fig. 7, A and B). Over a period of 10 wk, a gradual increase in blood glucose and plasma insulin levels in both groups was observed, indicating the development of insulin resistance. The difference in postprandial blood glucose observed at the beginning of high-fat diet administration persisted throughout the course of the study. Although postprandial insulin levels increased in both groups toward the end of the study, the increase in sst5 KO mice was delayed (Fig. 7B). Although insulin levels increased by approximately 320% in the WT group after 6 wk, the increase in sst5 KO mice was only 48%.
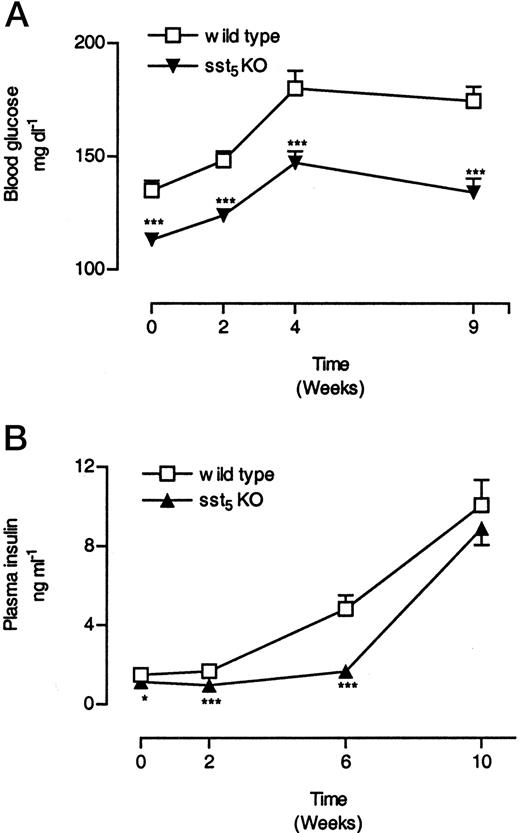
Changes in Postprandial Blood Glucose (A) and Plasma Insulin (B) Levels in sst5 KO and WT Mice Fed a High-Fat Diet Two- to 3-month-old male WT and sst5 KO mice were fed a high-fat diet (36% wt/wt, 58.4% kcal%) ad libitum for a period of 10 wk. Blood was collected over a period of 10 wk between 0900 and 1100 h from the retroorbital plexus of conscious animals. Both glucose and insulin were measured. A, Glucose levels are expressed as milligrams per decaliter; B, insulin levels are expressed as nanograms per milliliter. Each data point represents mean of 17–27 (±sem) animals. *, P < 0.05; **, P < 0.01; ***, P < 0.001.
The difference in insulin levels between WT and sst5 KO mice in response to high-fat diet feeding suggested that differences in insulin secretion and/or insulin sensitivity may exist. Glucose and insulin tolerance tests in both animal groups after 6 wk of high-fat diet feeding were performed to study changes in insulin sensitivity. After ip glucose administration, blood glucose levels increased comparably in both animal groups and reached maximal levels after 30 min (Fig. 8A). However, after 30 min blood glucose levels in sst5 KO mice decreased more rapidly and returned to basal levels by 120 min, whereas blood glucose levels in the WT group were still elevated. Intraperitoneal administration of insulin (0.3 U kg−1 body weight) led to a more rapid decrease in blood glucose concentrations in sst5 KO mice as compared with WT controls (Fig. 8B), consistent with the increased insulin sensitivity observed in the sst5 KO mice.
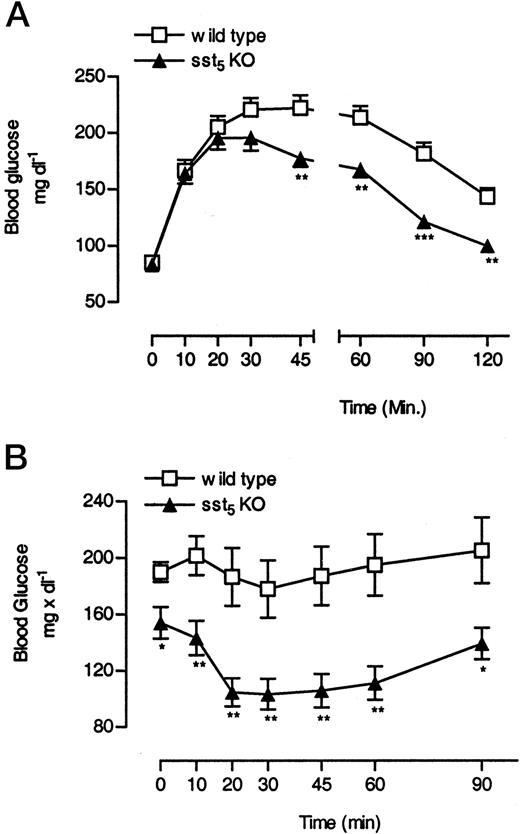
Changes in Insulin Sensitivity in WT and sst5 KO Mice Fed a High-Fat Diet A, IPGTT (2 g × kg−1 body weight) in overnight-fasted WT and sst5 KO mice. B, Intraperitoneal insulin tolerance test (0.3 U × kg−1 body weight) in 2-h-fasted WT and sst5 KO mice. Male WT and sst5 KO mice were fed a high-fat diet (36% wt/wt, 58.4% kcal %) ad libitum. IPGTT or ip insulin tolerance test were performed after 7 and 8 wk of high-fat diet administration, respectively (0800–1200 h). All data points represent the mean of six to eight animals (±sem) and are expressed as milligrams per decaliter. *, P < 0.05; **, P < 0.01; ***, P < 0.001.
Plasma leptin levels in overnight fasted sst5 KO mice were significantly increased in the beginning (d 0) and after 14 d of high-fat diet feeding; however, no difference was observed at the end of the study (Fig. 9). Leptin has been shown to decrease food intake and body weight (39, 40). As expected from the elevated plasma leptin concentration, sst5 KO mice showed slightly decreased body weight, but there was no detectable difference in food intake as compared with WT mice (data not shown). A small difference in total adipose tissue content was noticed while other parameters of lipid metabolism remained normal (Table 2). The increase in plasma leptin levels observed in sst5 KO animals suggests that sst5 inhibits leptin secretion.
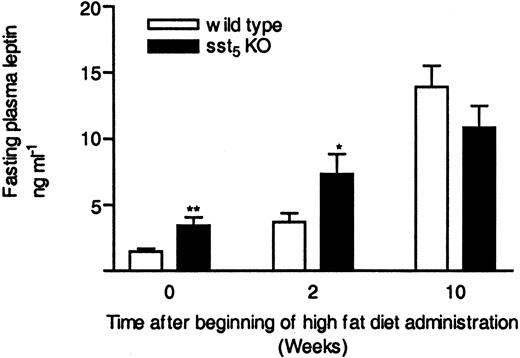
Plasma Leptin Levels in WT and sst5 KO Mice Fed a High-Fat Diet Male WT and sst5 KO mice were fed a high-fat diet (36% wt/wt, 58.4% kcal %) ad libitum and fasted overnight, and blood was collected from retroorbital plexus into heparinized tubes. Leptin levels are expressed as nanograms per milliliter in plasma. Each data point represents a mean of 17–27 animals (±sem); *, P < 0.05; **, P < 0.01.
Metabolic Parameters in Fasted WT (+/+) and sst5 KO (−/−) Mice on a High-Fat Diet
| +/+ | −/− | |
|---|---|---|
| Adipose tissue content (% total body mass) | 39 ± 6 (18) | 33 ± 11 (22) |
| Free fatty acids (mmol/liter) | 2.1 ± 0.36 (27) | 2.3 ± 0.7 (22) |
| Triglycerides (mg/dl) | 155 ± 52 (27) | 134 ± 33 (22) |
| Insulin (ng/ml) | 2.76 ± 2.68 (27) | 1.81 ± 2.9 (22) |
| Cholesterol (mg/dl) | 186 ± 19 (21) | 193 ± 42 (18) |
Animals were 14–15 wk of age and had been maintained on a high fat diet for 9 wk. Values represent mean ± sd. Numbers in parentheses indicate number of animals tested.
DISCUSSION
Somatostatin is a potent inhibitor of insulin and glucagon secretion, which are two major hormones that regulate glucose homeostasis. Recently, the role of sst2 in regulating glucagon secretion has been demonstrated by utilizing sst-selective SRIF agonists combined with sst2 KO mice (38). Although several studies implicated sst5 in regulating insulin secretion (34, 41), no conclusive evidence has been provided. The current study demonstrates that sst5 plays an important role in regulating insulin secretion from isolated pancreatic islets using sst-selective SRIF agonists in conjunction with sst5 KO mice. This study also reveals that sst5 influences insulin sensitivity in an unexpected manner that is independent of its effects in the pancreas.
Several lines of evidence support the role of sst5 as a primary receptor subtype in regulating insulin secretion from murine pancreatic islets. Islets isolated from sst5 KO mice showed increased basal and glucose-stimulated insulin secretion rates as compared with islets isolated from WT animals. Pancreatic islets isolated from sst5 KO mice showed increased insulin content, suggesting that increased insulin secretion may result from increased insulin synthesis. SRIF-28 potently inhibited insulin secretion from WT islets whereas deletion of sst5 resulted in a 16-fold lower potency of SRIF-28 in inhibition of insulin secretion. Compound 5/1, an sst5/sst1-selective SRIF agonist, potently inhibited insulin secretion from WT islets but showed little effect on insulin secretion from sst5 KO islets. These data are consistent with the SRIF receptor subtype distribution in the rat endocrine islets that have demonstrated a colocalization of sst5 with insulin-secreting β-cells (27). In addition, the results of the current study support the hypothesis derived from previous studies demonstrating more potent inhibition of insulin secretion by peptidyl SRIF agonists with relative selectivity for sst5 (41, 42).
Deletion of sst5 did not completely abolish SRIF-28 inhibition of insulin secretion, suggesting that other SRIF receptor subtypes might be involved in regulating murine β-cell function. Rodent pancreata express all five SRIF receptor subtypes as detected by quantitative PCR methods, with sst2 mRNA being the most abundant subtype, followed by sst1 and sst4 (29). By antibody analysis, sst2 and sst5 are expressed on glucagon and insulin cells in rodent pancreas (27, 28). The protein expression of the remaining three subtypes (sst1, sst3, and sst4) in rodents is unknown. In humans, pancreatic insulin cells express high levels of sst1 followed by sst5 as detected by quantitative immunohistochemistry, whereas sst3 and sst4 show the lowest level of expression among all five subtypes (30).
High levels of sst1 expression in humans suggest that sst1 might have a role in regulating insulin secretion. Compound 5/1 shows only approximately 10-fold selectivity toward sst5 as compared with sst1; therefore, inhibition of insulin secretion from sst5 KO islets in the current study might result from interaction of compound 5/1 with sst1. However, the sst1-selective SRIF agonist did not significantly influence insulin secretion from isolated mouse pancreatic islets. Furthermore, neither function nor expression of sst1 in rodent pancreatic islets has been described. Rodent studies using currently available sst1 antibodies (30), pharmacological experiments on islets derived from recently published sst1 KO mice (36), and ongoing studies on sst2/sst5 double KO will provide more information on the possible role of sst1 in insulin regulation.
Studies on rodent pancreatic islets using peptide-derived antibodies showed that β-cells express sst2 (28). In addition, perfusion of human pancreas with an sst2-selective agonist and static incubation of isolated human pancreatic islets with an sst2-selective nonpetidergic compound demonstrated the role of sst2 in inhibiting insulin secretion in humans (43).
Sst3- and sst4-selective SRIF agonists did not effect insulin secretion. These data corroborate the previously described lack of significant effects of compounds with selectivity for sst3 and sst4 in rodents and in humans (29, 38, 41–43). These data also correlate with the low levels of expression of RNA and protein for both SRIF receptor subtypes. Our study suggests that sst3 and sst4 do not play an important role in regulating murine insulin secretion.
Our phenotypic analysis of the sst5 KO mice reveals an unexpected role for sst5 in modulating insulin sensitivity. In vitro data demonstrate that sst5 inhibits insulin secretion, and islets isolated from sst5 KO mice display higher insulin content. In vivo sst5 KO mice showed decreased plasma insulin levels. The in vitro data are obtained on tissue, which is not under the influence of physiological factors such as nutrients or hormones. Although sst5 may negatively regulate insulin secretion in the pancreas directly, it may also affect insulin levels indirectly by acting on other tissues or cell types, and it is the combination of these effects that is reflected in the blood levels of insulin. Analysis of individual islets allows us to investigate on a cell-by-cell basis the role of sst5 in the pancreas, and it is this type of analysis that will be required to investigate the role of sst5 in other tissues in which it might also influence insulin regulation.
Sst5 null mice displayed lower glucose levels as compared with WT animals. The changes in both insulin and glucose were independent of their diet since a similar constellation of both hormone levels was observed in sst5 KO mice fed either a regular chow diet or a diet containing increased fat content. WT mice responded to high fat diet feeding with a marked increase in insulin levels paralleled by an increase in blood glucose levels; these are the hallmarks of insulin resistance. The high-fat diet-induced insulin resistance manifested in WT mice was partially alleviated in sst5 KO mice as measured by glucose and insulin tolerance tests. The increased insulin sensitivity was more surprising as sst5 KO mice showed increased ACTH and corticosterone levels (Table 3). Both hormones have been associated with aggravating the development of insulin resistance and increasing the central deposition of adipose tissue (44, 45). Despite increased ACTH and corticosterone levels, sst5 KO mice fed a high-fat diet displayed a slightly delayed body weight gain and showed a trend toward decreased total adipose tissue content as compared with WT mice.
Basal Hormone Levels of IGF-1, ACTH, and Corticosterone in Fasted WT (+/+) and sst5 KO (−/−) Mice
| +/+ | −/− | |
|---|---|---|
| IGF-1 | 245 ± 67 (19) | 310 ± 114 (16) |
| ACTH | 1.2 ± 0.6 (29) | 1.7 ± 0.8 (28)a |
| Corticosterone | 127 ± 74 (33) | 187 ± 143 (47)a |
| +/+ | −/− | |
|---|---|---|
| IGF-1 | 245 ± 67 (19) | 310 ± 114 (16) |
| ACTH | 1.2 ± 0.6 (29) | 1.7 ± 0.8 (28)a |
| Corticosterone | 127 ± 74 (33) | 187 ± 143 (47)a |
Animals were 3- to 6-month-old males fasted for 12–16 h. Values are expressed in ng/ml and represent mean ± sd. Numbers in parentheses indicate number of animals tested.
P < 0.05 vs. WT mice.
The underlying mechanisms for improved insulin sensitivity in sst5 KO mice are unknown. There could be a direct enhancement of glucose uptake by peripheral tissue in sst5 KO mice; however, direct effects of SRIF on peripheral glucose utilization have not been demonstrated (46). Because sst5 has a wide tissue distribution, it is possible that sst5 regulates insulin sensitivity and/or secretion via indirect mechanisms. One potential candidate is leptin. Leptin has been demonstrated to decrease insulin secretion from isolated endocrine islets and to enhance insulin sensitivity (47, 48). sst5 KO mice displayed increased leptin levels under fasting conditions. Although there is no report of sst5 expression in adipose tissue, a major source of leptin, the presence of SRIF binding sites on isolated rat adipocytes has been described (49). The function of SRIF receptors on adipocytes remains unknown. In vivo studies have demonstrated lowering of leptin levels by infusion of SRIF (50) and octreotide (51), an sst2/sst5-selective SRIF agonist; it is possible that SRIF regulates leptin secretion directly. We have detected sst5 expression in perigonadal adipocyte-rich tissue isolated from WT mice and in 3T3-L1 adipocytes by RT-PCR. In addition, we have evidence that sst5 plays a role in inhibiting leptin gene expression in vitro. In our preliminary studies on differentiated 3T3-L1 cells, which provide a cell model of adipocytes, compound 5/1 and SRIF inhibited leptin gene expression. These findings suggest that sst5 may directly regulate leptin gene synthesis and secretion. It is possible that sst5 negatively regulates leptin secretion and that increased leptin levels in sst5 KO mice could contribute to the improved insulin sensitivity.
Insulin levels and insulin sensitivity correlate in part with the degree of adiposity (52), and it is possible that changes in insulin sensitivity result from altered adipose tissue content. sst5 KO mice fed a high-fat diet showed a transient delay in a body weight gain and a trend toward reduced total adipose tissue content without any differences in food intake; however, no changes in body weight and adipose tissue content in chow-fed sst5 KO mice were observed.
sst5 KO mice showed increased fasting and postprandial glucagon levels. Previous studies on pancreatic islets isolated from sst2 KO mice did not provide any evidence for a direct role of sst5 in inhibiting glucagon secretion (38). It is possible that the increase in glucagon levels in sst5 KO mice is mediated indirectly. sst5 KO mice have postprandial glucose levels close to the fasting glucose levels observed in WT mice. Elevation of glucagon levels in sst5 null mice might be a counterregulatory mechanism to prevent possible hypoglycemia.
In summary, these studies show that SRIF subtype sst5 regulates insulin secretion from murine Langerhans islets in vitro. The in vivo data provide evidence that sst5 plays a role in regulating insulin sensitivity in rodents. Our data demonstrate that sst5 fulfills an important physiological function in the endocrine pancreas.
MATERIALS AND METHODS
Compounds and Solutions
SRIF-14, SRIF-28, Gey’s balanced salt solution (GBSS), BSA, d-glucose were purchased from Sigma-Aldrich Corp. (St. Louis, MO); liberase RI and FuGENE 6 transfection reagent were from Roche Molecular Biochemicals (Indianapolis, IN). Tissue culture medium Roswell Park Memorial Institute (RPMI) 1640, fetal bovine serum, α-MEM, penicillin, and streptomycin were from Life Technologies, Inc. (Gaithersburg, MD). AB 2.1-prime embryonic stem cells, the Mouse Kit, and ESQ Reagent System were from Lexicon Genetics (The Woodlands, TX). Leukemia-inhibiting factor and G418 were from Life Technologies, Inc. Regular diet (7012) was from Harlan Teklad (Madison, WI); high-fat diet (36% wt/wt, 58.4% kcal %) was purchased from Research Diets, Inc. (New Brunswick, NJ).
The SRIF receptor subtype-selective compounds compound 1, compound 2, compound 3, compound 4, and compound 5/1 were provided by Dr. S. P. Rohrer (Merck \|[amp ]\| Co., Inc., Rahway, NJ). The identification and characterization of these compounds were reported previously (35). Briefly, Ki values (nm) for each human receptor are as follows: compound 1: hsst1 (1.4), hsst2 (1875), hsst3 (2240), hsst4 (170), hsst5 (3600); compound 2: hsst1 (2760), hsst2(0.05), hsst3 (729), hsst4 (310), hsst5 (4260); compound 3: hsst1 (1255), hsst2 (>10,000), hsst3 (24), hsst4 (8650), hsst5 (1200); compound 4: hsst1 (199), hsst2 (4720), hsst3 (1280), hsst4 (0.7), hsst5 (3880); compound 5/1: hsst1 (3.3), hsst2 (52), hsst3 (64), hsst4 (82), hsst5 (0.4).
Stable Transfection of CHO-K1 Cells with the Mouse sst5
The mouse sst5 coding region was isolated as a 1.1-kb EcoRI-BamHI fragment. This fragment was subcloned into the corresponding restriction endonuclease sites in the mammalian expression vector pcDNA3.1 (Invitrogen, Carlsbad, CA). CHO-K1 cells were stably transfected with this mouse sst5 plasmid construct using FuGENE 6 transfection reagent according to the manufacturer’s protocol. Transfected CHO-K1 cells were maintained in α-MEM supplemented with 10% fetal calf serum in the continuous presence of G418 (500 μg/ml). G418-resistant single cells were subsequently cloned, and membranes prepared from isolated clones were assessed for msst5 expression using I125-SRIF-28. The clones with the highest expression level of msst5 were used for functional studies.
Determination of cAMP Levels
CHO-K1 cells stably transfected with mouse sst5 were seeded in 24-well tissue culture plates and grown for 72 h to 70% confluency. The medium was removed and cells (∼1.4 × 10⁵/well) were incubated in fresh α-MEM containing 500 μm 3 isobutyl-1-methylxanthine for 30 min. Medium was removed and cell monolayers were exposed to 10 μm forskolin with or without SRIF or SRIF agonists for 10 min at 37 C. The reactions were terminated by replacing the incubation medium with 0.1 n HCl. Cells were extracted overnight at −20 C in 0.1 n HCl. Cell extracts were assayed for cAMP content by an RIA kit (Biotrak, Amersham Pharmacia Biotech, Piscataway, NJ).
Animal Husbandry
Mice were maintained under controlled conditions of 25 C with food and water available ad libitum. All experimental animal protocols were approved by the Rahway Institutional Animal Care and Use Committee.
Generation of sst5-Deficient Mice by Gene Targeting in Mouse Embryonic Stem Cells
Design of Targeting Construct.
To delete the single coding exon of the mouse sst5 gene, a KpnI and a NotI restriction site were introduced upstream of the ATG and downstream of the stop codon, respectively, by PCR amplification of the cloned mouse genomic DNA. The targeting vector was constructed by assembling a 5-kb SalI-KpnI genomic fragment upstream of the ATG translation initiation codon and a 1.4-kb NotI-NotI genomic fragment downstream of the sst5 gene. A 4.7 kb KpnI-NotI fragment containing two genetic markers, a bacterial enzyme encoding lacZ under the transcriptional direction of the endogenous sst5 promotor and a pPGK neomycin expression cassette, under the control of the phosphoglycerol kinase promotor (PGK) was inserted between these flanking sequences. The start codon for the lacZ gene was placed in the identical location as the endogenous sst5 start codon. An additional restriction site for EcoRI was introduced at the 5′ of the lacZ gene to identify the homologous recombination event. The assembled targeting construct was subcloned into the plasmid vector Bluescript (Stratagene, La Jolla, CA).
Transfection and Cultivation of Embryonic Stem Cells
Embryonic stem cells AB2.1 derived from 129Sv/Ev mice were cultured on mitotically inactivated embryonic fibroblasts in the presence of leukemia-inhibiting factor. Approximately 1 × 10⁷ embryonic stem cells were transfected with 25 μg of the SalI-linearized targeting construct by electroporation (230 V, 500 μF). Cells were subjected to positive selection with 250 μg/ml of G418 for 12–14 d. Genomic DNA from G418-resistant embryonic stem cell clones was isolated and digested with the restriction endonuclease EcoRI to distinguish the wild type from the targeted sst5 allele. Southern blot analysis of the EcoRI digested WT sst5 gene, using a 900-bp BamHI-SalI fragment outside of targeting construct (5′-probe), identified a 20-kb fragment. Southern blot analysis of the EcoRI-digested targeted sst5 allele detected a 7.5-kb fragment, due to the introduction of an additional EcoRI site. The targeted embryonic stem cell clones were injected into C57BL/6J blastocysts using standard techniques (53). The injected blastocysts were reimplanted into pseudopregnant Tac: sw (fbr) mice and allowed to develop to term. Chimeric progeny from targeted embryonic stem cells were identified by agouti coat color. Mice with chimeric coats (95–100%) were crossed to C57BL/6J and agouti progeny were genotyped.
Genotyping of Embryonic Stem Cells and Animals
Screening by Southern Blot Hybridization.
Genomic DNA (10 μg) from WT AB 2.1 embryonic stem cells and from three targeted clones was digested with the restriction enzyme EcoRI, electrophoresed on a 0.7% agarose gel, transferred onto nylon Hybond-N+ membrane (Amersham Pharmacia Biotech), and hybridized with a 5′-probe and a 3′-probe outside of the targeting construct (see Fig. 1). Homologous recombination between the vector and the WT sst5 locus resulted in the deletion of the entire sst5 coding sequence and its replacement with the neomycin resistance gene. The probe used for detecting the targeted event was a 0.9-kb BamHI-SalI fragment upstream of the 5′-homologous sequence (probe A) and a 1.3-kb BstZ17I-HindII fragment downstream of the 3′-homologous sequence (probe B). The probe to detect the WT sst5 allele was a 400-bp Nae1-SalI fragment within the coding region of the mouse sst5 gene (probe C).
Genomic DNA was isolated from tails of 3- to 4-wk-old pups, digested with EcoRI, transferred to membrane, and hybridized with probe A or probe B as described above for embryonic stem cell DNA.
Screening by PCR
After generation of mouse lines carrying the targeted allele, subsequent progeny were genotyped by PCR. All oligonucleotides were obtained from Operon Technologies Inc. (Alameda, CA). The PCR reaction was performed using a HotStarTaq Master Mix Kit (QIAGEN, Valencia, CA) on a PTC-200 thermocycler (MJ Research, Inc., Waltham, MA). The primers for identification of the WT locus (primer 1 5′-GTGCCAACCCCCTGCTCTATGGC-3′ and primer 2: 5′-GGTATGCACTTGACCAGAGAAGG-3′) were used under the following PCR conditions: 1 cycle of 95 C for 15 min; and 35 cycles of 94 C for 15 sec, 62 C for 15 sec, and 72 C for 180 sec to generate a DNA fragment of 2.2 kb. The primers for identifying sst5 KO animals carrying the neomycin resistance gene (primer 3: 5′-ATCGCCTTCTATCGCCTTCTTGACGAG-3′ and the above described primer 2) were used under the following PCR conditions: 1 cycle of 95 C for 15 min; and 35 cycles of 94 C for 45 sec, 58 C for 30 sec, and 72 C for 180 sec to generate a DNA fragment of 2.3 kb.
Analysis of sst5 Expression by RT-PCR
Total pancreas RNA from 8- to 12-wk-old WT (+/+) and homozygous (−/−) sst5 KO mice was isolated using TriReagent (Molecular Research Center, Inc., Cincinnati, OH). RNA was treated with deoxyribonuclease (DNA-free, Ambion, Inc., Austin, TX) to remove residual DNA contamination. The expression of sst5 was detected by RT-PCR using 1 μg of total RNA and primers specific for the mouse sst5 gene (sense: 5′-CCGTGG CTGACGTGTTGTTTATG-3′, antisense: 5′-ATGCGAGTCACCTTGCGTTCTG-3′) under the following RT-PCR conditions: 1 cycle of 94 C for 30 sec; 35 cycles of 94 C for 30 sec, 58 C for 30 sec, and 68 C for 30 sec; and 1 cycle of 68 C for 5 min. A band of 481 bp was visualized on a 4% agarose gel, excised, and sequenced. RT-PCR with primers for 18S (Ambion, Inc.) was performed to ensure that equal quantities of RNA were used. No DNA contamination was detected by PCR without reverse transcription.
Histochemical Analysis of β-Galactosidase Expression
Analysis of β-galactosidase expression in the brain of adult 12-wk-old male WT and sst5 KO mice was performed. Brains were quickly removed and fresh frozen on dry ice. Serial sectioning was performed; sections were fixed and stained using a β-galactosidase kit from Specialty Media (Phillipsburg, NJ) according to the manufacturer’s instructions. Sections were stained with eosin, dehydrated, and photographed.
In Vitro Insulin/Glucagon Secretion Assays
All in vitro secretion experiments on pancreatic islets isolated from overnight fasted adult 129SvEv/C57BL/6J WT and sst5 KO mice (20–35 g, 3–6 months of age) were performed according to the previously described protocol (38). The original protocols for isolation of pancreatic islets (38, 54) have been modified to improve the quantity and quality of the islets. Enzymatic digestion of the exocrine pancreas was performed with liberase RI solution (0.2 mg/ml GBSS), which was injected into the bile-pancreatic duct (54). GBSS supplemented with 10% fetal bovine serum was used to stop the liberase RI action. Islets were hand picked under a stereomicroscope and maintained for 24 h in tissue culture medium as described previously (38). Approximately 100–130 islets per pancreas were isolated from WT and sst5 KO mice, and 95% survived the 24-h incubation period in RPMI 1640 medium as determined by methylene blue staining. Secretion experiments were carried out on islets that showed round, smooth surfaces and no obvious attached exocrine or connective tissue. Batch incubations were performed, as already described (38). Islets were washed three times in GBSS and incubated in GBSS at 37 C for a 120-min equilibration period. Islets were washed three times with GBSS and divided by size (small, medium, and large) into three groups. Three islets of each group were plated in individual wells of the incubation plates. Nine islets per 1 ml GBSS were divided into quadruplicate and incubated for 2 h with 5 mmd-glucose without SRIF or SRIF agonists. Basal insulin secretion was determined from supernatants of islets incubated for 2 h without glucose and SRIF or SRIF agonists. The incubation was terminated by aspirating the incubation medium followed by a brief centrifugation at 1000 × g. Supernatants were assayed immediately for insulin or glucagon content by a double antibody RIA (Linco Research Inc., St. Charles, MO).
Determination of Glucagon and Insulin Content in Endocrine Islets
Animals were fasted overnight with water available ad libitum before experiments. Isolated islets in batches of 40 were cultivated for 24 h in RPMI 1640. Islets were washed three times in GBSS and incubated for 120 min. at 37 C. After washing in GBSS the islets were incubated for an additional 120 min at 37 C. Incubation medium was carefully removed and islets were extracted overnight at −20 C in 1 ml acid ethanol (0.2 n HCl in 70% ethanol) (38). The extract was centrifuged at 12,000 × g at 4 C, and hormone content in the supernatant was measured by an RIA.
In Vivo Studies
Determination of Blood Glucose Levels and Glucose Tolerance Test.
Fasting and postprandial blood glucose levels were determined with the glucometer One Touch Basic (Lifescan Inc., Milpitas, CA). Intraperitoneal glucose tolerance test (IPGTT) (2 g × kg−1 body weight) was performed on age-matched adult male WT and sst5 KO mice after fasting for 14–16 h. Blood was withdrawn from tail veins before and after glucose challenge at indicated time points for determination of glucose concentrations.
Intraperitoneal Insulin Tolerance Test.
Male adult mice were injected with 0.3 U human insulin (Humulin, Eli Lilly \|[amp ]\| Co., Indianapolis, IN) and blood glucose was measured at indicated time points.
Determination of Basal Plasma Insulin, Glucagon, Leptin, IGF-I, Corticosterone, ACTH, and Lipids.
Plasma insulin, leptin, glucagon, triglycerides, cholesterol, and free fatty acid levels were determined in fed and in 14-h fasted mice. Plasma IGF-I, corticosterone, and ACTH levels were measured in samples collected from overnight-fasted mice. For insulin, leptin, ACTH, corticosterone, triglycerides, cholesterol, and free fatty acids, blood was collected from the retroorbital sinus. For IGF-I and glucagon measurements, blood was collected between 0900 and 1100 h by a cardiac puncture. IGF-I was extracted from plasma and measured by rat RIA according to the manufacturer’s protocol (Diagnostics Systems Laboratories, Inc., Webster, TX). For ACTH and corticosterone measurements, blood was collected between 0800 and 1000 h and within 20–30 sec to avoid stress-mediated elevation of both hormones. Plasma corticosterone was detected using a rat RIA (ICN Biomedicals, Inc., Aurora, OH) and ACTH by a rat ELISA kit (Peninsula Laboratories, Inc., San Carlos, CA). Plasma leptin and insulin levels were measured by a rat ELISA kit (Alpco, Windham, NH).
Determination of Total Adipose Tissue Content and Organ Weight.
Whole-body composition was determined by dual energy x-ray absorptiometry-scan using the QDR 4500 Small Animal Studies software version 9.0 (Hologic, Inc., Bedford, MA), as described (55). The differential attenuation of low- and high-energy x-rays by the tissues stands in proportion to tissue density. This information is used by the detector and associated software in conjunction with tissue calibration phantoms to assess body composition. Fat mass consists primarily of adipose tissue. Lean mass consists primarily of skeletal muscle, blood, bones, organs, tendons, cartilage, and body fluids. To determine the organ weight, animals were euthanized by CO2 and liver, heart, kidney, spleen, and perigonadal white adipose tissue were removed and immediately weighed.
Determination of Food and Water Consumption
Pelleted food (600 g per cage) was given to cages containing 5–10 animals. The weight of the remaining food was recorded at weekly intervals for a period of 10 wk. The amount of consumed water was estimated by the measurement of the weight of the water bottles at intervals of 48 h.
Data Analysis
All data represent mean ± sem and were obtained from four to six independent experiments unless otherwise stated. Statistical comparisons between means within a group were made using Student’s paired t test. Comparisons between means of different groups were analyzed by one-way ANOVA with a Neuman-Keuls multiple comparison posttest. Statistical comparisons and nonlinear regression analysis were performed with Prism 2.01 (GraphPad Software, Inc., San Diego, CA). Statistical significance was defined as P < 0.05.
Acknowledgments
We thank Dr. S. P. Rohrer for providing us with sst-selective nonpeptidyl agonists and Dr. S. E. Alves for help with brain and pancreas histology.
This work was supported by a grant from The Deutsche Forschungsgemeinschaft (Grant Str558/2-1) to M.Z.S.
Abbreviations:
- CHO,
Chinese hamster ovary;
- GBSS,
Gey’s balanced salt solution;
- IPGTT,
ip glucose tolerance test;
- PGK,
phosphoglycerol kinase promotor;
- RPMI,
Roswell Park Memorial Institute;
- SRIF,
somatostatin;
- sst1−5,
cloned SRIF receptor subtypes 1–5;
- sst5 KO,
homozygous SRIF receptor subtype 5 knockout;
- WT,
wild-type.
von der
