


Abstract
Nonvisual opsins are transmembrane proteins expressed in the eyes and other tissues of many animals. When paired with a light-sensitive chromophore, nonvisual opsins form photopigments involved in various nonvisual, light-detection functions including circadian rhythm regulation, light-seeking behaviors, and seasonal responses. Here, we investigate the molecular evolution of nonvisual opsin genes in anuran amphibians (frogs and toads). We test several evolutionary hypotheses including the predicted loss of nonvisual opsins due to nocturnal ancestry and potential functional differences in nonvisual opsins resulting from environmental light variation across diverse anuran ecologies. Using whole-eye transcriptomes of 81 species, combined with genomes, multitissue transcriptomes, and independently annotated genes from an additional 21 species, we identify which nonvisual opsins are present in anuran genomes and those that are also expressed in the eyes, compare selective constraint among genes, and test for potential adaptive evolution by comparing selection between discrete ecological classes. At the genomic level, we recovered all 18 ancestral vertebrate nonvisual opsins, indicating that anurans demonstrate the lowest documented amount of opsin gene loss among ancestrally nocturnal tetrapods. We consistently found expression of 14 nonvisual opsins in anuran eyes and detected positive selection in a subset of these genes. We also found shifts in selective constraint acting on nonvisual opsins in frogs with differing activity periods, habitats, distributions, life histories, and pupil shapes, which may reflect functional adaptation. Although many nonvisual opsins remain poorly understood, these findings provide insight into the diversity and evolution of these genes across anurans, filling an important gap in our understanding of vertebrate opsins and setting the stage for future research on their functional evolution across taxa.
Introduction
Animals rely on light detection to accomplish many biologically critical functions. Visual photosensitivity allows animals to acquire food, locate mates, and avoid predators. In recent years, the role of nonvisual photosensitivity has received increasing attention, revealing a diverse suite of physiologically important nonvisual functions including calibration of circadian rhythms, regulation of light-seeking behaviors, and initiation of seasonal reproductive changes (Nakane et al. 2010, 2014; Fernandes et al. 2012; Andrabi et al. 2023). The basis of animal photosensitivity lies in the conversion of light stimuli into neural stimuli—a process known as phototransduction—which is initiated by photopigments embedded in the membranes of light-sensitive cells. Each photopigment is composed of a transmembrane opsin protein encapsulating a light-sensitive chromophore. Different opsins confer distinct ranges of spectral sensitivity to their respective photopigments by maximally absorbing a specific wavelength of light. Upon absorption of light, the chromophore photoisomerizes, undergoing a conformational change that initiates phototransduction, generating a neural signal that can be interpreted for either visual or nonvisual functions (Terakita 2005; Hunt and Collin 2014). The function of opsins in initiating phototransduction and light detection is illustrated in Fig. 1.
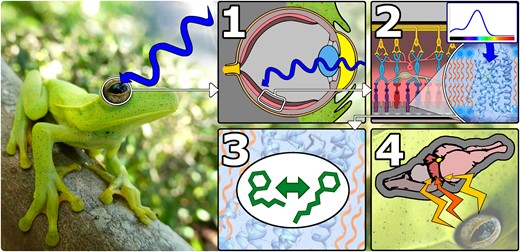
General overview of opsin function in vertebrates exemplified using the eye of a frog (Boana albomarginata, pictured here). 1) Light enters the eye and is focused on the retina. 2) Light reaches a photopigment (composed of an opsin and chromophore) embedded in the membrane of a light-sensitive retinal cell. The photopigment maximally absorbs a specific wavelength of light. In this example, the photopigment maximally absorbs blue light. 3) Absorption of light stimulates photoisomerization of the chromophore encapsulated within the opsin. 4) A neural signal is generated, processed in the retina and sent to the brain to be further processed and interpreted for visual or nonvisual purposes.
Opsins are divided broadly into eight groups based on amino-acid sequence similarity, molecular function, and signaling properties. The vertebrate visual opsin group contains opsins involved in initiating the formation of visual images, including rod opsin (RH1) and the cone opsins (LWS, RH2, SWS1, and SWS2). These opsins are associated with “bleaching” photopigments, meaning that following light exposure and photoisomerization, the chromophore dissociates from the opsin and renders the photopigment unreactive until the visual pigment can be regenerated with a new chromophore (Tsukamoto 2014). Opsins in the retinal photoisomerase group (RGR) and the peropsin group (RRH) function to regenerate chromophores used by bleaching photopigments (Terakita 2005; Radu et al. 2008; Zhang 2015). The other opsin groups include the encephalopsin/tmt-opsin group (OPN3 and TMT1 to 3), the Gq-coupled opsin/melanopsin group (OPN4m and OPN4x), the Go-coupled opsin group, the neuropsin group (NEUR1 to 6), and the paraphyletic vertebrate nonvisual opsin group (parietopsin [PAR], parapinopsin [PARA], vertebrate ancient opsin [VAOP], and pinopsin [PIN]), which forms a clade with the visual opsins. These opsin groups are generally found in photoreceptor cells in various major organs including the eyes, brain, and skin of many vertebrates (e.g. Foster and Bellingham 2004; Nakane et al. 2010; Davies et al. 2015; Kelley and Davies 2016). These opsins function in either bleaching or “nonbleaching” photopigments. Nonbleaching photopigments, also referred to as bistable photopigments, retain their chromophore following light exposure and photoisomerization. This is relevant to nonvisual photopigments because many are expressed in extraocular tissues that lack the specialized chromophore-regeneration mechanisms of the retina (Tsukamoto 2014; Steindal and Whitmore 2020). For the purposes of this study, we broadly refer to all opsins outside the vertebrate visual opsin group as nonvisual opsins. A summary of vertebrate opsin diversity and known spectral sensitivities, tissue expression, and functions is presented in Fig. 2.

Summarized diversity of exemplar spectral sensitivities, tissue expression, and functions across visual and nonvisual opsins. Phylogenetic hypothesis based on Beaudry et al. (2017) and Davies et al. (2015). Peak absorbance measurements and corresponding color are displayed beside the taxa in which each measurement was observed. Note that these values may vary across lineages. Tissue expression based on transcriptomic profiles in zebrafish (Davies et al. 2015). Citations for peak absorbance and functional overview notes can be found in supplementary table S1, Supplementary Material online.
The scope of opsin diversity coupled with the breadth of tissues and taxa expressing these genes suggests that the biological relevance of light detection extends far beyond the visual system. Among vertebrates, teleost fishes demonstrate the greatest opsin diversity, with 10 visual and 32 nonvisual opsins reported in zebrafish (Davies et al. 2015). This diversity likely arose through whole-genome duplication events, and the retention of these opsin genes in zebrafish is hypothesized to confer an adaptive advantage in dynamic freshwater light environments. Mammals, on the other hand, have lost multiple opsins, with 11 opsins (two visual) inferred to have been lost ancestrally, and an additional three opsins (one visual) lost in placentals (Gemmell et al. 2020). This disparity of opsin diversity across vertebrates emphasizes the importance of ecology in the evolution of opsin systems. For example, the loss of opsin diversity in mammals is hypothesized to result from a “nocturnal bottleneck” in which ancestral mammals transitioned to nocturnal lifestyles and encountered a reduced need for broad spectral sensitivity (Gerkema et al. 2013; Borges et al. 2018). Ecological transitions to low-light environments are also thought to explain the loss of opsin diversity in other tetrapod taxa, including geckos (Pinto et al. 2019), crocodilians (Emerling 2017), snakes (Davies et al. 2009; Schott et al. 2018; Gower et al. 2022), whales (Meredith et al. 2013), burrowing rodents (Emerling and Springer 2014), and nocturnal primates (Kawamura and Kubotera 2004). These examples highlight the impact of low-light ecological transitions on opsin diversity and evolution; however, the influence of other environmental, developmental, and morphological adaptations remains poorly studied.
Frogs and toads (Anura, hereafter collectively “frogs”) provide an opportune system in which to investigate opsin diversity and evolution because they demonstrate remarkable variation in activity period, habitat, distribution, life history, and pupil shape (e.g. Wiens et al. 2006; Moen et al. 2013; Thomas et al. 2022a). This variation exposes frogs to diverse light environments and sensory constraints, which in turn introduce unique evolutionary challenges to the nonvisual system that we hypothesize have driven functional adaptation, and loss, of nonvisual opsins. Specifically, the nocturnal bottleneck hypothesis exemplifies a connection between the evolution of nonvisual opsins and adaptation to new activity periods and habitats in several tetrapod groups but has not yet been investigated in anurans. We also hypothesize that species distribution has influenced nonvisual opsin functional evolution, because species distributed outside tropical zones experience more predictable seasonal variation in photoperiod (Canavero and Arim 2009; Borah et al. 2019). Variation in both seasonality and photoperiod has implications for nonvisual opsin function because these proteins are involved in responses to seasonality (Nakane et al. 2010) and regulation of circadian rhythm (Göz et al. 2008). Many frog species also experience a dramatic shift in light environment across development as they metamorphose from aquatic larvae to terrestrial adults. We hypothesize that this biphasic life history subjects nonvisual opsins to disparate environmental constraints and selective pressures across metamorphosis, resulting in adaptive decoupling in biphasic frog species (Schott et al. 2022). Furthermore, a subset of frog species, known as direct developers, lack a free-living aquatic larval stage, which provides an opportunity to test whether species with different life history strategies exhibit differences in selection across nonvisual opsins. Finally, frogs demonstrate a strikingly diverse suite of pupil shapes that regulate the amount of light reaching the retina through pupillary constriction (Malmström and Kröger 2006; Thomas et al. 2022a). We hypothesize that this morphological diversity is associated with nonvisual opsin evolution because these proteins have been implicated in the regulation of pupillary light responses (Keenan et al. 2016). Taken together, the environmental, developmental, and morphological diversity of frogs makes them an attractive study system in which to investigate nonvisual opsin diversity and evolution.
Here, we extract nonvisual opsin genes from de novo whole-eye transcriptome assemblies of 81 frog species. Sampling only eye transcriptomes may provide an incomplete picture of nonvisual opsin diversity because these genes are expressed in many extraocular tissues; therefore, we supplement our whole-eye transcriptome sampling with publicly available genomes, multitissue transcriptomes, and independently annotated genes from an additional 21 species. Together, these 102 frog species represent 34 of 56 currently recognized frog families, including a broad sampling of environmental, developmental, and morphological adaptations. We predict that this variation has influenced the diversity and molecular evolution of the nonvisual opsins (Fig. 3). We aim to (i) identify which nonvisual opsin genes are expressed in the eyes of frogs and test whether a nocturnal ancestry has driven opsin gene loss in frog genomes; (ii) compare selection among nonvisual opsin genes; and (iii) test hypotheses of adaptive evolution by comparing selection among frogs with differing ecologies.
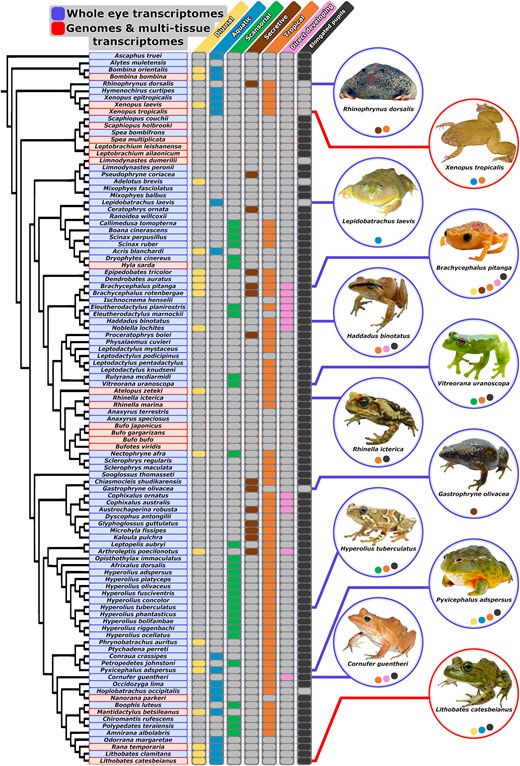
Variation in adult activity period, adult habitat, distribution, life history, and pupil shape across our species sampling. Each column represents one of seven trait partitions used to analyze shifts in selective constraint across discrete environmental, developmental, and morphological transitions in frogs. Filled (colored) bubbles in trait columns indicate the foreground partition for selection analyses (e.g. diurnal). Unfilled (gray) bubbles indicate the background partition for selection analyses (e.g. nondiurnal). Phylogenetic hypothesis based on several large-scale phylogenetic studies (Pyron and Wiens 2011; Feng et al. 2017; Jetz and Pyron 2018; Streicher et al. 2018). Trait coding citations are available in supplementary table S4, Supplementary Materials online. Photographs by M.K.F. (Rhinophrynus dorsalis and Xenopus tropicalis), J.W.S. and D.J.G. (Lepidobatrachus laevis and Cornufer guentheri), J.L.B. (Brachycephalus pitanga, Haddadus binotatus, Vitreorana uranoscopa, Rhinella icterica, Gastrophryne olivacea, and L. catesbeianus), Christian Irian (Hyperolius tuberculatus), and John Clare (P. adspersus).
Results
Fourteen Nonvisual Opsins Consistently Expressed in Frog Eyes
Our total sampling included 92 whole-eye transcriptomes from 81 species, 19 genomes from 15 additional species, and multitissue transcriptomes or independently annotated genes from six additional species. Across the frog genomes, we recovered all 18 nonvisual opsins inferred to be present in the ancestral vertebrate (Beaudry et al. 2017; Gemmell et al. 2020), although recovery success varied across genes. OPN3 was recovered from the fewest genomes (10), while NEUR4 and PIN were recovered in all 19 genomes (supplementary table S5, Supplementary Material online). Most cases where a gene was not recovered are likely due to incomplete genome coverage and assembly. However, there is evidence for the loss of NEUR2 in some frog lineages because we were unable to recover this gene from the multiple hylid and bufonid genomes that are presently available (five species). Furthermore, this gene was not recovered from any of the eye transcriptomes with the exception of a single partial transcript in Spea bombifrons.
In terms of expression in the eye, we found that four genes (NEUR2, OPN3, PAR, and PARA) were expressed in very few samples (0 to 11). For the four species in which our sampling included both an eye transcriptome and a genome (Lithobates catesbeianus, Pyxicephalus adspersus, Scaphiopus couchii, and S. bombifrons), NEUR2, OPN3, PAR, and PARA were mostly absent from the eye transcriptome and present in the genome (with a few exceptions noted in supplementary table S5, Supplementary Material online). These four genes were dropped from downstream analyses because their low rates of recovery success limited our ability to generate reliable phylogenies and perform selection analyses. We recovered the remaining 14 nonvisual opsins with some degree of consistency (ranging from 34.2% to 94.7% recovery of whole or partial coding sequences, detailed in supplementary table S5, Supplementary Materials online) across our total sampling.
Evidence for Positive Selection in a Subset of Frog Nonvisual Opsins
To determine the overall selective constraint acting on each nonvisual opsin, we used the PAML M0 model to estimate the average rate ratio of nonsynonymous to synonymous substitutions (dN/dS or ω) across all codon sites in each gene alignment. These tests revealed fairly consistent selective constraint acting on frog nonvisual opsins, with most genes demonstrating mean ω values between 0.09 and 0.18 as illustrated in Fig. 4a. Only NEUR6 fell outside of this range, with an elevated mean ω value of 0.25. Taken together, all 14 nonvisual opsins have a mean ω < 1, indicating negative purifying selection. This is expected in most functional protein-coding genes, whose proteins are made up of a high proportion of invariable amino acids (with ω near 0) due to strong functional constraints (Yang et al. 2000). However, genes demonstrating overall negative selection may still contain positively selected codon sites. We tested for this using the PAML M8 model, which unlike the M0 model, allows ω to vary between sites in a gene. The M8 model is compared with the null models M7 and M8a (which allow ω to vary but constrain ω ≤ 1) to test for the presence of positively selected sites using a likelihood ratio test (LRT). Using this approach, we found statistically significant positive selection at a proportion of sites in PIN, TMT1, TMT2, and VAOP as illustrated in Fig. 4b. The most extreme signature of positive selection was detected in PIN, which had an ω value of 3.17 (M8 vs. M8a: LRT = 13.2, P < 0.001). For comparison, the second most elevated signature of positive selection was observed in VAOP, with an ω value of 1.90 (M8 vs. M8a: LRT = 4.91, P = 0.027). Because the PAML M8 model estimates ω as a single parameter, it is possible for ω to be overestimated in instances of synonymous rate variation across a phylogeny. We tested for this using BUSTED with synonymous rate variation and identified statistically significant evidence of episodic diversifying selection in NEUR4, NEUR5, OPN4m, and OPN4x, which do not overlap with the genes identified by our PAML M8 results supplementary fig. S1, Supplementary Material online. Analyses with BUSTED that instead do not allow synonymous rate variation do not have evidence for positive selection in three of the four genes identified by M8 (TMT1, TMT2, and VAOP). PIN was significant with M8 and BUSTED without synonymous rate variation, but not BUSTED with synonymous rate variation; although the estimated rates were similar, the test was not significant (LRT = 3, P = 0.107). An opposite pattern is seen in two of the four genes identified with BUSTED where not allowing synonymous rate variation results in statistical nonsignificance (NEUR4 and NEUR5), whereas no difference was found for the other two genes (OPN4m and OPN4x). These results suggest that not accounting for synonymous rate variation is not a cause of false inferences of positive selection but does result in statistical differences. Differences between BUSTED and M8 appear primarily due to differences in model formulation (including the use of a discretized beta distribution to determine site classes in M8 vs. three site classes in BUSTED). Overall, these results provide evidence for positive selection on frog nonvisual opsins and suggest that adaptive evolution may be occurring within a subset of these genes. Complete PAML random sites models and BUSTED results are presented in supplementary tables S6 and S7, Supplementary Material online, while the number and position of positively selected sites estimated with the PAML M8 model are detailed in supplementary table S8, Supplementary Material online.
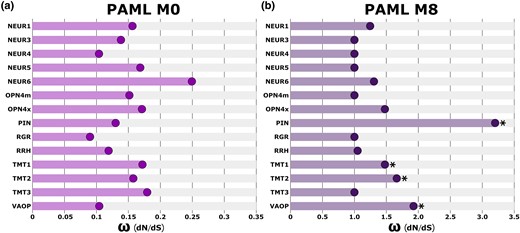
Patterns of selective constraint across nonvisual opsin genes. a) The PAML M0 analysis averages ω values across all codon sites in a gene alignment. Among nonvisual opsins, NEUR6 had the most elevated ω while RGR had the least elevated ω, suggesting variation in selective constraint among nonvisual opsin genes. b) The PAML M8 analysis tests for the presence of positively selected codon sites in a gene alignment. The ω of the positively selected site class is shown. Four nonvisual opsins demonstrated statistically significant (P < 0.05) evidence for positively selected sites (indicated with an asterisk). Note that graphs a) and b) use different scales along the x axes.
Shifts in Selective Constraint among Nonvisual Opsins Are Associated with Variation in Adult Activity Period, Adult Habitat, Distribution, Life History, and Pupil Shape
Because analyses of gene and species phylogenetic topologies sometimes yielded different significant results, we gave greater weight to results where the same partition was significant across analyses of both topologies and reported only those results here unless otherwise noted. Full results are available in supplementary tables S9 to S11, Supplementary Material online. Significant differences in selective constraint were detected for many of our trait partitions (Fig. 5). The adult activity partition was significant in four genes and was the best-fit partition for OPN4x (ωdiu = 0.35/ωnondiu = 0.28, P = 0.006), PIN (ωdiu = 0.35/ωnondiu = 0.28, P = 0.051), and VAOP (ωdiu = 0.26/ωnondiu = 0.21, P = 0.056), indicating that within each gene, the difference in selective constraint between foreground (diurnal) and background (nondiurnal) groups was greater than the difference in any other partition. The adult activity partitions for PIN and VAOP were significant for analyses of the gene topologies (P = 0.016 and 0.039, respectively) and were marginally nonsignificant (P = 0.051 and 0.056, respectively) for analyses of the species topologies, yet the adult activity partitions were the best fits for PIN and VAOP across both sets of topologies. Among the three adult habitat partitions, the aquatic partition was significant in three genes and was the best fit for NEUR3 (ωaqu = 0.34/ωnonaqu = 0.26, P = 0.003) and NEUR4 (ωaqu = 0.30/ωnonaqu = 0.21, P = 0.001). The scansorial partition was significant in two genes and was the best fit for NEUR6 (ωsca = 0.48/ωnonsca = 0.32, P < 0.001). The secretive partition was significant in one gene, with no best fits. The distribution partition was significant and a best fit for TMT3 (ωtrp = 0.26/ωnontrp = 0.33, P = 0.019). Interestingly, the life history partition was the most frequent significant partition among nonvisual opsins, with eight genes having a significant difference in selective constraint between direct-developing and biphasic species. The life history partition was also the best-fit partition for five of these genes, including NEUR1 (ωdrd = 0.38/ωbip = 0.28, P = 0.016), OPN4m (ωdrd = 0.48/ωbip = 0.27, P < 0.001), RRH (ωdrd = 0.35/ωbip = 0.24, P = 0.028), TMT1 (ωdrd = 0.44/ωbip = 0.26, P < 0.001), and TMT2 (ωdrd = 0.44/ωbip = 0.25, P < 0.001). Finally, because OPN4m has been implicated in regulating the pupillary light response, we tested the elongated pupil partition to explore how constricted pupil shape might relate more generally to nonvisual opsin evolution. The elongated pupil partition was not significant in OPN4m across topologies, but was otherwise significant in two genes, and was the best fit for RGR (ωelp = 0.21/ωnonelp = 0.33, P = 0.002).
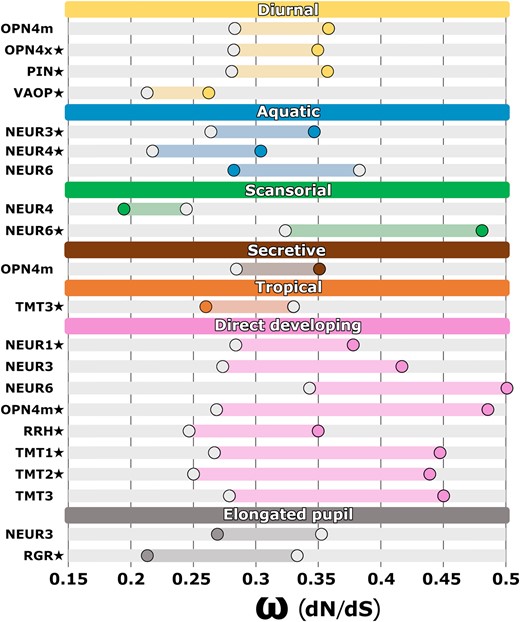
Shifts in selective pressure on nonvisual opsin genes across frog trait partitions as illustrated in Fig. 3. The ω (dN/dS) values of the divergent site class using CmC analysis of nonvisual opsin species topologies are shown, highlighting the difference between the foreground (filled circle) and the background (unfilled circle) partitions for each gene. Under each trait partition, genes with statistically significant (P < 0.05) shifts in selection across analyses of both gene and species topologies are shown. Best-fit partitions are indicated with a star. Complete PAML results are available in supplementary tables S9 to S11, Supplementary Material online.
We used RELAX to test specific hypotheses regarding nonvisual opsin evolution in genes with known functions that demonstrated a significant shift in selective constraint across a partition. These analyses revealed significant evidence for relaxed selection acting on PIN, OPN4m, OPN4x, and VAOP in diurnal species (K = 0.81, 0.11, 0.89, and 0.77, P ≤ 0.029). Furthermore, these analyses revealed evidence for relaxed selection in six of the eight significant direct-developing partitions, including NEUR1 (K = 0.66, P = 0.004), NEUR3 (K = 0.47, P = 0.002), NEUR6 (K = 0.68, P = 0.007), OPN4m (K = 0.11, P < 0.001), RRH (K = 0.58, P = 0.006), and TMT2 (K = 0.52, P < 0.001). A full summary of our RELAX results is available in supplementary table S12, Supplementary Material online.
Discussion
Using a combination of de novo assembled whole-eye transcriptomes and previously published genomic and transcriptomic resources, we obtained nonvisual opsin sequences from 102 frog species spanning 34 families. We consistently recovered 14 nonvisual opsin genes from frog eye transcriptomes, and positive selection was detected in a subset of these genes, most notably PIN. We also found variation in selective constraint between frog lineages partitioned by adult activity period, adult habitat, distribution, life history, and pupil shape, which may reflect functional adaptation in frog nonvisual opsin genes. Below, we discuss these findings with respect to our current understanding of nonvisual opsin diversity, expression, function, and evolution.
Unexpected Nonvisual Opsin Diversity across Frogs
The common ancestor of all vertebrates is estimated to have had a genomic complement of 18 nonvisual opsins (Beaudry et al. 2017; Gemmell et al. 2020). However, over the course of vertebrate evolution, nonvisual opsin diversity has shifted across groups. Nonvisual opsin gene losses have been most apparent in groups with primarily nocturnal evolutionary histories, including between nine and 11 losses in mammals, nine losses in snakes, five losses in geckos, and four losses in crocodilians (Gemmell et al. 2020). These losses have all been attributed to a “nocturnal bottleneck” in which ancestors of each group transitioned to nocturnal lifestyles and encountered a reduced need for broad spectral sensitivity (Emerling and Springer 2014; Borges et al. 2018; Pinto et al. 2019). Adults of most frog species are primarily nocturnal, and this activity period is thought to be the ancestral condition for anurans (Anderson and Wiens 2017). Given this evolutionary history, we expected frogs to have reduced nonvisual opsin diversity compared to the common ancestor of vertebrates. Instead, we recovered remarkable nonvisual opsin diversity across frogs, with 14 of 18 nonvisual opsins consistently recovered from eye tissues. Of the four genes we failed to consistently recover, two genes, PAR and PARA, are thought to be expressed exclusively in the pineal region of the brain, and thus, it is not surprising that we had limited success recovering these nonvisual opsins from our eye transcriptome data set. The inconsistent recovery of the other two genes, NEUR2 and OPN3, is less straightforward to understand. To our knowledge, there is no published expression profile or functional study of NEUR2 in any taxa, which limits our ability to speculate on why we failed to consistently recover this gene. On the other hand, OPN3 studies in other vertebrates report expression in many tissues, including the retina, brain, and liver (Halford et al. 2001). Thus, the absence of OPN3 in all of our 92 frog eye transcriptomes is surprising given reports of its expression in eye or retinal tissue across diverse taxa, including human retinas (Halford et al. 2001), chicken retinas (Rios et al. 2019), and zebrafish eyes (Davies et al. 2015). Although the retina is reported to have the greatest opsin diversity of any tissue (Davies et al. 2015), some nonvisual opsins may be expressed at very low levels (Do 2019), and there remains a possibility that both NEUR2 and OPN3 are expressed at levels below our threshold of detection, especially considering that we sequenced whole-eye tissue and not isolated retinal tissue.
Comparatively, across our whole-genome data set, we had much greater success recovering PAR and PARA, with whole or partial sequences recovered from 18 of 19 genomes for both genes (supplementary table S5, Supplementary Materials online). This suggests that both PAR and PARA are retained in frogs; however, these genes appear to be expressed primarily in extraocular tissues. We also recovered NEUR2 and OPN3 with greater consistency across the whole-genome data set, with whole or partial sequences recovered in 11 and 10 genomes, respectively (supplementary table S5, Supplementary Materials online). Additionally, for both NEUR2 and OPN3, we found no evidence of nonfunctionalization among our recovered sequences, although we found preliminary support for the loss of NEUR2 in hylids and bufonids, based on consistent absence in the five genomes from those taxa. Consequently, we conclude that none of the ancestral vertebrate nonvisual opsins has been lost across frogs and, instead, frogs appear to have maintained a remarkably diverse repertoire of these genes.
Adaptive Decoupling, the Nocturnal Bottleneck, and an Alternative Hypothesis of Opsin Evolution
Frogs have maintained an unexpectedly diverse complement of nonvisual opsins, especially for a group demonstrating primarily nocturnal activity patterns. This may be due, at least in part, to the biphasic life history of most frogs. Although many fully metamorphosed frogs are nocturnal, this is not necessarily true of their aquatic larvae. Instead, many species that are nocturnal as adults are active and forage in daylight as larvae (Beiswenger 1977; Griffiths and Mylotte 1988; Ding et al. 2014). This biphasic life history may subject nonvisual opsins to disparate environmental constraints and selective pressures across metamorphosis, resulting in adaptive decoupling between larvae active in bright light and adults active in low light (Ebenman 1992; Schott et al. 2022). Adaptive decoupling may complicate our ability to test expectations of the nocturnal bottleneck hypothesis, which posits low-light adaptation as the most proximate driver of opsin evolution and diversity in many taxa (Emerling 2017; Borges et al. 2018; Pinto et al. 2019), because it obscures the distinction between light-adapted and dark-adapted species.
In this study, we partitioned frogs based on adult activity period. This was necessary because larval activity period is poorly characterized across frogs. Despite this potential lack of nuance, a significant difference in ω between diurnal and nondiurnal frog species was detected in four genes with clade model C (CmC), and in each case, the diurnal species demonstrated elevated ω. This elevated rate of nonsynonymous nucleotide substitution among diurnal frogs may be the product of either relaxed or adaptive selection. Considering the nocturnal bottleneck hypothesis, we predicted that the elevated ω values observed in diurnal lineages are driven by intensified (i.e. adaptive) selection on nonvisual opsins because broad spectral sensitivity is likely adaptive in diurnal species. Our RELAX analyses did not support this prediction, instead revealing significant evidence for relaxed selection in all four genes (OPN4m, OPN4x, PIN, and VAOP; supplementary table S12, Supplementary Material online). Considering the unexpected diversity of frog nonvisual opsins alongside these selection signatures, it appears that expectations of the nocturnal bottleneck hypothesis do not hold true for frogs, and we suggest this may be due to widespread adaptive decoupling across frogs.
Through the lens of adaptive decoupling, our findings may offer support for an alternative hypothesis of opsin evolution. Beaudry et al. (2017) critiqued the nocturnal bottleneck hypothesis’ focus on evolutionary transitions to low-light ecologies and instead focused on developmental transitions as driving opsin evolution and diversity. They pointed to opsin losses in Mammalia, Aves, and Squamata, emphasizing that these groups undergo much of their development within the dark confines of a womb or shelled egg. By contrast, most amphibians and fishes undergo free-living larval development in relatively bright environments and appear to have retained large opsin repertoires (Davies et al. 2015; this paper). Opsin diversity imparts sensitivity to a broad range of light wavelengths, which is likely beneficial to larval amphibians and fishes, whose translucent or transparent bodies make them particularly susceptible to photo-oxidative stress and DNA damage caused by exposure to light (Beaudry et al. 2017). However, Beaudry et al. (2017) only considered opsin losses in Squamata at a coarse taxonomic scale and it should be noted that losses in squamates are restricted to ancestrally nocturnal groups (i.e. snakes and geckos; Gemmell et al. 2020). While this should cast doubt on the relevance of egg-based development in driving opsin diversity and evolution, the emphasis on development is still worthwhile. For example, recent annotation of the tuatara genome revealed only one opsin loss despite nocturnal ancestry (Gemmell et al. 2020). This maintenance of opsin diversity was hypothesized to result from the tuatara's unusual life history, in which juvenile tuatara often adopt diurnal and arboreal lifestyles to avoid predation by cannibalistic adults, which hunt primarily at night. Thus, tuataras and many frogs experience disparate light environments across life stages, which may explain why these groups demonstrate the lowest documented levels of opsin gene loss among ancestrally nocturnal tetrapod groups.
The importance of adaptive decoupling in driving opsin evolution may further explain why the life history partition was the most frequently significant partition among nonvisual opsins, with eight genes demonstrating a significant difference in ω between direct-developing and biphasic frog species with CmC. The life history partition was also the best fit for five of these genes, and in each case, the direct-developing species demonstrated elevated ω. Considering the adaptive decoupling hypothesis, we predicted that elevated ω values in direct-developing lineages are driven by relaxed selection on nonvisual opsins because these genes are less adaptive in species without larvae. Our RELAX analyses supported this prediction, revealing significant evidence for relaxed selection in six of the genes with significant direct-development CmC partitions (NEUR1, NEUR3, NEUR6, OPN4m, RRH, and TMT2; supplementary table S12, Supplementary Material online). In parallel analyses of frog visual opsins, we did not observe the same pattern of repeated significance across direct-development partitions (Schott et al. 2024a), suggesting that the pattern observed in nonvisual opsins is specific to these genes and not necessarily reflective of broadly elevated ω in photosensitivity genes across the genomes of direct-developing species. Collectively, these results support the hypothesis that many nonvisual opsins are especially relevant in species whose complex life histories expose them to disparate light environments across development.
OPN4, Behavioral Light Responses, and Life History
In zebrafish larvae, OPN4 plays a role in triggering nondirectional, stochastic hyperactivity in darkness, resulting in the aggregation of larvae into illuminated areas where they remain due to reduced activity (Fernandes et al. 2012). This behavior, known as dark photokinesis, is understood to drive zebrafish larvae out of dark areas, allowing them to maintain a homeostatic distribution in illuminated waters. Similar behavioral light responses have been observed in frog larvae (e.g. Muntz 1963; Jaeger and Hailman 1976; Beiswenger 1977; Roberts 1978; Branch 1983; Fraker 2008; Ding et al. 2014). Given these observations, we hypothesized that OPN4 may play a role in regulating the behavioral light responses of frog larvae. We tested this hypothesis using the direct-development partition from our PAML clade-model analyses with the two OPN4 genes found in frogs. We found a significant difference in selective constraint acting on OPN4m between direct-developing and biphasic frog species, with the former demonstrating elevated ω. Our RELAX analysis indicated that this elevated ω is the result of relaxed selection in direct-developing species. Considering our understanding of OPN4's function in larval zebrafish, the relaxed selection observed in direct-developing frogs may be evidence of reduced functional relevance in species without aquatic larvae. Furthermore, OPN4m is differentially expressed in leopard frog eyes across metamorphosis, with significantly reduced expression in fully metamorphosed juveniles compared to larvae (Schott et al. 2022). Taken together, these findings suggest that the function of OPN4m is especially relevant in larval frogs, potentially contributing to behavioral light responses. However, further functional study in a broad diversity of frogs is needed to support this hypothesis.
PIN and Low-Light Photoreception
PIN was first discovered in the chicken pineal gland in 1994, making it the first opsin to be characterized in an extraocular organ (Okano et al. 1994). Because expression of PIN was initially observed only in the pineal gland, the opsin was thought to function strictly in regulating the production and secretion of melatonin (Csernus et al. 1999). However, low levels of PIN expression were later reported in the outer retina of a gecko (Taniguchi et al. 2001) and more recently in rod cells in the outer retina of a fish and frog (Sato et al. 2018). In addition to being expressed in rod cells, PIN also exhibits a thermal isomerization rate strikingly similar to that of RH1, the rod visual opsin responsible for high-sensitivity dim-light vision. This observation suggests that, at least in the eyes of fishes and frogs, PIN may function as an RH1-like visual pigment contributing to low-light photoreception (Sato et al. 2018). We found a significant difference in selective constraint acting on PIN between diurnal and nondiurnal frogs, with diurnal species having an elevated ω value. Considering PIN's hypothesized role in low-light photoreception, we predicted that this elevated ω value is the result of relaxed selective constraint in diurnal species, which are likely less dependent on low-light photoreception to sense their environments. The RELAX analysis supports this hypothesis, revealing significant evidence for relaxed selection in diurnal species and supporting PIN's hypothesized role in low-light photoreception.
Nonvisual Opsins and Seasonality
Tropically distributed species are typically exposed to less seasonal variation in photoperiod, often causing them to rely on humidity cues to synchronize physiological and behavioral changes with seasonality (Canavero and Arim 2009; Borah et al. 2019). In amphibians, seasonal precipitation has historically received the most attention as a potential cue stimulating physiological and behavioral changes related to reproduction (Feder and Burggren 1992; Duellman and Trueb 1994; Stebbins and Cohen 1997). However, growing evidence indicates that photoperiod sensitivity may be the most proximal factor determining seasonal changes in physiology and activity in amphibians (Canavero and Arim 2009). Nonvisual opsins have been implicated in the seasonal sensitivity of birds (specifically NEUR1; Nakane et al. 2010) and may serve a similar function in frogs. To test if selection signatures support this hypothesis, the distribution partition was designed to approximate exposure to seasonal variation in tropical versus nontropical taxa. We found a significant difference in selective constraint of a single gene (TMT3) between tropical and nontropical frogs, with nontropical species demonstrating elevated ω values.
As far as we are aware, nothing is known about TMT3 function in frogs, and more broadly, little is known about its function in vertebrates. We had predicted the distribution partition would be significant for NEUR1, which is reported to regulate seasonal reproductive changes in quail, including thyroid-stimulating hormone secretion and subsequent testicular growth (Nakane et al. 2014). However, NEUR1 showed differences in selective constraint only for the direct-developing partition. Like birds, frogs demonstrate many conspicuous seasonal changes associated with breeding. These changes include hormone secretion and testicular growth (Delgado et al. 1989), as well as nuptial pad development (Willaert et al. 2013) and dynamic sexual dichromatism (Bell et al. 2017). One particularly well-studied example of seasonal reproductive changes is found in subtropical Leishan mustache toads (Leptobrachium leishanense). During the breeding season, males of this species develop mustache-like nuptial spines on their maxillary skin. The development of these spines has been linked to seasonal steroid biosynthesis and thyroid hormone secretion (Li et al. 2019), implicating similar hormonal pathways to those activated by NEUR1 in quail. It is possible that TMT3, rather than NEUR1, is contributing to seasonal sensitivity and reproductive changes in frogs. TMT2, a very closely related opsin, has been implicated in behavioral adjustment of medaka fish in response to the onset of cold temperatures (Zekoll et al. 2021), creating a precedent for seasonally linked function within the tmt-opsin group. If TMT3 is playing a role in the seasonal response, we would expect that this elevated ω is the product of adaptive selection in nontropical species due to the greater seasonal variation in the photoperiod they experience. However, our RELAX analysis revealed no signature of relaxed or adaptive selection in nontropical species. This may be because partitioning species as tropical or nontropical fails to capture exactly which species rely on photoperiod to cue seasonal reproduction. A better test of TMT3's relevance to seasonal reproduction might be to partition frogs that are observed to reproduce continuously throughout the year, such as the tropical toad Duttaphrynus melanostictus (Jørgensen et al. 1986) and frogs that reproduce on a strictly seasonal basis. This test would require a more extensive understanding of seasonal reproduction in frogs than is available in current literature, as well as denser taxonomic sampling of nonvisual opsins. Given our findings, TMT3 warrants further study to clarify its role in frogs, including the possibility of regulating seasonal reproductive changes and as a candidate for the basis of seasonal sensitivity in frogs.
Conclusions
Frogs offer a compelling system in which to study the evolution of light sensitivity across diverse ecologies, morphologies, and life history strategies. We found that frogs have retained a diverse repertoire of nonvisual opsins, with 14 genes consistently recovered from frog eye transcriptomes. At the genomic level, frogs appear to have broadly maintained all 18 ancestral vertebrate nonvisual opsins and thus demonstrate the lowest documented rate of opsin gene loss among ancestrally nocturnal tetrapod groups. Signatures of positive selection were detected in a subset of these genes. We also found variation in selective constraint between discrete ecological, life history, and morphological classes, which may reflect functional adaptation in frog nonvisual opsin genes. Our findings provide genomic support for emerging hypotheses of nonvisual opsin evolution, including the role of PIN in low-light photoreception and the adaptive importance of many nonvisual opsins in species with complex life histories.
Materials and Methods
Species Sampling
Our sampling included a total of 92 whole-eye transcriptomes from 81 species, 19 genomes from 15 additional species, and multitissue transcriptomes or independently annotated genes from 6 additional species. Of the 92 whole-eye transcriptomes, 83 of these samples were collected from adult frogs, and the remaining nine were collected from larval frogs (supplementary table S2, Supplementary Materials online). Frogs were sampled from wild populations in Australia, Brazil, Cameroon, Ecuador, Equatorial Guinea, French Guiana, Gabon, the Seychelles, the United Kingdom, and the United States (supplementary table S2, Supplementary Materials online). Additional species were obtained from commercial dealers or captive colonies. Most individuals were kept in complete darkness (i.e. were dark adapted) for 3+ h prior to euthanasia (via immersion in a solution of MS222) because one eye was removed for microspectrophotometry measurements as part of another study (Schott et al. 2024a). Whole eyes were extracted, punctured, and placed in RNAlater (Ambion) for at least 24 h at 4 °C to allow the RNAlater to saturate the cells prior to freezing and storage at −80 °C until use. Some samples were collected at remote field sites and were kept as cool as possible in RNAlater prior to freezing at −80 °C at the earliest opportunity. Voucher specimens and tissues for further genetic analysis were accessioned in natural history museums (supplementary table S2, Supplementary Materials online). To supplement the phylogenetic and ecological diversity of species we collected, we searched GenBank for publicly available frog genomes and multitissue transcriptomes to include in our analyses. These included 19 genomes and 6 multitissue transcriptomes or independently annotated genes from adult, larval, or mixed adult/larval frog samples (supplementary table S3, Supplementary Materials online). Our combined sampling includes 102 species, representing 34 of 56 currently recognized frog families (Frost 2024; Fig. 3).
Transcriptome Sequencing and Assembly
Total RNA was extracted from whole eyes using the Promega Total SV RNA Extraction Kit (Promega). Tissue was homogenized in lysis buffer using the Qiagen Tissuelyzer (10 min at 20 Hz). Messenger RNA library construction was performed using the Kapa HyperPrep mRNA Stranded with Riboerase Kit (Roche). Each indexed sample was pooled in equimolar amounts and sequenced with paired-end 150-bp reads on a HiSeq4000 at the QB3 Genomics Core at the University of California, Berkeley or a NovaSeq6000 at the UT Arlington North Texas Genome Center. Prior to assembly, adapters and low-quality bases (q < 5) were removed with TrimGalore! (https://www.bioinformatics.babraham.ac.uk/projects/trim_galore/), which implements Cutadapt (Martin 2011). Read pairs shorter than 36 bp after trimming were discarded, as were unpaired reads. The quality of processed reads was assessed with FastQC (http://www.bioinformatics.babraham.ac.uk/projects/fastqc/). Transcriptome assembly of each sample was performed de novo using Trinity (Grabherr et al. 2011) incorporating all paired reads following the standard protocol.
Nonvisual Opsin Sequence Recovery
Eighteen nonvisual opsin coding sequences were extracted from frog genomes, consisting of six neuropsins (NEUR1 to 6), encephalopsin (OPN3), two melanopsins (OPN4m and OPN4x), PAR, PARA, PIN, retinal g-protein coupled receptor (RGR), RRH, three teleost multiple tissue opsins (TMT1 to 3), and VAOP, using query sequences from tetrapods (Gemmell et al. 2020) and nucleotide BLAST searches (Altschul et al. 1990). We used the discontiguous megablast approach with an e-value cutoff of 1 × 10⁻¹⁰ to identify transcript hits, which were imported into MEGA, aligned with the reference, and manually trimmed to the coding sequence ensuring the longest open-reading frame was recovered. Gene identifications were confirmed by BLAST searches against the NCBI nucleotide database and later by phylogenetic analysis. Partial transcripts of the same gene (e.g. due to incomplete transcript assembly or sequence coverage) were combined to produce as complete a coding sequence as possible. We found that fully automated approaches often produced incomplete or incorrect transcripts. Complete sequences were compiled and in turn used as queries for additional BLAST extraction from the frog eye transcriptomes and genomes and for searches against the NCBI nucleotide database. BLAST results from whole genomes were extracted using a custom parser. Recovered coding sequences for each gene were assembled and aligned using codon alignment with MACSE (Ranwez et al. 2011). Alignments were manually edited to remove terminal stop codons, remove unique insertions, and trim nonhomologous regions that were due to annotation errors or transcript variants. When present, premature stop codons were converted to sequence gaps to enable their inclusion in downstream analyses (Yohe et al. 2017; Janiak et al. 2018). Several genes showed considerable variation at the beginning or ends and these were aligned using PRANK codon alignment, which can better resolve insertions, but at the cost of increased computation time (Löytynoja and Goldman 2005). A coding sequence was considered whole if it was recovered in entirety from start to stop codon, and partial if the sequence was incomplete but more than 50% of codons were recovered relative to the reference sequence. Coding sequences were excluded from analyses if less than 50% of codons were recovered.
Species Trait Classification
Frog species were partitioned into seven binary trait categories that we predicted to influence the evolution of nonvisual light detection. The adult activity period partition separated diurnal (including strictly diurnal and mixed diurnal/nocturnal species) vs. nondiurnal species. Our three adult habitat partitions separated aquatic (including semiaquatic) vs. nonaquatic, scansorial vs. nonscansorial, and secretive (defined as species with lifestyles generally dominated by low-intensity light, including fossorial, burrowing, and leaf-litter species) vs. nonsecretive. We used a distribution partition as a proxy for seasonality, separating tropical vs. nontropical species. Our life history partition separated direct developing vs. biphasic species. Finally, our pupil shape partition separated species with elongated (horizontal or vertical pupils) vs. nonelongated pupils (other symmetrical shapes), because this distinction appears to be ecologically meaningful in frogs (Thomas et al. 2022a). Partitions for all traits are illustrated in Fig. 3. We used peer-reviewed literature, online natural history resources, field guides, and field observations to partition species into these trait categories (supplementary table S4, Supplementary Materials online). These partitions largely conform to trait scoring in previous studies of frog visual biology (Thomas et al. 2020, 2022a, 2022b; Mitra et al. 2022; Schott et al. 2024a).
Selection Analyses
To estimate the strength and form of selection acting on anuran nonvisual opsins, each data set was analyzed using codon-based likelihood models from the codeml program of the PAML 4 software package (Yang 2007). Maximum likelihood (ML) gene trees were inferred using PhyML 3 (Guindon and Gascuel 2003) under the GTR + G + I nucleotide model with a BioNJ starting tree, the best of NNI and SPR tree improvement, and approximate Bayes-like branch supports (aByes; Anisimova et al. 2011). Because individual gene trees do not always reflect species’ evolutionary histories, it is a common approach in selection analyses to compare results from gene-tree topologies to those that reflect the current understanding of evolutionary relationships among species (species-tree topology) to ensure that results are robust to minor topological differences (e.g. Schott et al. 2018; Van Nynatten et al. 2021). To produce species-tree topologies for each gene, we generated a topology that matched expected species relationships based on several large-scale phylogenies (Pyron and Wiens 2011; Feng et al. 2017; Jetz and Pyron 2018; Streicher et al. 2018) and trimmed these to match the taxon sampling of the individual genes (Boyette et al 2024).
All analyses were performed twice; once using the ML gene-tree topology, and again using the species-tree topology. All topologies were rooted on Ascaphus truei and modified to contain the basal trichotomy required by PAML 4. PAML analyses were carried out for each alignment with the two tree topologies using the BLASTPHYME interface (Schott et al. 2019). Random site models (M0, M1a, M2a, M2a_rel, M3, M7, M8a, and M8) were used to estimate the rates of nonsynonymous to synonymous nucleotide substitutions (ω or dN/dS), infer alignment-wide selection patterns, and test for positive selection acting on nonvisual opsin genes. For genes with evidence of positively selected sites, we used BUSTED (Murrell et al. 2015), implemented on the Datamonkey webserver (Delport et al. 2010), to test for evidence of synonymous rate variation that could influence our estimates of positive selection. To test if shifts in selection among nonvisual opsins corresponded to variation in adult activity period, adult habitat, distribution, life history, and pupil shape, we used PAML CmC (Bielawski and Yang 2004). These clade models test for evidence of a codon site class demonstrating a shift in selection between prepartitioned “foreground” and “background” groups (e.g. diurnal frogs and nondiurnal frogs), which can be any combination of branches and clades within a phylogeny. CmC is compared to the null model M2a_rel and assumes that some sites evolve conservatively across the phylogeny (two classes of sites where 0 < ω0 < 1 and ω1 = 1), whereas a class of sites is free to evolve differently among two or more partitions (e.g. ωD1 > 0 and ωD1 ≠ ωD2 > 0; Weadick and Chang 2012). The partition schemes were tested in each nonvisual opsin, with each partition corresponding to one of the seven binary trait categories illustrated in Fig. 3. PAML analyses were run using varying ω starting values (1, 2, and 3) to increase the likelihood of finding global optima. If models failed to converge (worse likelihood score than the null model), we increased the range and frequency of starting values (e.g. 0.5 intervals from 0.5 to 3.5). Significance and best fit among model pairs were determined using a LRT with a χ2 distribution and a significance threshold of 5% (α = 0.05).
In cases where PAML analyses found significantly elevated ω in a particular group of interest (e.g. elevated ω in diurnal frogs compared to nondiurnal frogs), we used RELAX (Wertheim et al. 2015), implemented on the Datamonkey web server (Delport et al. 2010), to determine if the elevated ω was the product of relaxed selective constraint (i.e. lack of selection against a change) or adaptive selection (i.e. selection for a change). Such a distinction is useful when attempting to interpret the biological significance of an elevated ω value. RELAX produces a selection intensity parameter, or K value, which modulates the degree to which different ω site classes diverge from neutrality (ω = 1) in prepartitioned background and foreground groups. When K < 1, this indicates relaxed selection on foreground group branches compared to background group branches. Alternatively, when K > 1, this indicates adaptive selection on foreground group branches compared to background group branches.
Supplementary Material
Supplementary material is available at Molecular Biology and Evolution online.
Acknowledgments
We thank the following field companions who helped obtain specimens for this work: Hannah Augustijnen, Abraham G. Bamba Kaya, C. Guillherme Becker, Gabriela Bittencourt-Silva, Itzue Calviedes Solis, Patrick Campbell, Diego Cisneros-Heredia, Simon Clulow, Christian L. Cox, Mateo Davila, Paul Doughty, Juvencio Eko Mengue, TJ Firneno, Carl Franklin, Philippe Gaucher, Ivan Gomez- Mestre, Shakuntala Devi Gopal, Jon and Krittee Gower, Célio F. B. Haddad, Anthony Herrel, Sunita Janssenswillen, Jim Labisko, H. Christoph Liedtke, Simon Loader, Simon Maddock, Michael Mahony, Renato A. Martins, Matthew McElroy, Christopher Michaels, Nicki Mitchell, Justino Nguema Mituy, Diego Moura, Martin Nsue, Daniel M. Portik, Ivan Prates, Kim Roelants, Corey Roelke, Lauren Scheinberg, Bruno Simões, Ben Tapley, Elie Tobi, Rose Upton, Mark Wilkinson, and Molly Womack. We thank the Gabon Biodiversity Program and Bioko Biodiversity Protection Program for logistical support in the field; Grant Webster, Scott Keogh, and Jared Grummer for advice on where to find key species; Carolina Reyes-Puig for help with specimen numbers; and Jodi Rowley and Stephen Mahony for assistance exporting tissues for analysis. Sampling was conducted following IACUC protocols (NHMUK, NMNH 2016-012, UNESP Rio Claro CEUA-23/2017, UTA A17.005, ANU A2017/47) and with scientific research authorizations (the United States: Texas Parks and Wildlife Division SR-0814-159, North Cascades National Parks NCCO-2018-SCI-0009; Brazil: ICMBio MMA 22511-4, ICMBio SISBIO 30309-12; the United Kingdom: NE Licence WML-OR04; French Guiana: RAA: R03-2018-06-12-006; Gabon: CENAREST AR0020/17; Australia: New South Wales National Parks & Wildlife Service SL102014, Queensland Department of National Parks WITK18705517; Equatorial Guinea: INDEFOR-AP 0130/020-2019). This research was supported by grants from the Natural Environment Research Council, UK (NE/R002150/1), the National Science Foundation (DEB-1655751), and an NSERC Discovery Grant (to R.K.S.). J.L.B. was supported by the NMNH Natural History Research Experience REU program (NSF-OCE:1560088). The authors thank two anonymous reviewers and the Associate Editor for constructive feedback that substantially improved the manuscript.
Data Availability
The data underlying this article are available on NCBI under Bioproject PRJNA1073881 and on Zenodo (Boyette et al. 2024; Schott, Fujita, Streicher, Gower, Thomas, and Bell 2024), as well as in the Supplementary Materials online. See supplementary table S2, Supplementary Materials online for individual BioSample and SRA accession numbers.
