


Abstract
While whole-genome sequencing has been applied extensively to investigate the genetic diversity of global populations, ethnic minority groups in Pakistan are generally underrepresented. In particular, little is known about the genetic origin and highland adaptation of the Pamirian Wakhi people. According to Chinese historical records, the geographical location and language usage of Wakhi may be closely related to Xinjiang Tajiks. In this study, based on high-coverage (∼30×) whole-genome sequencing of eight Wakhi and 25 Xinjiang Tajik individuals, we performed data analyses together with worldwide populations to gain insights into their genetic composition, demography, and adaptive evolution to the highland environment. The Wakhi derived more than 85% of their ancestry from West Eurasian populations (European ∼44.5%, South Asian ∼42.2%) and 10% from East Eurasian populations (Siberian ∼6.0%, East Asian ∼4.3%). Modeling the admixture history of the Wakhi indicated that the early West–East admixture occurred ∼3,875 to 2,250 years ago and that the recent admixture occurred ∼750 to 375 years ago. We identified selection signatures across EGLN3, in particular, a distinctive evolutionary signature was observed, and a certain underlying selected haplotype showed higher frequency (87.5%) in the Wakhi than in nearby Xinjiang Tajiks and other highlanders. Interestingly, we found high-frequency archaic sequences in the Wakhi genome, which overlapped with several genes related to cellular signaling transduction, including MAGI2, previously associated with high-altitude adaptation. Our analysis indicates that the Wakhi are distinct from the Xinjiang Tajiks and Tajikistan Tajiks and sheds light on the Wakhi's ancestral origin and genetic basis of high-altitude adaptation.
Introduction
The Wakhan Corridor, a part of the ancient Silk Road, is located at the junction of Pakistan, Afghanistan, Tajikistan, and Xinjiang in China. The region once acted as an important trade route connecting South, East, and Central Asia. The Wakhi are native speakers of the Wakhi language, one of several languages belonging to the areal Pamir language group. They reside at the Pamirs’ crossroads in four neighboring countries: the Wakhan Corridor in Afghanistan, the Gilgit-Baltistan region in Northern Pakistan, the Gorno-Badakhshan region in Tajikistan, and Southwest Xinjiang in China (supplementary fig. S1a, Supplementary Material online). The Wakhi Tajiks of China are generally regarded as Tajik ethnic minority. All Wakhi people speak a similar language in the Indo-Iranian family, a branch of the Indo-European language family. The highland Tajiks are considered descendants of the ancient Scythians, based on anthropological and linguistic evidence (Han 1993; Kuzʹmina and Mallory 2007), although the population history of the ancient Scythians remains obscure. Nevertheless, historical and archeological studies support the Indo-Iranian-speaking ancient Scythian (also named Sai and Saka) settlement and dominance at the Pamirs’ plateau (Baumer 2012). This represents one wave of the eastward expansion of the Indo-European language family (Kuzʹmina and Mallory 2007). A study based on mitochondrial DNA reported a close genetic relationship among Pamiri Tajiks, Sarikoli Tajiks, and Wakhi Tajiks sampled from the Taxkorgan region of Xinjiang, China, indicating the spread of a single ancestry across the Pamirs (Chen et al. 2020). Conversely, Peng et al. (2018) reported that Wakhi Tajiks were separate from Pamiri and Sarikoli Tajiks and had a unique demographic history, with no increment of the female effective size occurring within 50 kya. The findings of these studies indicate the complex settlement of people at the Pamirs’ crossroads. Furthermore, biased sampling, different methodological perspectives, and the availability of limited genetic materials have led to contrary findings. Thus, the demographic history and genetic relationship between the Wakhi, Tajikistan Tajiks (TJTs), and Xinjiang Tajiks (XJTs) remain obscure.
The Pamirs’ highland, at an altitude of >3,000 m, is situated at the junction of the Hindu Kush Himalayan, Karakoram, Tien Shan, and Kunlun ranges. It features harsh and hypoxic conditions, low temperature, intense ultraviolet radiation, and low barometric pressure, making the environment challenging for humans to colonize. The adaptive biological features and demographic perspectives of Pamirian highlander populations have also been less studied than other highlander groups, including the Tibetans, Ethiopians, and Andeans. Sulaiman et al. (2021) compared the hematological parameters of native Tajiks, including Wakhi Tajiks and Kyrgyz Pamirian highlanders, with lowland Uyghurs and reported that Wakhi Tajiks and Kyrgyz showed significantly lower SaO2 (arterial oxygen saturation) but higher red blood cell and hemoglobin levels than lowland Uyghur populations. The lack of population-scale whole-genome data has seriously limited the knowledge about the genetic origin, demography, microevolutionary patterns, and genetic relationships among people residing at the Pamirs’ crossroads. Therefore, we performed deep genome sequencing (>30×) of the Wakhi residing in a remote region of Gilgit-Baltistan, Pakistan, and XJTs from Xinjiang, China, to shed light on the genetic origin, population structure, and highland adaptation of Pamirian populations.
Results
Genetic Relationships of the Wakhi in the Context of Global Populations
Principal component analysis (PCA) was performed based on genomic data of the Wakhi and XJTs and 203 worldwide populations from the Human Origins data set (Lazaridis et al. 2014) to infer the groups’ genetic affinities (see Materials and Methods and supplementary fig. S2, Supplementary Material online). After excluding non-Eurasians, we colored the samples in the plot of the first two principal components (PCs) according to their geographical positions in Eurasia. PC1 explains the variance between East Eurasian (EES) and West Eurasian (WES) populations. Wakhi samples were surrounded by WES, South Asian (SAS), and Central Asian/Siberian (CAS) populations, away from East Asian (EAS) populations. This result suggests the close genetic affinity of the Wakhi to WES people, rather than EES people (Fig. 1a). Additionally, the PCA showed that the Wakhi and TJTs were clustered close to XJT, suggesting that these three populations are genetically close (Fig. 1b). However, a phylogenetic tree based on individual distance showed weak substructure within the three populations (supplementary fig. S3, Supplementary Material online).
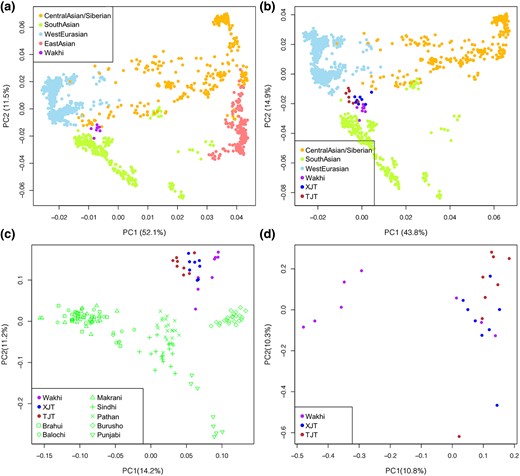
PCA of the Wakhi in the context of Eurasian populations. a to d) The first two PCs of Wakhi individuals and Eurasian samples. The reference populations were classified into four groups according to geographical regions: CAS, EAS, SAS, and WES. 348,618 SNPs were used in PCA analysis. a) PCA result of Wakhi and Eurasians. Wakhi samples were closely surrounded by CAS, SAS, and WES clusters. b) PCA results of Wakhi, XJTs, TJTs, CAS, SAS, and WES samples. c) PCA of Wakhi, XJT, TJT, and SAS populations. d) PCA of Wakhi, XJT, and TJT. The variance explained by each PC was calculated based on the top 10 eigenvalues.
As Wakhi samples were collected from Pakistan, we performed a separate PCA of the Wakhi, XJTs, and TJTs with other Pakistani populations, excluding two isolated population groups (Kalash and Hazara). The analysis identified that Wakhi samples were clustered with XJTs and TJTs, far from other Pakistani populations, suggesting shared ancestral components among the Wakhi, XJTs, and TJTs. Wakhi samples were also found to be genetically closer to XJTs than to TJTs (Fig. 1c). In addition, a significant interindividual difference was identified in Wakhi samples, and five Wakhi individuals split from the XJT and TJT clusters, as indicated by PC1 (Fig. 1d). The PC2 divided XJTs and TJTs, and other PCs showed much less variance than the first two PCs.
Genetic differentiation between the Wakhi and other worldwide populations was measured by FST (supplementary fig. S4a and supplementary table S3, Supplementary Material online). The analyses showed that the Wakhi was closely related to populations from WES, SAS, and CAS (supplementary fig. S4b to d, Supplementary Material online)—that is, in line with former PCA results (Fig. 1a and b). More specifically, the FST value between the Wakhi and XJTs was 0.0058 (2.5th to 97.5th percentile: 0.0052 to 0.0062), which is significantly less compared with the FST value between the Wakhi and any other populations. This result indicates a close genetic relationship between the Wakhi and XJTs. The FST value between the Wakhi and TJTs was 0.0061 (2.5th to 97.5th percentile: 0.0052 to 0.0069)—that is, next to the Wakhi and XJT difference. The phylogenetic tree based on FST showed the close genetic relationship among Wakhi, XJT, and TJT in the context of worldwide populations (supplementary fig. S5, Supplementary Material online).
We calculated the allele sharing distance (ASD) between a random pair of samples within the Wakhi and XJTs (see Materials and Methods and supplementary fig. S6, Supplementary Material online) to estimate the genetic diversity within Wakhi samples. The ASD value for Wakhi ranged from 0.226 to 0.245—that is, almost twice that of XJTs (0.11 to 0.123). This result suggests a higher degree of diversity among Wakhi samples compared with XJT samples, which is congruent with the PCA result. We also compared the heterozygosity of the Wakhi and XJT populations, along with sequencing data of 130 worldwide populations retrieved from the Simons Genome Diversity Project (SGDP) data set (Mallick et al. 2016). All the populations were classified into ten groups (supplementary fig. S7, Supplementary Material online). We found relatively higher heterozygosity for the Wakhi and XJTs, ranging from 0.28 to 0.29. This implies that the Wakhi and XJTs have higher genetic diversity than other non-African populations.
Additionally, we calculated the average total length and number of identity by descent (IBD) segments between every two samples at the interpopulation level to decipher the Wakhi ancestry in the context of worldwide populations. The analysis unveiled that the Wakhi shared the highest average length of IBD segments (13.347 Mb) with XJT, followed by Tajik (10.307 Mb) and Burusho (8.556 Mb) (supplementary fig. S8a and c, Supplementary Material online). Likewise, the numbers of shared IBD segments among these populations followed the same trend (supplementary fig. S8b and d, Supplementary Material online). A significantly large number of shared IBD segments between the Wakhi and XJTs indicate strong ancestral homology between these populations and split later during their demographic periods. We estimated a high correlation between the number and length of the IBDs shared by the Wakhi versus worldwide populations and between the XJTs versus worldwide populations in three categories (i.e. <1, 1 to 3, and >3 cM) (supplementary fig. S9, Supplementary Material online). The WES and SAS populations were observed to share lengthier and several IBD segments with the Wakhi and XJTs, again indicating their shared ancestry. The IBD between the Wakhi and some populations from SAS and WES was found to be relatively high, suggesting that Wakhi's ancestor is close to the WES and SAS populations. Likewise, the XJT and Wakhi shared more IBD segments than XJTs with other populations, which further reinforces the evidence of a shared ancestry between the XJT and Wakhi (supplementary fig. S10, Supplementary Material online). Under the same numeric range (length > 0.5 Mb, significantly longer than others), the XJT was found to share more IBDs with WE populations compared with the Wakhi, suggesting that XJTs are closer to WE populations.
Ancestry Composition and Admixture History of the Wakhi
The ADMIXTURE analysis was performed to reveal the ancestral composition of the Wakhi using the Human Origins population data set as a reference data set. We tested the number of ancestries, K, ranging from 2 to 20. When K was 8, the ancestral composition of Wakhi showed two major components, represented by the WES and SAS populations (Fig. 2). The analysis identified that the Wakhi held ∼44.5% of the WES ancestry and ∼42.2% of the SAS ancestry. The XJTs comparatively showed a larger WES ancestral component, ∼48.0%, while the SAS ancestry proportion for XJT was ∼37.0%. This result implies that the Wakhi and XJTs experienced different demographic histories after their split and that XJT may have received gene flow(s) from the WES ancestry recently. Likewise, the Wakhi may have received additional geneflow(s) from surrounding SAS populations during recent demography.
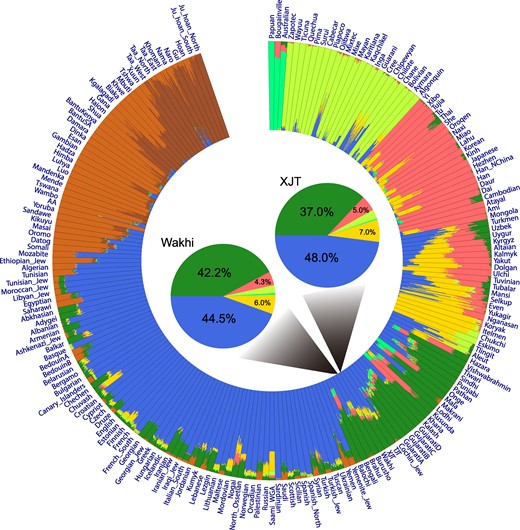
Unsupervised ADMIXTURE analysis (K = 8) pattern of the Wakhi in the context of worldwide populations. The admixture proportions were estimated using ADMIXTURE. Each individual is represented by a bar broken into eight colored segments with lengths proportional to the eight inferred clusters/ancestries. The genetic constitution of Wakhi and XJT is summarized and displayed in the two pie charts in the center of the circle plot; admixture components are denoted as percentages and with different colors. A total of 299,178 SNPs were used in this analysis.
To further examine the genetic admixture history of the Wakhi and XJTs, we first modeled their admixture using MultiWaver 2.0 (Ni et al. 2019) with WES and SAS ancestries. We used Sardinian and Basque as WES ancestral source populations, and Mala and Vishwabrahmin groups as SAS ancestral populations; these populations were observed to have the highest proportion of WES and SAS ancestries, respectively. We tested four possible models, and eventually, the continuous gene flow (CGF) model was identified as more suitable for Wakhi samples (supplementary fig. S13a, Supplementary Material online). The first wave of admixture for Wakhi was found to have occurred between WES and SAS ancestors (∼2,500 to 2,125 years ago, 25 years per generation), while the second wave was found to occur only from SAS ancestors (∼775 to 550 years ago). We calculated the admixture events of other WES-SAS-admixed populations, including XJT, TJT, Brahui, Sindhi, Pathan, and Burusho for comparison (supplementary fig. S13b, Supplementary Material online). The results show the gradient admixture (GA) model for XJTs. The early ancestral admixture of XJT occurred ∼4,250 years ago from WES and SAS ancestors, and the second wave of gene flow occurred ∼1,000 years ago. Therefore, although XJTs have a close genetic relationship with the Wakhi, the two populations experienced a differential admixture during later histories. The Wakhi were identified as having a comparatively younger population of WES and SAS ancestries.
Second, we calculated the admixture model based on the Eastern ancestries of Wakhi to possibly model the EES populations, including Siberian (SIB) and EAS admixture events. We used the data of populations holding the purest ones, the SIB and EAS ancestries. These ancestries included Itelmen and Koryak as SIB ancestral source populations and Han_south and She as EAS ancestral populations. The first wave of admixture was found to occur ∼6,500 to 4,800 years ago between the SIB and EAS ancestors, while the second wave was estimated to occur ∼2,050 to 1,575 years ago. A previous study based on the genetic origin of the Uyghur population (Xinjiang, China) (Feng et al. 2017) reported that the first admixture wave of Uyghur's Eastern ancestries occurred ∼5,500 to 5,000 years ago, somewhat overlapping with the first-wave admixture event of the Wakhi. As these populations reside in adjacent areas, we speculate that they have a similar admixture history.
Finally, to identify the systematic West–East admixture model, we used Balochi and Makrani as WES-SAS-admixed ancestral source populations and the Dolgan and Nganasan groups as SIB-EAS-admixed ancestral populations. These populations were selected because the relative ratio of the WES and SAS ancestral components of Balochi and Makrani was found to be close to that of the Wakhi, and likewise, the relative ratio of the SIB and EAS ancestral components based on Dolgan and Nganasan was found to be close to that of the Wakhi. The first wave of admixture was predicted to have occurred ∼3,850 to 2,250 years ago between Western and Eastern ancestors, while the second wave occurred only from Western ancestors—that is, ∼775 to 350 years ago (Fig. 3; supplementary table S4, Supplementary Material online). f statistics and qpGraph were used to further confirm the proportion of ancestral populations and explore the admixture graph of Wakhi (supplementary fig. S14 and supplementary tables S5 to S8, Supplementary Material online). We proposed an “admixture of admixture” model for Wakhi. In brief, early admixture occurred between the ancestral populations of WES and SAS ancestry in the West; meanwhile, admixture also occurred between the ancestral populations of EAS and SIB ancestry in the East. Subsequently, further admixture occurred between the mixed Western ancestries (WES-SAS) and the mixed Eastern ancestries (EAS-SIB). These ancestral populations of mixed ancestries experienced further complex admixture history and finally formed the present-day Wakhi population. Through parameter adjustment, we finally obtained the fitted admixture graph (score = 8.86 × 10⁻³), which supports the above “admixture of admixture” model. Our analysis confirmed four major ancestral components and suggested a high proportion of Western ancestors (∼70%).
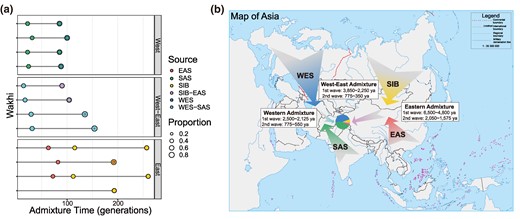
Population admixture and modeling admixture history of the Wakhi. a) Admixture time of Eastern (SIB-EAS) admixture, Western (WES-SAS) admixture, and West–East admixture in the Wakhi by MultiWaver. The representative populations (represented as colored balls) are as follows: WES, Sardinian and Basque; SAS, Mala and Vishwabrahmin; SIB, Itelmen and Koryak; EAS, Han_south and She; WES-SAS, Balochi and Makrani; SIB-EAS, Dolgan and Nganasan. b) Schematic map showing the possible admixture model of the Wakhi. Colored arrows indicate ancestral sources and directions of the gene flow. The Map of Asia was obtained from http://bzdt.ch.mnr.gov.cn/ No. GS(2016)2938.
Footprints of Natural Selection in Wakhi Genomes
We analyzed the imprint of archaic segments in Wakhi genomes using the ArchaicSeeker (Yuan et al. 2021) resource to learn about the adaptive introgression signals. We considered the Altai Neanderthal (Prufer et al. 2014), Vindija 33.19 (Prufer et al. 2017), and Denisovan (Meyer et al. 2012) as archaic hominins. The expected introgression frequency ranged from 0 (0/16) to 100% (16/16). We observed a maximum introgression frequency of 75% on chromosome 4, with a length of 871 bp (chr4: 6257188 to 6258059) for Wakhi genomic data. The region was annotated as noncoding, according to the Genome Browser. We assume these archaic segments may be a false positive result owing to their short length and noncoding annotation. Therefore, they may not be significant to consider for an adaptation signal in the Wakhi genome. We scanned all the single nucleotide polymorphisms (SNPs) located in archaic segments, and 0.2% of these archaic SNPs were found to have an introgression frequency of >50% in the Wakhi (supplementary fig. S15 and table S9, Supplementary Material online). Most of these SNPs were located in gene regions related to cell signal transduction (i.e. enrichment score 0.456; see supplementary table S10, Supplementary Material online) as unveiled after DAVID enrichment analysis (Huang da et al. 2009). Among these genes, membrane-associated guanylate kinase (MAGI2) was previously found to be associated with high-altitude adaptation (HAA) in Tibetan pigs’ genomes (Ai et al. 2014). Mutation of MAGI2 was also reported to cause kidney disease, endometrial cancer, and epilepsy encephalopathy (GeneCard; Stelzer et al. 2016). The gene ontology functional annotation of MAGI2 mainly includes signal transduction of metabolic waste and SMAD protein anchoring. The highest archaic introgression signal frequency of 56.25% was observed for the MAGI2 region in Wakhi genomes, indicating that the MAGI2 region may have experienced positive selection, which may be related to highland adaptation in the Wakhi (supplementary fig. S16, Supplementary Material online). The frequency of this archaic segment was found to be much lower in other worldwide populations than in the Wakhi. Likewise, comparatively less introgression signal frequency was observed at MAGI2 for XJTs and Tibetan highlander populations, 19.7% and 16.7%, respectively. In addition, we constructed a haplotype network using 98 SNPs located in MAGI2. The haplotypes from Wakhi, XJTs, Tibetan highlanders, Africans, and three archaic populations (Vindija 33.19, Altai Neanderthal, and Denisovan) were included (supplementary fig. S17, Supplementary Material online). The network indicates the existence of archaic haplotype introgression in MAGI2. Thus, we propose that the Wakhi may have undergone population-specific adaptation in the MAGI2 region, possibly associated with highland adaptation. Next, we examined natural selection signals via the integrated haplotype score (iHS) method (Voight et al. 2006), based on the decay of haplotype homozygosity. We ranked all SNPs by sorting FST values between the Wakhi and XJTs on the scale of the whole genome and filtered out SNPs with an FST value larger than the top 1% threshold. Furthermore, SNPs that did not reach the top 1% significant iHS windows threshold were filtered out (the genome-wide distribution of iHS score of Wakhi and XJT samples; see supplementary fig. S18, Supplementary Material online). This eventually prioritized 1,578 candidate SNPs in 112 windows, distributed over 20 chromosomes and representing significant selection signals across the Wakhi genome. These selection loci were mapped within 108 genes (DAVID enrichment results; see supplementary table S11, Supplementary Material online). We narrowed the selection scale by taking the overlap of top 0.1% FST and top 1% iHS results (supplementary table S12, Supplementary Material online) and finally focused on two genes, EGLN3 and PCDH15, which were previously reported in association with HAA. EGL-9 family hypoxia-inducible factor 3 (EGLN3) is involved in cellular signaling regulation in a hypoxic environment. The prolyl hydroxylase EGLN3 is expressed in the cell nucleus and cytoplasm and mediates hypoxia-inducible factor (HIF) hydroxylation followed by proteasomal degradation under normoxic conditions (Xie et al. 2009; Chen et al. 2011; Luo et al. 2011). However, under hypoxic conditions, the hydroxylation reaction is attenuated, allowing HIFs to escape degradation, resulting in their translocation to the nucleus and the increasing expression of hypoxia-inducible genes (Epstein et al. 2001; Huang et al. 2002). EGLN3 is a well-known locus previously reported in association with HAA in Tibetan and Ethiopian highlanders’ genomes (Bigham 2016). According to the information from the literature-derived human gene-disease network (Bundschus et al. 2008), EGLN3 is associated with altitude sickness and anoxia. A total of 32 SNPs in the EGLN3 region showed significant positive selection signatures (supplementary table S13, Supplementary Material online). We measured the linkage disequilibrium (LD) of this region, and 12 SNPs showed strong LD (Fig. 4a). However, no long haplotype was found during this analysis, and a haplotype (i.e. “GCCATTCCCCCC”) was found at the highest frequency (87.5%) in the Wakhi. However, in the case of the XJT population, the same 32-SNP-containing region was found to consist of two linked blocks of 42 and 16 kb with frequencies of 0.457 and 0.565, respectively (Fig. 4b). These two blocks were found to have a high probability of simultaneous linkage inheritance. The frequency of predominant Wakhi's haplotype (i.e. “GCCATTCCCCCC”) was also found at a 0.413 frequency in the same region in the XJT population. We analyzed Tibetans and WES, SAS, EAS, SIB, Oceania, American, and African populations at the same loci for additional comparison. The LD block composition was similar to XJTs’, especially in the case of the WES and SIB populations (supplementary fig. S19, Supplementary Material online). Ultimately, the results show that Wakhi's haplotype frequency (87.5%) in a specific region of EGLN3 was much higher than XJTs’ (41.3%) or any other populations’ (Fig. 4c). This indicates a unique selection pattern across EGLN3 in the Wakhi genome that possibly affects gene expression and may provide the unique basis for biological adaptation.
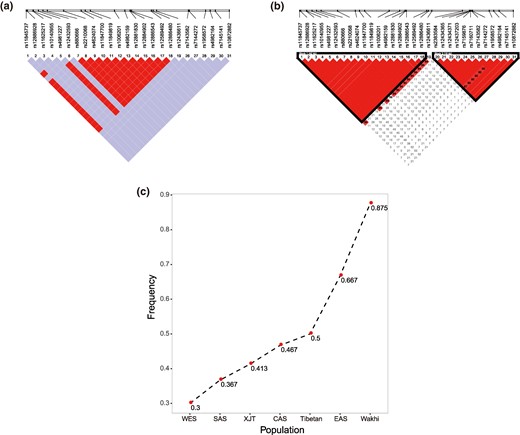
Detection of selection signals in the EGLN3 region. LD in the EGLN3 region detected selection signals in the Wakhi genome a) and the XJT genome b). c) Haplotype frequency of the EGLN3 region that detected a selection signal in the Wakhi genome and other populations’ genomes.
Protocadherin-related 15 (PCDH15) is a calcium-dependent cell adhesion protein that is essential in maintaining the normal function of the retina and cochlea. The selection signal across the PCDH15 was studied in the case of a Tibetan chicken's genome study (Zhong et al. 2018). In the current study, we found few selection signals (six significant SNPs) in the PCDH15 region and no specific haplotypes and mutations for the Wakhi and XJTs.
Discussion
Our deep-sequenced genomes allowed us to study the demography and HAA of the Pakistani Wakhi in the context of closely related XJTs and other worldwide populations. We performed PCA, admixture, FST, and IBD block estimation and eventually found that the Wakhi population held WES and SAS major ancestries, with multiple waves of West–East admixture. The Wakhi's genetic composition was close to that of the XJTs and TJTs, instead of that of surrounding Pakistani populations. The analyses suggested that the Pakistani Wakhi, XJTs (Chinese), and TJTs originate from common ancestors. We performed additional analyses, including FST, heterozygosity, IBD, and ancestral admixture models, to further verify the aforementioned assumption. The Wakhi and XJT populations were found to have a high level of heterozygosity when compared with other worldwide populations. The low FST values between the Wakhi and XJTs indicate close genetic affinity between them. However, the intrapopulation genetic difference of the Wakhi was almost twice that of XJTs, implying the higher genetic diversity of the Wakhi than XJTs. Likewise, the IBD sharing between the Wakhi and XJTs was comparatively longer than that of the Wakhi and any other populations. These analysis results suggest that the Wakhi and XJT ancestries separated later during evolution, leading to their genetic similarity. In addition, both the Wakhi and XJTs had long shared IBD segments with WES and SAS, which implies that their ancestral components mainly came from WES and SAS ancestries. We confirmed this assumption through ADMIXTURE analysis and admixture graph (based on f statistics) and found both the Wakhi and XJTs as admixed populations of the WES-SAS major ancestries and SIB-EAS minor ancestries. However, Wakhi's ancestral admixture events were found to have occurred later, along with distinction in the admixture type. This implies the differential admixture histories of the closely related Wakhi and XJTs. The complex cross-continental admixture identified here in the case of the Wakhi has also been reported for other populations residing in the northern and northwestern parts of Pakistan (Khan et al. 2022). Archeological, linguistic, and genetic studies have formerly reported that populations residing in the northern and northwestern parts of the Indian subcontinent were heavily influenced by the Bronze Age immigrants from Southern Siberia during the second millennium BCE (Damgaard et al. 2018; Narasimhan et al. 2019). The EAS ancestry feature observed for Wakhi was also reported previously for the neighboring Balti population that resides close to the Wakhi in the Karakoram Mountain valleys. This EAS admixture event in Balti was found to have occurred around 21 to 39 generations ago (i.e. close to the estimation acquired for the Wakhi group) and was linked to the Tibetan Empire expansion in the region from 869 to 1391 CE (Yang et al. 2021).
We also discovered the signal of natural selection in the Wakhi genome across important genes involved in cell signal transduction regulation. An outstanding example is MAGI2, previously reported to hold a significant selection signal in Tibetan pigs’ genomes (Ai et al. 2014). As the Wakhi population has resided since ancient times in the Pamirs’ highland environment in the Gilgit-Baltistan region of Pakistan, we speculate that the loci may have undergone selection in response to highland adaptation. The highest archaic introgression proportion in the Wakhi genome at MAGI2 compared with the rest of the worldwide population also implies a unique selection trend in the Wakhi population compared with other highlander populations. Likewise, a strong signal of natural selection was observed across other highland adaptive loci, including the well-known EGLN3. A unique predominant haplotype that exists at the EGLN3 loci in the Wakhi implies a distinctive natural selection trend in response to highland adaptation. Due to the difficulty of collecting samples at high altitudes, our study only included eight Wakhi samples. A small sample size might underestimate the overall mutations as rare mutations are likely missed to some degree and no sufficient statistical power can be obtained. Therefore, there is a need for additional genomic studies based on large sample sizes and functional gene expression regulation to help us decipher more highland selection trends in the Wakhi population.
Conclusions
The analyses based on deep genome sequencing data unveiled the close genetic relationship between the Wakhi and XJTs. Multiple waves of cross-continental genetic admixture were observed in the case of the Wakhi and XJTs, with slight variation in admixture dating (<500 years). Moreover, the selection signals related to archaic introgression and HAA were detected in the case of these populations for several candidate genes, including EGLN3. A unique selected haplotype prevalence at high frequency in the EGLN3 region hints at distinctive highland adaptation in the Wakhi. Additional functional studies may provide deeper insights into the genetic specificity of the Wakhi's highland adaptation.
Materials and Methods
Samples Collection and Ethical Statement
Wakhi samples were collected from villages on the northern plateau of Gilgit-Baltistan, Pakistan (supplementary fig. S1, Supplementary Material online). According to basic information (gender, age, kinship, longitude, and latitude) and sequencing quality, we selected eight unrelated samples from the original data (for details, see supplementary table S1, Supplementary Material online). The 25 XJT samples were collected from a village in Taxkorgan County, Xinjiang Province, China, located in the southwestern plateau of Xinjiang, China. All the samples were sequenced using the HiSeq X Ten platform. To ensure each sample was the offspring of a nonconsanguineous marriage of people within three generations, we have removed two XJT samples based on the kinship coefficient with KING analysis (Manichaikul et al. 2010) (supplementary table S2, Supplementary Material online). This study was approved by the Ethical Review Committee of Abdul Wali Khan University Mardan (AWKUM) under the letter Ref:AWKUM/ERC/569 and was performed in accordance with the 1975 Helsinki Declaration and later amendments. Informed consent was obtained from all study participants, and personal identifiers were removed from samples before sequencing and analysis.
Genomic DNA Sequencing and Variants Calling
Whole-genome sequencing with high target coverage (30 to 60×) for 150-bp paired-end reads was performed on an Illumina HiSeq X Ten platform according to Illumina-provided protocols, with standard library preparation at WuXi NextCODE (Shanghai). Each sample was run on a unique lane with at least 90 GB of data that had passed filtering, and read data were quality controlled so that 80% of the bases achieved at least a base quality score of 30. Reads were merged, adaptors were trimmed, and sequences were mapped to the human reference genome (GRCh37) using the Burrows–Wheeler Aligner v0.7.17 (Li and Durbin 2010). The Picard v1.117 (http://broadinstitute.github.io/picard/) was used to mark duplicate reads after mapping. Local indel realignment and Base Quality Score Recalibration were performed with the Genome Analysis Toolkit (GATK) v3.6 (McKenna et al. 2010; DePristo et al. 2011). Variant calling was executed through the HaplotypeCaller of GATK, using the gvcf mode. All samples were integrated with reference populations by a joint call and implemented strict quality control through Variant Quality Score Recalibration and a universal mask. Default parameters were used in the GATK pipeline. Only the biallelic single nucleotide variants were kept for further analysis. Finally, 29,394,616 SNPs were obtained in eight Wakhi samples and 23 XJT samples (based on the dbSNP147 database).
Data Merge and Filtration
We used the Affymetrix Human Origins Array (Lazaridis et al. 2014) and SGDP sequencing data (Mallick et al. 2016) respectively for comparison with Wakhi under a global context. Human Origins data set contains 600,841 SNPs for 2,345 individuals from 203 populations and it was used for PCA, FST, IBD, ADMIXTURE, and natural selection analysis. SGDP data set contains 1,152,838 SNPs for 300 individuals from 142 populations and it was used for heterozygosity analysis. We have removed 251 individuals based on kinship coefficient using KING (Manichaikul et al. 2010), and SNPs were filtered through Plink v1.9 (Purcell et al. 2007) with parameters: missing rate (10%), minor allele frequency (5%), and LD (linkage disequilibrium, --indep-pairwise 200 25 0.8).
Statistical and Population Genetic Analysis
The PCA was performed based on EIGENSOFT v6.0.1 (Price et al. 2006) and mainly focused on the first and second PCs. To uncover fine-scale population structure, we performed a series of PCAs using smartpca in EIGENSOFT by removing unrelated samples gradually based on the PC1 and PC2 on the identical set of SNPs. The maximum likelihood tree of populations was calculated by RAxML (Stamatakis 2014). We used VCFtools v0.1.15 (Weir and Cockerham 1984; Danecek et al. 2011) to calculate FST. The 95% quantile interval (QI) was calculated by bootstrapping. A neighbor-joining tree was generated based on FST using Phylip v3.695 (Felsenstein 1989) and was drawn using MEGA7 (Kumar et al. 2016). We also calculated heterozygosity using VCFtools. We used GERMLINE v1.5.3 (Gusev et al. 2009) and Plink v1.9 (Purcell et al. 2007) to calculate the average length and average number of IBD segments between individuals, removing self-IBD segment matches. The minimum length for the match to be used for imputation was 0.5 Mb (parameter “-min_m 0.5”).
Admixture History Estimation
We performed admixture analysis based on the unsupervised model with ADMIXTURE v1.3.0 (Alexander et al. 2009), in random seeds from K = 2 to K = 20 with default parameters in ten duplications for each K, and we identified the best replicate as the one where the log-likelihood was the biggest in ten duplications (supplementary figs. S11 and S12, Supplementary Material online). Because ADMIXTURE and smartpca do not consider LD, we generated an LD-pruned data set using PLINK v1.9 (Purcell et al. 2007) with the parameter “--indep-pairwise 200 25 0.5.” We used ADMIXTURE to calculate ancestral components (K = 8 for the Human Origins data set). Based on the components from WES, SAS, SIB, and EAS populations, we chose and tested different populations that possibly represent the WES-SAS-admixed population and the SIB-EAS-admixed population. For the WES-SAS-admixed population, we set the relative ratio of WES to SAS ancestries as 0.513:0.487, and for the SIB-EAS-admixed population, we set the relative ratio of SIB and EAS ancestries to 0.583:0.417. We used HAPMIX (Price et al. 2009) to calculate local ancestral sources and their percentage. We were concerned about the parameter “LAMBDA” during testing because it affects the value of |loglikelihood|, and the smaller value represents a more reliable result. We finally chose Balochi and Makrani to represent the WES-SAS-admixed population and Dolgan and Nganasan to represent the SIB-EAS-admixed population. MultiWaver 2.0 (Ni et al. 2019) was then used to make an inference about the admixture model. It used ancestry track inferred from HAPMIX as input, through analyzing the length distribution to infer the most likely admixture model. It calculated and compared the confidence intervals of different model types, including hybrid isolation, CGF, GA, and MultiWave (multiple wave) models, and it finally produced the most feasible model type and relative details. Default parameters were used for this analysis.
f Statistics
The f statistics were performed using ADMIXTOOLS (Maier et al. 2023). We have run both admixture and outgroup . We calculated the admixture- value in the form of (Wakhi; Source 1 and Source2) where Sources 1 and 2 represented candidate reference populations (WE, SIB, EA, and SA). More negative values and z-score < −2 suggested the candidates were closer to true ancestral populations. Outgroup (Yoruba; Wakhi, non-African source) was calculated to explore populations that were close to Wakhi. We estimated ancestry proportion according to ratio and qpAdm. We calculated the ratio in the formula of (Wakhi, Source 1; Papuan, Yoruba)/ (Source 2, Source1; Papuan, Yoruba), where Sources 1 and 2 were reference populations chosen from WES, SIB, EAS, and SAS. As for qpAdm, we chose the same reference populations as the left populations, and the value of “weight” was considered as proportion. We then built the evolution model with qpGraph. Based on the model generated by the automatic search (using function “find_graphs” with parameters “stop_gen2 = 10, max_admix = 5”), we designed a preliminary skeleton of the model. We further optimized the model to obtain the likelihood score < 3. Block-jackknife resampling was used to compute standard errors. Sardinian, Mala, Han, Itelmen, and Wakhi populations were chosen in this analysis. Yoruba was used as an outgroup.
Detection of Natural Selection Signals from Archaic Introgression
We used ArchaicSeeker 2.0 (Yuan et al. 2021) to detect ancestral segment introgression signals in the Wakhi genome. We chose genomic regions with an introgression frequency of more than 50%. The enrichment analysis of the genomic regions was performed through the DAVID resource (https://david.ncifcrf.gov). We compared the maximum archaic segments’ introgression signal frequency of the Wakhi and other populations. To explore the archaic haplotype introgression in the MAGI2 region, we constructed a haplotype network using pegas (Paradis 2010). We merged data from Wakhi, XJTs, Tibetan highlanders, Africans, Altai Neanderthal, Vindija 33.19, and Denisovan. Candidate SNPs were selected from the results of ArchaicSeeker 2.0, which have introgression frequency > 50% (nSNPs = 493). After data filtration (bcftools parameter: view -e ‘GT = “./.” | MAF < 0.05 | INFO/AF_YRI < 0.01'), we finally got 98 SNPs for haplotype network analysis. The haplotype pattern was visualized using a hierarchically clustered heatmap (method = ‘ward.D2'). The ancestral alleles were obtained from KGP database.
Identification of Candidate Variants Underlying Natural Selection
We selected and estimated candidate positions through the iHS in combination with FST statistics. We analyzed genome-wide data of the Wakhi together with 187 worldwide populations (sample size ≥ 5) from the Human Origins data set, comprising a total of 348,618 SNPs. We computed the whole-genome average, FST, for each pair of populations. We used the ancestral alleles from the 1000 Genomes Project (KGP) (Genomes Project et al. 2015). We only chose the loci with an ancestral allele (A, C, T, and G or a, c, t, and g) matching the “REF” or “ALT” allele in the VCF files. As a result, 28,775,828 SNPs were retained. iHS and its normalization were computed using Selscan version 1.2.0 (Szpiech and Hernandez 2014) with the default setting. The genetic map file was generated using an in-house script (https://github.com/Shuhua-Group/Calculate.genetic.distance) with a reference genetic map in KGP. After selection scan analysis, we performed variant identification and gene annotation through Variant Effect Predicter (VEP) v87 (McLaren et al. 2016). The LD and haplotype frequency were calculated through Haploview v2 (Barrett et al. 2005).
Public Data Sources
Public data sources are as follows:
SGDP: The Simons Genome Diversity Project: 300 genomes from 142 diverse populations[J]. Nature, 2016 (https://www.nature.com/articles/nature18964).
Human Origins: Human Origins genotype Reference Data Set from Lazaridis et al. (2014) (https://www.nature.com/articles/nature13673).
1000 Genomes Project phase 3 data: http://www.1000genomes.org/data.
GeneCards—the human gene database: www.genecards.org.
Data Analysis Software
Data analysis software is as follows:
Bwa: https://github.com/lh3/bwa.
GATK: https://github.com/broadinstitute/gatk.
VCFtools: http://vcftools.sourceforge.net/man_latest.html.
PLINK: https://www.cog-genomics.org/plink2.
Picard: http://broadinstitute.github.io/picard/.
EIGENSOFT: https://www.hsph.harvard.edu/alkes-price/software/.
GERMLINE: http://gusevlab.org/projects/germline/usage.html.
ADMIXTURE: http://dalexander.github.io/admixture/.
HAPMIX: http://www.stats.ox.ac.uk/~myers/software.html.
MultiWaver: http://www.picb.ac.cn/PGG/resource.php.
ArchaicSeeker: http://www.picb.ac.cn/PGG/resource.php.
pegas: https://emmanuelparadis.github.io/pegas.html.
Selscan: https://github.com/szpiech/selscan.
DAVID: https://david.ncifcrf.gov.
Haploview: https://www.broadinstitute.org/haploview/downloads.
VEP: http://asia.ensembl.org/info/docs/tools/vep/index.html.
PHYLIP: http://evolution.genetics.washington.edu/phylip.html.
MEGA: https://www.megasoftware.net/.
RAxML: https://cme.h-its.org/exelixis/web/software/raxml/index.html.
ADMIXTOOLS: https://uqrmaie1.github.io/admixtools/index.html.
Supplementary Material
Supplementary material is available at Molecular Biology and Evolution online.
Acknowledgments
We thank all the indigenous participants of this project. This study was supported by the National Key Research and Development Program of China (No. 2023YFC2605400), the National Natural Science Foundation of China (NSFC) grants (32030020 and 32288101), the Shanghai Science and Technology Commission Program (23JS1410100), the Office of Global Partnerships (Key Projects Development Fund). The data analysis of this study was supported by the CFFF Computing Platform of Fudan University. We thank LetPub (www.letpub.com) for its linguistic assistance during the preparation of this manuscript. The funders had no role in the study design, data collection, analysis, decision to publish, or preparation of the manuscript.
Author Contributions
S.X. conceived and designed the study and supervised the project. A.K. contributed to the sample collection. Y.L. managed data generation. W.X., J.L., X.Z., Q.F., Y.G., and Y.P. analyzed the data. J.W. prepared the additional materials. W.X., J.L., and X.Z. drafted the manuscript. S.X., W.X., and A.K. revised the manuscript. All authors discussed the results and implications and commented on the manuscript.
Data Availability
The genomic variation data of the Wakhi samples reported in this paper has been deposited in the National Omics Data Encyclopedia (NODE) under accession number OEP004083. The genomic variation data of Xinjiang Tajik are available in the Genome Variation Map (GVM), under the series number GVM000554. The genomic variation data only included chromosomes 1 to 22, no sex chromosomes.
References
Author notes
Wanxing Xu, Jiaojiao Liu and Xiaoxi Zhang contributed equally.
Conflict of Interest The authors declare no conflict of interests.
